

Abstract
Since the identification of the archaeal domain in the mid-1970s, we have collected a great deal of metagenomic, biochemical, and structural information from archaeal species. However, there is still little known about how archaeal cells organize their internal cellular components in space and time. In contrast, live-cell imaging has allowed bacterial and eukaryotic cell biologists to learn a lot about biological processes by observing the motions of cells, the dynamics of their internal organelles, and even the motions of single molecules. The explosion of knowledge gained via live-cell imaging in prokaryotes and eukaryotes has motivated an ever-improving set of imaging technologies that could allow analogous explorations into archaeal biology. Furthermore, previous studies of essential biological processes in prokaryotic and eukaryotic organisms give methodological roadmaps for the investigation of similar processes in archaea. In this perspective, we highlight a few fundamental cellular processes in archaea, reviewing our current state of understanding about each, and compare how imaging approaches helped to advance the study of similar processes in bacteria and eukaryotes.
BACKGROUND
The direct observation of bacteria and eukaryotes has yielded many insights into how these cells grow in given shapes, divide, and partition contents both within themselves and into their daughters. In contrast, our understanding of these same processes in archaea remains limited, even though there is a lot to explore: electron-microscopy of archaea revealed that there is a wide variety of different shapes, internal cellular organization, and previously unobserved structures (Figure 1). The lag in archaeal cell biology arises not from lack of interest but rather from challenges of imaging these extremophiles, which grow in high saline environments, extreme temperatures, or anaerobic conditions. Owing to recent technical developments in nanofabrication and microfluidics (Hol and Dekker, 2014; Wu and Dekker, 2016; Qi et al., 2017; Eun et al., 2018), some of these challenges may no longer be limiting. Within these customized fabricated microenvironments, we are now able to observe archaea grow and divide in their preferred extreme conditions. Likewise, it is becoming increasingly easy to label and observe archaeal proteins inside cells due to the development of cell-permeable photostable dyes (Grimm et al., 2017) and brighter, more photostable, and thermostable fluorescent proteins (Aliye et al., 2014; Rodriguez et al., 2017). As these innovations are combined with improvements in camera sensitivity and super-resolution microscopy, the field is poised to make huge leaps in the understanding of archaeal biology.
FIGURE 1:

The diversity of archaeal cell morphology and cellular structures. (A) Brightfield image of the triangular-shaped Haloarcula japonica cells. Image adapted from Nakamura et al., 1992. (B) The square and flat Haloquadratum walsbyi cells with DNA stained with acridine orange. Adapted from unpublished data provided by Mike Dyall-Smith. (C) Contrast-phase of rods and “golf clubs” cells of Thermoproteus tenax. Adapted from Zillig et al., 1981. (D) Scanning electron micrograph image of multicellular clusters of the coccoid Methanosarcina spp. culture from environmental samples. Adapted from Conklin et al., 2006. (E) Cryoelectron tomograph of a Thermococcus kodakaraensis cell showing a conical basal body (bottom structure) anchoring the archaellum (top structure) to the cytoplasm. Figure adapted from Briegel et al., 2017. (F) Electron micrograph of the cold-living SM1 euryarchaeon showing several pili-like hami fibers around the entire cell surface. Figure adapted from Moissl et al., 2005. (G) Electron micrograph of a section of a filamentous hamus showing its hook (tip) and prickle (body) structures. Imaged adapted from Moissl et al., 2005. All images were reused with permission.
MAINTENANCE AND PROPAGATION OF CELL SHAPE
The definition of organismal shape is a fundamental problem in biology; in most (but not all) cases, once cells define their overall geometry, they can then organize their contents within it. Microscopy has revealed that archaea encode a diversity of cell shapes, rods, squares, triangles, needlelike shapes, and nearly everything in between (Figure 1), raising the following question: What molecular processes generate and propagate these shapes?
The simplest start to understanding archaeal shape formation is to watch cells grow and divide. However, even the seemingly simple task of confining archaeal cells for microscopy can be challenging. A cell-size control study in Halobacterium salinarum was unable to use the traditional prokaryotic method of immobilizing cells under agarose pads (Eun et al., 2018), as even slight pressure caused cells to lose their shape (Figure 2A). To resolve this, the authors used nanofabricated soft lithographic chambers to create a confining yet observable environment where cell shape was unaffected (Figure 2B). Commercial microfluidics like the CellASIC (EMD Millipore) can provide microscopically accessible environments for the observation of extremophile growth and division (Figure 2C). Microfluidics are especially useful for halophilic archaea as media evaporation and salt crystallization are minimized. Other microfluidics like the mother machine (Figure 2D) allow the high-throughput imaging of thousands of cell lineages over long timescales (Wang et al., 2010; Potvin-Trottier et al., 2018).
FIGURE 2:
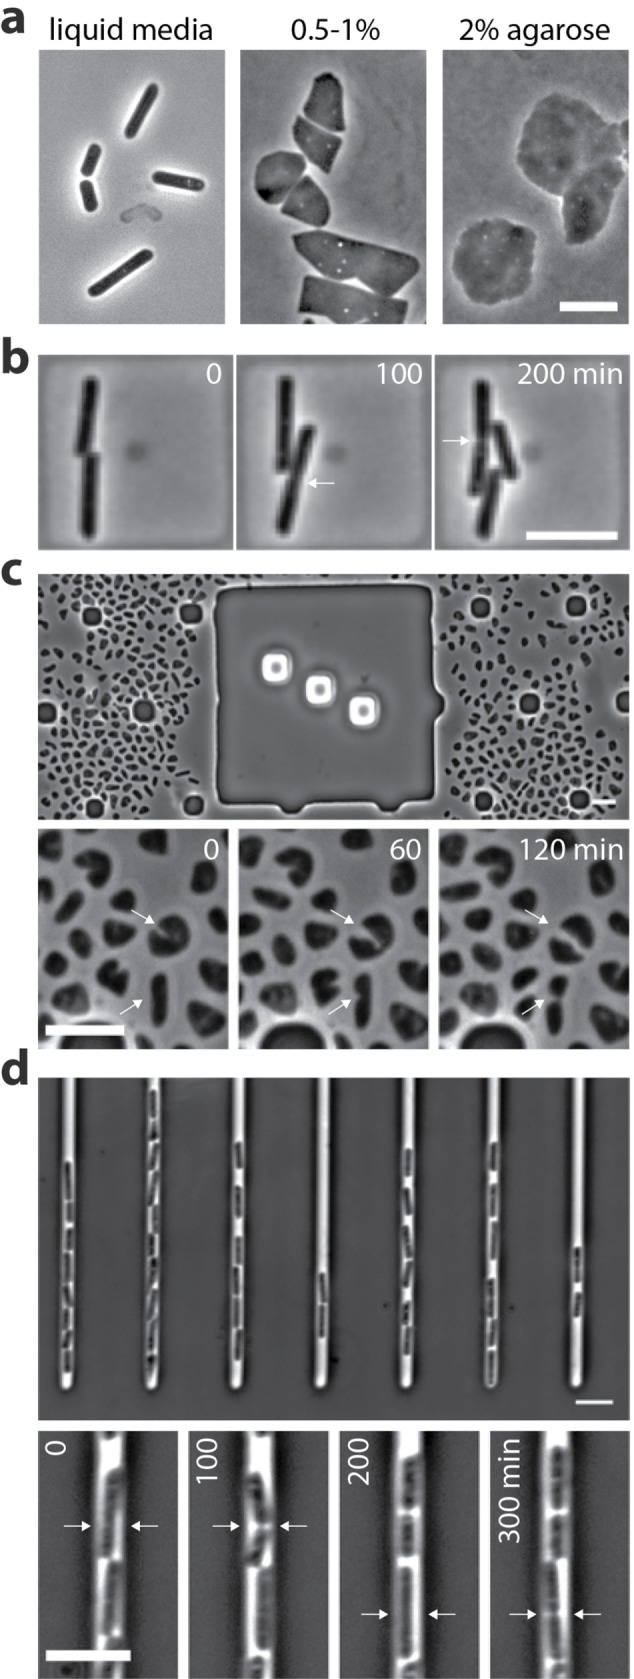
Live-cell imaging of halophilic archaea growing inside different devices. (A) Halobacterium salinarum rod-shaped cells imaged directly from liquid cultures (left) and after growing under agarose pads (center and right). Under pressure, cells lose shape and form different structures. Adapted from Eun et al., 2018, with permission; (B) Halobacterium salinarum cells growing inside nanofabricated soft lithographic microchambers. Note that here the cells maintain their rod shape. Collection of images are 100-min intervals apart. Adapted from Eun et al., 2018, with permission. (C) The CellASIC system enables growth and cell division of the pleomorphic archaeon Haloferax volcanii. Top, snapshot of Haloferax volcanii cells confined in CellASIC B04 plates. Bottom, time-lapse of H. volcanii cells dividing from area in the top figure. Images are 60-min intervals apart (unpublished data). Arrows indicate cells during cytokinesis. (D) The mother machine microfluidic device supports growth of H. salinarum cells at constant rates over several days. Top, Halobacterium salinarum cells loaded into the mother machine channels. Cells are loaded in the upper channel entrance and are expelled as they grow out of the top. Bottom, time-lapse from one channel at 100-min intervals (unpublished data). Arrows indicate cells undergoing cytokinesis. Scale bars = 5 µm.
More detailed insights into cell shape formation can be gained by observing the insertion, turnover, and movement of the material that holds cells in shape as they grow and divide. Many archaeal cells are coated by a rigid monolayer structure called the S-layer, an encapsulating, tightly packed, proteinaceous array composed of self-assembling glycosylated proteins (Albers and Meyer, 2011; Rodrigues-Oliveira et al., 2017). While the S-layer is essential for cell morphology (Engelhardt, 2007; Jarrell et al., 2014), it is not known where new material is inserted into or removed from the S-layer during growth. Are new subunits inserted all around the envelope, or is the material inserted at specific regions like the mid-cell or the poles? If so, what machinery determines the location of these sites?
Similar questions have been approached in bacteria and eukaryotes by using labeled probes that incorporate or bind to the cell surface; fluorescent lectins, that bind to sugars on the cell surface have been used to track the sites of insertion in fungal growth (May and Mitchison, 1986). Likewise, gold-conjugated d-cysteine incorporation into bacterial cell walls allowed the discovery that Escherichia coli has two modes of growth; material is added either throughout the entire length of the cell or exclusively at the poles (de Pedro et al., 1997). More recently, pulse–chase experiments of fluorescently labeled d-amino acids (FDAAs) revealed several different growth patterns in bacteria (Kuru et al., 2015; Pande et al., 2015). Similar pulse–chase experiments in archaea indicate they also contain a variety of growth modes (Wirth et al., 2011); by incubating cells with dyes that react with primary amines on the cell surface, it was found that the coccoid Pyrococcus furiosus grows primarily at the division site, while the rodlike Methanopyrus kandleri adds new material everywhere along its cell length.
PROBING CYTOSKELETAL ELEMENTS INVOLVED IN CELL SHAPE AND CELL DIVISION
All domains of life use self-assembling filaments to create and propagate their shape. Fungi use actin cables or microtubules oriented along the cell length as highways for the transport of material needed for growth at the cell poles (Wendland and Walther, 2005; Chang and Martin, 2009). In most rod-shaped bacteria, insertion of new cell wall material for both growth and division is controlled by short, mobile polymers that move circumferentially around the rod width. The actin homologue MreB orients to the greatest membrane curvature (Hussain et al., 2018), constraining enzyme activity so that new peptidoglycan is built in hoops around the rod (Domínguez-Escobar et al., 2011; Garner et al., 2011; van Teeffelen et al., 2011). During cell division, the tubulin homologue FtsZ treadmills around the division site, guiding the enzymes responsible for septal synthesis (Bisson-Filho et al., 2017; Yang et al., 2017).
While several different actin and tubulin homologues have been identified in archaea (Makarova and Koonin, 2010; Yutin and Koonin, 2012; Spang et al., 2015; Stoddard et al., 2017), the dynamics and function of these polymers are mostly unknown. Similarly to the early studies of microtubules (Kirschner and Mitchison, 1986; Borisy et al., 2016), observing their dynamics in vivo and correlating these motions to the processes they control could elucidate their function. Furthermore, the internal dynamics of filaments can be probed by sparsely labeling monomers within them (also known as “speckling”), as pioneered in microtubules (Waterman-Storer et al., 1998). As recently demonstrated by studies of FtsZ in bacteria, combining both of these approaches can lead to new insights; while fully labeled FtsZ filaments move directionally around the cell (Figure 3B), single monomers are immobile, indicating that this directional motion arises via filament treadmilling (Bisson-Filho et al., 2017; Yang et al., 2017).
FIGURE 3:

Archaeal machineries compared with bacterial and eukaryotic systems under the microscope. (A) Midcell localization of FtsZ1-GFP in the archaeon H. volcanii cells. Adapted from Duggin et al., 2015. (B) Localization and dynamics of bacterial FtsZ filaments. Left, three-dimensional structured illumination microscopy (3D-SIM) maximum intensity projection (MIP) of mNeonGreen-FtsZ in the bacterium Bacillus subtilis. Center and right, TIRF-SIM time-lapse showing FtsZ filaments moving directionally inside and outside Z rings. Images are 10 s apart (unpublished data). Arrows indicate the direction of the motion. (C) Immunofluorescence showing Crenactin filaments in Pyrobaculum calidifontis cells. Note the similarity with the MreB filaments in D. Adapted from Ettema et al., 2011. (D) Localization and dynamics of bacterial MreB filaments. Left, 3D-SIM MIP of MreB-HaloTag-JF549 in Bacillus subtilis. Center and right, TIRF-SIM time-lapse showing MreB filaments moving directionally around the rod circumference. Images are 5 s apart (unpublished data). Arrows indicate the direction of the motion. (E) Immunofluorescence showing the fluorescence of PCNA foci (red) over the chromosomes (blue) in Sulfolobus acidocaldarius cells (differential interference contrast [DIC]). Image adapted from Gristwood et al., 2012. (F) Time-lapse showing assembly and disassembly dynamics of DnaN-GFP in the bacterium B. subtilis. In minimal media, where growth is significantly slowed, predivisional cells contain two to four replication forks. Images are 60 min apart (unpublished data). Arrows indicate the location of the active replication forks reported by DnaN. (G) Localization and dynamics of mRuby-PCNA inside mammalian nuclei throughout different stages of the cell cycle. Concomitantly with DNA replication, PCNA foci appear during S-phase and then disassemble during mitosis. Note the oscillation in fluorescence from G1 through mitosis. Figure adapted from Zerjatke et al., 2017. All images were reused with permission.
Archaea also have tubulin homologues, including the FtsZ and CetZ families (Aylett and Duggin, 2017). While FtsZ is widespread among prokaryotes, CetZs appears to be unique to archaea. Interestingly, most archaeal genomes contain multiple ftsZ and cetZ homologues (Vaughan et al., 2004). The FtsZ1 homologue in the archaeon Haloferax volcanii localizes to the division site (Figure 3A) (Duggin et al., 2015). However, it is not known whether FtsZ2 and other homologues also localize to the division site, and if so, whether they coassemble with FtsZ1 into one filament or whether it forms independent structures recruited to the division site at different stages of the cell cycle. It is also not known whether, like their bacterial counterparts, archaeal FtsZ filaments treadmill or whether their dynamics regulate S-layer insertion. Interestingly, CetZ also localizes to the division site in H. volcanii but is not involved in cell division; rather CetZ appears to be required for both the rod shape of cells and their motility (Duggin et al., 2015). This suggests CetZ filaments may control where the cell adds new S-layer material for growth, a hypothesis that could be further investigated by correlating the localization and dynamics of CetZ during the transition to rod shape from other morphologies.
The most extensively studied archaeal actin homologue is crenactin (Lindås et al., 2014; Izoré et al., 2016). The presence of crenactin is correlated with rodlike shapes (Ettema et al., 2011). Furthermore, immunofluorescence of crenactin in the archaeon Pyrobaculum calidifontis shows spiral structures (Figure 3C), again hinting at a potential role in cell-shape control. This could be clarified by live-cell imaging of crenactin filaments; if crenactin and bacterial MreB are functionally equivalent, then crenactin filaments might show a directional motion linked to the insertion of S-layer (Figure 3D).
Imaging the in vivo dynamics of archaeal polymers faces challenges similar to their study in other prokaryotes, as these cytoskeletal filaments are close to the diffraction limit of light, often only a few hundred-nanometers in length or often too dense to be resolved. The use of illumination minimizing super-resolution techniques like total internal reflection fluorescence structured illumination microscopy, known as TIRF-SIM (Kner et al., 2009), or minimal emission fluxes, known as MINFLUX (Balzarotti et al., 2017), may allow better resolution of the structure and dynamics of archaeal cytoskeletal elements in live cells.
TRACKING CHROMOSOME SEGREGATION
One of the most essential biological processes is the partitioning of genetic material into daughter cells. In eukaryotes, the direct observation of chromosome and microtubule dynamics revealed that microtubules not only capture chromosomes but also measure the tension across the kinetochore to ensure proper copy number (Rieder and Alexander, 1990). Likewise, tracking chromosome dynamics in bacteria has revealed that both the replication origins and the replication machinery are spatially organized (Wang et al., 2013) and undergo directional motions. In Caulobacter crescentus, the newly replicated origin undergoes a biased, directional motion from one pole to the other (Viollier et al., 2004). This motion is driven by the Par system, a frequently occurring machinery that partitions chromosomes and plasmids (Gerdes et al., 2010), and of three components: 1) parS, a DNA sequence recognized by 2) ParB, and 3) ParAs, which pull the parS sites apart.
In contrast to eukaryotes and bacteria, we have a limited understanding of DNA segregation in archaea. The one exception is Sulfolobus, which provides the only known example of active DNA segregation in archaea. Sulfolobus contains only one chromosome that, following duplication, is segregated by two proteins, SegA and SegB (Kalliomaa-Sanford et al., 2012). SegA is a ParA homologue, and SegB binds to specific DNA sequences (Kalliomaa-Sanford et al., 2012). DNA-loci labeling in concert with SegAB tracking will reveal whether the SegAB system is pulling or pushing chromosomes to opposite poles.
While Sulfolobus actively partitions its single chromosome, the vast majority of identified archaea are polyploid, some of which have up to 55 chromosomes per cell (Hildenbrand et al., 2011; Barillà, 2016), leading to the suggestion that these archaea do not need machinery to actively segregate their DNA (Malandrin et al., 1999). However, these polyploid archaea are still able to maintain a given copy number when chromosomes are reduced to low numbers (Zerulla et al., 2014), suggesting they might contain a segregation mechanism. This could be tested by fluorescently labeling DNA loci and tracking their motions (Stracy et al., 2014). Alternatively, careful quantitation and analysis of chromosome number with single molecule fluorescence in situ hybridization (Wang et al., 2016) under different growth conditions could determine whether segregation is random or controlled.
TIMING DNA REPLICATION WITH THE CELL CYCLE
While the biochemical activity of the archaeal proteins involved in DNA replication is well characterized in vitro (Barry and Bell, 2006; Ausiannikava and Allers, 2017), little is known regarding their spatiotemporal regulation inside cells. In eukaryotes, the simultaneous visualization of DNA loci and the replication machinery revealed that DNA replication only takes place during one phase of the cell cycle (Kitamura et al., 2006). In contrast, visualizing the origins and replication machinery of bacteria revealed that, in most cases, replication occurs continuously throughout the cell cycle (Goranov et al., 2009; Kuzminov, 2013).
In many of these studies, fluorescent fusions to the sliding clamp were used to report both the location of DNA replication and the number of simultaneous replication forks. The sliding clamp, present in all domains of life, is a donutlike hexamer that stabilizes the DNA polymerase during replication (Matsumiya et al., 2001). Both the sliding clamps of bacteria (DnaN; Figure 3F) and eukaryotes (proliferating cell nuclear antigen [PCNA]; Figure 3G) localize as discrete foci over the chromosomes during replication and then disassemble when DNA synthesis is completed (Goranov et al., 2009; Yokoyama et al., 2016). Fluorescent fusions to the eukaryotic PCNA give the secondary benefit of providing a readout of the cell cycle (Zerjatke et al., 2017): foci appear at the beginning of S-phase and then disappear when PCNA proteins are degraded when S-phase ends (Figure 3G).
PCNA immunofluorescence in Sulfolobus shows foci similar to eukaryotic and bacterial cells. Surprisingly, these foci localize to opposite ends of the cell (Figure 3E), suggesting that DNA replication is restricted to the periphery (Gristwood et al., 2012). Fluorescent fusions to the PCNA could allow the study of both the timing and spatial organization of archaeal DNA replication. It will be exciting to determine whether, as in eukaryotes, archaeal PCNA foci reveal a cell-cycle-like oscillation, indicating a synchronous replication of chromosomes.
Visualizing DNA replication with fluorescent fusions to the PCNA may also allow us to understand how H. volcanii can not only survive but also grow faster in the absence of any replication origins (Hawkins et al., 2013). This fast-growing phenotype requires the DNA recombinase RadA, suggesting that recombination might serve an alternative route to replication initiation. Simultaneous visualization of PCNA and RadA could illuminate whether PCNA and RadA act in different phases throughout the cell cycle or whether the RadA mechanism only occurs in the absence of replication origins.
FUTURE OUTLOOK
While this review touched on a few fundamental biological processes, archaea show many other behaviors that are just beginning to be studied, such as archaellum-driven motility (Kinosita et al., 2016) and mating behavior (Rosenshine et al., 1989; van Wolferen et al., 2016). However, the archaeal community is still technically limited by what organisms can be cultivated and observed under a microscope. For instance, the development of sufficiently thermal-tolerant microscopes would facilitate the live imaging of thermophilies, some of which grow at temperatures exceeding 80°C, which is problematic for both the microscope stages and microscope objectives. Given that no commercial objectives can tolerate temperatures above 60°C, the solution could come from different fields. Material scientists have been using noncontact (air gapped) objectives for decades, as well as isolating their stages with heating devices and ceramic chambers. These setups have allowed them to image samples at temperatures above 1000°C (Boccaccini and Hamann, 1999). Adapting this technology for archaeal cell biology could open up an entire new field containing a multitude of new discoveries.
Metagenomics is rapidly increasing the number and diversity of existent organisms (Hug et al., 2016; Spang et al., 2017), leading to the recent discovery of the Asgard superphylum. These uncultured archaea include species containing a number of machineries specific to eukaryotes (Spang et al., 2015; Zaremba-Niedzwiedzka et al., 2017). Once we can culture these organisms and develop methods to visualize them, their biology becomes a wide-open frontier to probe the origins of eukaryotic cellular processes.
Acknowledgments
We thank the members of the Garner lab for comments on the manuscript and the Archaea community for discussions. We also thank Mike Dyall-Smith for kindly providing unpublished images of H. walsbyi cells. This work was supported by Wellcome Trust grant 203276/Z/16/Z and National Institutes of Health grant DP2AI117923-01 to E.G.
Abbreviations used:
- 3D-SIM
3D-structured illumination microscopy
- DIC
differential interference contrast
- FDAA
fluorescent d-amino acid
- MINFLUX
minimal emission fluxes
- MIP
maximum intensity projection
- PCNA
proliferating cell nuclear antigen
- TIRF-SIM
total internal reflection fluorescence structured illumination microscopy
Footnotes
REFERENCES
- Albers SV, Meyer BH. (2011). The archaeal cell envelope. Nat Rev Microbiol , 414–426. [DOI] [PubMed] [Google Scholar]
- Aliye N, Fabbretti A, Lupidi G, Tsekoa T, Spurio R. (2014). Engineering color variants of green fluorescent protein (GFP) for thermostability, pH-sensitivity, and improved folding kinetics. Appl Microbiol Biotechnol , 1205–1216. [DOI] [PubMed] [Google Scholar]
- Ausiannikava D, Allers T. (2017). Diversity of DNA replication in the archaea. Genes (Basel) , 1–14. [DOI] [PMC free article] [PubMed] [Google Scholar]
- Aylett CHS, Duggin IG. (2017). The tubulin superfamily in archaea. Subcell Biochem , 393–417. [DOI] [PubMed] [Google Scholar]
- Balzarotti F, Eilers Y, Gwosch KC, Gynnå AH, Westphal V, Stefani FD, Elf J, Hell SW. (2017). Nanometer resolution imaging and tracking of fluorescent molecules with minimal photon fluxes. Science , 606–612. [DOI] [PubMed] [Google Scholar]
- Barillà D. (2016). Driving apart and segregating genomes in archaea. Trends Microbiol , 957–967. [DOI] [PMC free article] [PubMed] [Google Scholar]
- Barry ER, Bell SD. (2006). DNA replication in the archaea. Microbiol Mol Biol Rev , 876–887. [DOI] [PMC free article] [PubMed] [Google Scholar]
- Bisson-Filho AW, Hsu YP, Squyres GR, Kuru E, Wu F, Jukes C, Sun Y, Dekker C, Holden S, VanNieuwenhze MS. (2017). Treadmilling by FtsZ filaments drives peptidoglycan synthesis and bacterial cell division. Science , 739–743. [DOI] [PMC free article] [PubMed] [Google Scholar]
- Boccaccini AR, Hamann B. (1999). In Situ high-temperature optical microscopy. J Mater Sci , 5419–5436. [Google Scholar]
- Borisy G, Heald R, Howard J, Janke C, Musacchio A, Nogales E. (2016). Microtubules: 50 years on from the discovery of tubulin. Nat Rev Mol Cell Biol , 322–328. [DOI] [PMC free article] [PubMed] [Google Scholar]
- Briegel A, Oikonomou CM, Chang YW, Kjær A, Huang AN, Kim KW, Ghosal D, Nguyen HH, Kenny D, Ogorzalek Loo RR, et al. (2017). Morphology of the archaellar motor and associated cytoplasmic cone in Thermococcus kodakaraensis . EMBO Rep , 1660–1670. [DOI] [PMC free article] [PubMed] [Google Scholar]
- Chang F, Martin SG. (2009). Shaping fission yeast with microtubules. Cold Spring Harb Perspect Biol , 1–14. [DOI] [PMC free article] [PubMed] [Google Scholar]
- Conklin A, Stensel HD, Ferguson J. (2006). Growth kinetics and competition between methanosarcina and methanosaeta in mesophilic anaerobic digestion. Water Environ Res , 486–496. [DOI] [PubMed] [Google Scholar]
- de Pedro MA, Quintela JC, Höltje JV, Schwarz H. (1997). Murein segregation in Escherichia coli. J Bacteriol , 2823–2834. [DOI] [PMC free article] [PubMed] [Google Scholar]
- Domínguez-Escobar J, Chastanet A, Crevenna AH, Fromion V, Wedlich-Söldner R, Carballido-López R. (2011). Processive movement of MreB-associated cell wall biosynthetic complexes in bacteria. Science , 225–228. [DOI] [PubMed] [Google Scholar]
- Duggin IG, Aylett CH, Walsh JC, Michie KA, Wang Q, Turnbull L, Dawson EM, Harry EJ, Whitchurch CB, Amos LA, Löwe J. (2015). CetZ tubulin-like proteins control archaeal cell shape. Nature , 362–365. [DOI] [PMC free article] [PubMed] [Google Scholar]
- Engelhardt H. (2007). Are S-layers exoskeletons? The basic function of protein surface layers revisited. J Struct Biol , 115–124. [DOI] [PubMed] [Google Scholar]
- Ettema TJG, Lindås AC, Bernander R. (2011). An actin-based cytoskeleton in archaea. Mol Microbiol , 1052–1061. [DOI] [PubMed] [Google Scholar]
- Eun Y-J, Ho P-Y, Kim M, LaRussa S, Robert L, Renner LD, Schmid A, Garner E, Amir A. (2018). Archaeal cells share common size control with bacteria despite noisier growth and division. Nat Microbiol , 148–154. [DOI] [PubMed] [Google Scholar]
- Garner EC, Bernard R, Wang W, Zhuang X, Rudner DZ, Mitchison T. (2011). Coupled, circumferential motions of the cell wall synthesis machinery and MreB filaments in B. subtilis. Science , 222–225. [DOI] [PMC free article] [PubMed] [Google Scholar]
- Gerdes K, Howard M, Szardenings F. (2010). Pushing and pulling in prokaryotic DNA segregation. Cell , 927–942. [DOI] [PubMed] [Google Scholar]
- Goranov AI, Breier AM, Merrikh H, Grossman AD. (2009). Yaba of bacillus subtilis controls DnaA-mediated replication initiation but not the transcriptional response to replication stress. Mol Microbiol , 454–466. [DOI] [PMC free article] [PubMed] [Google Scholar]
- Grimm JB, Muthusamy AK, Liang Y, Brown TA, Lemon WC, Patel R, Lu R, Macklin JJ, Keller PJ, Ji N, Lavis LD. (2017). A general method to fine-tune fluorophores for live-cell and in vivo imaging. Nat Methods , 987–994. [DOI] [PMC free article] [PubMed] [Google Scholar]
- Gristwood T, Duggin IG, Wagner M, Albers SV, Bell SD. (2012). The sub-cellular localization of Sulfolobus DNA replication. Nucleic Acids Res , 5487–5496. [DOI] [PMC free article] [PubMed] [Google Scholar]
- Hawkins M, Malla S, Blythe MJ, Nieduszynski CA, Allers T. (2013). Accelerated growth in the absence of DNA replication origins. Nature , 544–547. [DOI] [PMC free article] [PubMed] [Google Scholar]
- Hildenbrand C, Stock T, Lange C, Rother M, Soppa J. (2011). Genome copy numbers and gene conversion in methanogenic archaea. J Bacteriol , 734–743. [DOI] [PMC free article] [PubMed] [Google Scholar]
- Hol FJH, Dekker C. (2014). Zooming in to see the bigger picture: microfluidic and nanofabrication tools to study bacteria. Science , 1251821. [DOI] [PubMed] [Google Scholar]
- Hug LA, Baker BJ, Anantharaman K, Brown CT, Probst AJ, Castelle CJ, Butterfield CJ, Hernsdorf AW, Amano Y, Ise K, et al. (2016). A new view of the tree of life. Nat Microbiol , 16048. [DOI] [PubMed] [Google Scholar]
- Hussain S, Wivagg CN, Szwedziak P, Wong F, Schaefer K, Izoré T, Renner LD, Holmes MJ, Sun Y, Bisson-Filho AW, et al. (2018). MreB filaments align along greatest principal membrane curvature to orient cell wall synthesis. Elife , e32471. [DOI] [PMC free article] [PubMed] [Google Scholar]
- Izoré T, Kureisaite-Ciziene D, McLaughlin SH, Löwe J. (2016). Crenactin forms actin-like double helical filaments regulated by arcadin-2. Elife , e21600. [DOI] [PMC free article] [PubMed] [Google Scholar]
- Jarrell KF, Ding Y, Meyer BH, Albers S-V, Kaminski L, Eichler J. (2014). N-linked glycosylation in archaea: a structural, functional, and genetic analysis. Microbiol Mol Biol Rev , 304–341. [DOI] [PMC free article] [PubMed] [Google Scholar]
- Kalliomaa-Sanford AK, Rodriguez-Castaneda FA, McLeod BN, Latorre-Rosello V, Smith JH, Reimann J, Albers SV, Barilla D. (2012). Chromosome segregation in Archaea mediated by a hybrid DNA partition machine. Proc Natl Acad Sci USA , 3754–3759. [DOI] [PMC free article] [PubMed] [Google Scholar]
- Kinosita Y, Uchida N, Nakane D, Nishizaka T. (2016). Direct observation of rotation and steps of the archaellum in the swimming halophilic archaeon Halobacterium salinarum. Nat Microbiol , 1–9. [DOI] [PubMed] [Google Scholar]
- Kirschner M, Mitchison T. (1986). Beyond self-assembly: from microtubules to morphogenesis. Cell , 329–342. [DOI] [PubMed] [Google Scholar]
- Kitamura E, Blow JJ, Tanaka TU. (2006). Live-cell imaging reveals replication of individual replicons in eukaryotic replication factories. Cell , 1297–1308. [DOI] [PMC free article] [PubMed] [Google Scholar]
- Kner P, Chhun BB, Griffis ER, Winoto L, Gustafsson MGL. (2009). Super-resolution video microscopy of live cells by structured illumination. Nat Methods , 339–342. [DOI] [PMC free article] [PubMed] [Google Scholar]
- Kuru E, Tekkam S, Hall E, Brun YV, Van Nieuwenhze MS. (2015). Synthesis of fluorescent D-amino acids and their use for probing peptidoglycan synthesis and bacterial growth in situ. Nat Protoc , 33–52. [DOI] [PMC free article] [PubMed] [Google Scholar]
- Kuzminov A. (2013). The chromosome cycle of prokaryotes. Mol Microbiol , 214–227. [DOI] [PMC free article] [PubMed] [Google Scholar]
- Lindås AC, Chruszcz M, Bernander R, Valegård K. (2014). Structure of crenactin, an archaeal actin homologue active at 90°C. Acta Crystallogr D Biol Crystallogr , 492–500. [DOI] [PubMed] [Google Scholar]
- Makarova KS, Koonin EV. (2010). Two new families of the FtsZ-tubulin protein superfamily implicated in membrane remodeling in diverse bacteria and archaea. Biol Direct , 1–9. [DOI] [PMC free article] [PubMed] [Google Scholar]
- Malandrin L, Huber H, Bernander R. (1999). Nucleoid structure and partition in Methanococcus jannaschii: an archaeon with multiple copies of the chromosome. Genetics , 1315–1323. [DOI] [PMC free article] [PubMed] [Google Scholar]
- Matsumiya S, Ishino Y, Morikawa K. (2001). Crystal structure of an archaeal DNA sliding clamp: proliferating cell nuclear antigen from Pyrococcus furiosus. Protein Sci , 17–23. [DOI] [PMC free article] [PubMed] [Google Scholar]
- May JW, Mitchison JM. (1986). Length growth in fission yeast cells measured by two novel techniques. Nature , 752–754. [Google Scholar]
- Moissl C, Rachel R, Briegel A, Engelhardt H, Huber R. (2005). The unique structure of archaeal “hami”, highly complex cell appendages with nano-grappling hooks. Mol Microbiol , 361–370. [DOI] [PubMed] [Google Scholar]
- Nakamura S, Aono R, Mizutani S, Takashina T, Grant WD, Horikoshi K. (1992). The cell-surface glycoprotein of haloarcula-japonica Tr-1. Biosci Biotechnol Biochem , 996–998. [DOI] [PubMed] [Google Scholar]
- Pande S, Shitut S, Freund L, Westermann M, Bertels F, Colesie C, Bischofs IB, Kost C. (2015). Metabolic cross-feeding via intercellular nanotubes among bacteria. Nat Commun , 6238. [DOI] [PubMed] [Google Scholar]
- Potvin-Trottier L, Luro S, Paulsson J. (2018). Microfluidics and single-cell microscopy to study stochastic processes in bacteria. Curr Opin Microbiol , 186–192. [DOI] [PMC free article] [PubMed] [Google Scholar]
- Qi X, Carberry D, Cai C, Hu S, Yuan Z, Uan Y, Dunlop H, Guo J. (2017). Optical sorting and cultivation of denitrifying anaerobic methane oxidation archaea. Biomed Opt , 177–183. [DOI] [PMC free article] [PubMed] [Google Scholar]
- Rieder CL, Alexander SP. (1990). Kinetochores are transported poleward along a single astral microtubule during chromosome attachment to the spindle in newt lung cells. J Cell Biol , 81–95. [DOI] [PMC free article] [PubMed] [Google Scholar]
- Rodrigues-Oliveira T, Belmok A, Vasconcellos D, Schuster B, Kyaw CM. (2017). Archaeal S-layers: overview and current state of the art. Front Microbiol , 1–17. [DOI] [PMC free article] [PubMed] [Google Scholar]
- Rodriguez EA, Campbell RE, Lin JY, Lin MZ, Miyawaki A, Palmer AE, Shu X, Zhang J, Tsien RY. (2017). The growing and glowing toolbox of fluorescent and photoactive proteins. Trends Biochem Sci , 111–129. [DOI] [PMC free article] [PubMed] [Google Scholar]
- Rosenshine I, Tchelet R, Mevarech M. (1989). The mechanism of DNA transfer in the mating system of an archaebacterium. Science , 1387–1389. [DOI] [PubMed] [Google Scholar]
- Spang A, Caceres EF, Ettema TJG. (2017). Genomic exploration of the diversity, ecology, and evolution of the archaeal domain of life. Science , eaaf3883. [DOI] [PubMed] [Google Scholar]
- Spang A, Saw JH, Jørgensen SL, Zaremba-Niedzwiedzka K, Martijn J, Lind AE, van Eijk R, Schleper C, Guy L, Ettema TJG. (2015). Complex archaea that bridge the gap between prokaryotes and eukaryotes. Nature , 173–179. [DOI] [PMC free article] [PubMed] [Google Scholar]
- Stoddard PR, Williams TA, Garner E, Baum B. (2017). Evolution of polymer formation within the actin superfamily. Mol Biol Cell , 2461–2469. [DOI] [PMC free article] [PubMed] [Google Scholar]
- Stracy M, Uphoff S, Garza De Leon F, Kapanidis AN. (2014). In vivo single-molecule imaging of bacterial DNA replication, transcription, and repair. FEBS Lett , 3585–3594. [DOI] [PubMed] [Google Scholar]
- van Teeffelen S, Wang S, Furchtgott L, Huang KC, Wingreen NS, Shaevitz JW, Gitai Z. (2011). The bacterial actin MreB rotates, and rotation depends on cell-wall assembly. Proc Natl Acad Sci USA , 15822–15827. [DOI] [PMC free article] [PubMed] [Google Scholar]
- van Wolferen M, Wagner A, van der Does C, Albers S-V. (2016). The archaeal Ced system imports DNA. Proc Natl Acad Sci , 2496–2501. [DOI] [PMC free article] [PubMed] [Google Scholar]
- Vaughan S, Wickstead B, Gull K, Addinall SG. (2004). Molecular evolution of FtsZ protein sequences encoded within the genomes of archaea, bacteria, and eukaryota. J Mol Evol , 19–39. [DOI] [PubMed] [Google Scholar]
- Viollier PH, Thanbichler M, McGrath PT, West L, Meewan M, McAdams HH, Shapiro L. (2004). From the cover: rapid and sequential movement of individual chromosomal loci to specific subcellular locations during bacterial DNA replication. Proc Natl Acad Sci USA , 9257–9262. [DOI] [PMC free article] [PubMed] [Google Scholar]
- Wang P, Robert L, Pelletier J, Dang WL, Taddei F, Wright A, Jun S. (2010). Robust growth of escherichia coli. Curr Biol , 1099–1103. [DOI] [PMC free article] [PubMed] [Google Scholar]
- Wang X, Montero Llopis P, Rudner DZ. (2013). Organization and segregation of bacterial chromosomes. Nat Rev Genet , 191–203. [DOI] [PMC free article] [PubMed] [Google Scholar]
- Wang Y, Penkul P, Milstein JN. (2016). Quantitative localization microscopy reveals a novel organization of a high-copy number plasmid. Biophys J , 467–479. [DOI] [PMC free article] [PubMed] [Google Scholar]
- Waterman-Storer CM, Desai A, Bulinski JC, Salmon ED. (1998). Fluorescent speckle microscopy, a method to visualize the dynamics of protein assemblies in living cells. Curr Biol , 1227–1230. [DOI] [PubMed] [Google Scholar]
- Wendland J, Walther A. (2005). Ashbya gossypii: a model for fungal developmental biology. Nat Rev Microbiol , 421–429. [DOI] [PubMed] [Google Scholar]
- Wirth R, Bellack A, Bertl M, Bilek Y, Heimerl T, Herzog B, Leisner M, Probst A, Rachel R, Sarbu C, et al. (2011). The mode of cell wall growth in selected archaea is similar to the general mode of cell wall growth in bacteria as revealed by fluorescent dye analysis. Appl Environ Microbiol , 1556–1562. [DOI] [PMC free article] [PubMed] [Google Scholar]
- Wu F, Dekker C. (2016). Nanofabricated structures and microfluidic devices for bacteria: from techniques to biology. Chem Soc Rev , 268–280. [DOI] [PubMed] [Google Scholar]
- Yang X, Lyu Z, Miguel A, McQuillen R, Huang KC, Xiao J. (2017). GTPase activity-coupled treadmilling of the bacterial tubulin FtsZ organizes septal cell wall synthesis. Science , 744–747. [DOI] [PMC free article] [PubMed] [Google Scholar]
- Yokoyama R, Hirakawa T, Hayashi S, Sakamoto T, Matsunaga S. (2016). Dynamics of plant DNA replication based on PCNA visualization. Sci Rep , 1–9. [DOI] [PMC free article] [PubMed] [Google Scholar]
- Yutin N, Koonin EV. (2012). Archaeal origin of tubulin. Biol Direct , 1–9. [DOI] [PMC free article] [PubMed] [Google Scholar]
- Zaremba-Niedzwiedzka K, Caceres EF, Saw JH, Bäckström D, Juzokaite L, Vancaester E, Seitz KW, Anantharaman K, Starnawski P, Kjeldsen KU, et al. (2017). Asgard archaea illuminate the origin of eukaryotic cellular complexity. Nature , 353–358. [DOI] [PubMed] [Google Scholar]
- Zerjatke T, Gak IA, Kirova D, Fuhrmann M, Daniel K, Gonciarz M, Müller D, Glauche I, Mansfeld J. (2017). Quantitative cell cycle analysis based on an endogenous all-in-one reporter for cell tracking and classification. Cell Rep , 1953–1966. [DOI] [PMC free article] [PubMed] [Google Scholar]
- Zerulla K, Chimileski S, Näther D, Gophna U, Papke RT, Soppa J. (2014). DNA as a phosphate storage polymer and the alternative advantages of polyploidy for growth or survival. PLoS One , e94819. [DOI] [PMC free article] [PubMed] [Google Scholar]
- Zillig W, Stetter KO, Schäfer W, Janekovic D, Wunderl S, Holz I, Palm P. (1981). Thermoproteales: A novel type of extremely thermoacidophilic anaerobic archaebacteria isolated from Icelandic solfataras. Zentralblatt Für Bakteriol. Mikrobiol Und Hyg I Abt Orig C Allg Angew Und Ökologische Mikrobiol , 205–227. [Google Scholar]