

Abstract
Objective
Currently, no valid measures inform treatment selection for depressed patients. Whether C-reactive protein (CRP) in particular and two other acute phase reactants (inflammatory markers) could differentiate between patients responding to either of two treatments with different mechanisms of action was assessed.
Method
Subjects included Combining Medications to Enhance Depression Outcomes (CO-MED) trial participants randomly assigned to either escitalopram plus placebo (SSRI monotherapy, n=51) or bupropion plus escitalopram combination (bupropion-SSRI combination, n=55) with baseline plasma samples. CRP, serum amyloid P component, and alpha-2-macroglobulin were measured using the Bioplex Pro™ human acute-phase 4-plex panel. We conducted mixed model analyses of depressive symptom (Quick Inventory of Depressive Symptomatology Self-Report) and side-effect burden (Frequency, Intensity, and Burden of Side-Effects Rating Scale) obtained weekly or every other week over the 12-week acute-phase of CO-MED trial to evaluate the relationship between these outcomes and baseline CRP and other acute-phase reactants.
Results
The treatment arms did not differ in depressive symptom or side effect outcomes. Most participants (69.8%, 74/106) had baseline CRP levels greater than 1 mg/L (indicative of systemic inflammatory activity). Higher baseline CRP levels were associated lower depression severity (correlation coefficient=−0.63) with bupropion-SSRI combination but not with SSRI monotherapy (correlation coefficient=0.40). The overall remission rate was 41.5%. The estimated remission rate with CRP threshold based assignment (SSRI monotherapy for <1 mg/L and Bupropion-SSRI for ≥1 mg/L) was 53.1%, with a number needed to treat of 8.6. Side effect burden was unrelated to any baseline inflammatory marker.
Conclusions
Baseline CRP levels relate differentially to antidepressant treatment outcomes in persons with major depressive disorder.
Keywords: Inflammation, Depression, Biomarker, Antidepressant Response, C-Reactive Protein
1.0 Introduction
The current trial-and-error approach of antidepressant medication selection, based on subjective factors such as cost or patients and/or provider preference often necessitates multiple attempts to attain adequate symptomatic control (Rush et al., 2006b). While the search of clinical markers has yet to produce clinically useful results (Arnow et al., 2015), inflammatory biomarkers present a promising avenue to inform antidepressant medication selection. Recently, Uher et al. found that depressed outpatients with levels of C-reactive protein (CRP) below 1 mg/L had greater reduction in depression severity with escitalopram, a selective serotonin reuptake inhibitor (SSRI) medication, whereas those with levels of at least 1 mg/L had better response to nortriptyline, a tricyclic antidepressant (TCA) medication (Uher et al., 2014).
CRP, a plasma protein, synthesized by the liver, is sensitive to inflammatory cytokines and increases markedly (up to 10,000-fold) in acute response to serious infection or tissue injury (hence the label acute-phase reactant) (Pepys and Hirschfield, 2003). The 1 mg/L CRP threshold is accepted as a marker of systemic inflammation that is associated with both vascular and non-vascular mortality (Kaptoge et al., 2010). CRP is a clinically pragmatic measure of inflammation as it is 1) readily available; 2) inexpensive; 3) relatively stable in stored biological specimens; 4) unaffected by time of day or meal intake, and 5) stable year-to-year in individual subjects absent acute factors (Brown et al., 2014; Danesh et al., 2004; Emberson et al., 2004; Pepys and Hirschfield, 2003; Ridker, 2003).
The potential role of systemic inflammation in antidepressant treatment response is suggested by the lower likelihood of response to commonly used antidepressant treatments (Strawbridge et al., 2015) such as psychotherapy (Harley et al., 2010) and SSRI medications (Eller et al., 2008; O’Brien et al., 2007; Yoshimura et al., 2009) in patients with elevated levels of inflammatory biomarkers. Additionally, serotonergic versus noradrenergic antidepressants have been postulated to differentially affect the balance of immune response mediated by type 1 (Th1) versus type 2 (Th2) T-helper cells. Serotonergic drugs promote immune response mediated by Th1 cells whereas noradrenergic antidepressant promote immune response mediated by Th2 cells (Martino et al., 2012). SSRI medications 1) suppress the expression of cluster of differentiation 4 (CD4) glycoprotein on macrophages (Greeson et al.); 2) decrease the production of interleukin (IL) 4, a key cytokine that promotes differentiation of naïve Th cells to Th2 cells (Kubera et al., 2000; Shenoy et al., 2013); 3) suppress the secretion of IL-6 which is produced by Th2 cells (Hannestad et al., 2011); and 4) increase the level of pro-inflammatory cytokines that promote Th1 cell-mediated immune response (IL-1 beta, interferon gamma [IFNγ], and tumor necrosis factor alpha [TNFα]) in the frontal cortex of rodents (Warner-Schmidt et al., 2011). Notably, Warner-Schmidt et al. found that co-administration of non-steroidal inflammatory drugs (NSAIDs) not only blocked the increase in levels of inflammatory cytokines with SSRIs but also antagonized their behavioral effects in animal models of forced swim and tail suspension tests. In the same study, NSAIDs did not inhibit the behavioral effects of bupropion (Warner-Schmidt et al., 2011). Additionally, predominantly noradrenergic antidepressant, such as nortriptyline, but not SSRIs, inhibit immune response mediated by Th1 cells (Sacerdote et al., 1994).
Inflammation is also associated with changes in brain dopamine metabolism (Felger, 2016); dopamine in turn affects immune system, especially immune response mediated by interleukin 17 producing Th cells (labelled Th17) that are distinct from Th1 and Th2 cells (Lieberknecht et al., 2016; Melnikov et al., 2016). Bupropion, a non-serotonergic antidepressant, inhibits dopamine reuptake, increases brain extracellular dopamine concentration (Ascher et al., 1995; Cremers et al., 2016), and has been shown to reduce inflammation mediated by both Th1 (by reducing IL-1 beta, IFNγ, and TNFα) and Th17 cells (Brustolim et al., 2006; Ebbinghaus et al., 2012; Warner-Schmidt et al., 2011). As some depressed patients have low-grade systemic inflammation as evidenced by elevated levels of pro-inflammatory cytokines (Dantzer et al., 2008; Haapakoski et al., 2015) such as IL-6 (Dowlati et al., 2010; Haapakoski et al., 2015) and acute-phase reactants, such as CRP (Wium-Andersen et al., 2013) and haptoglobin (Maes et al., 1994); those with elevated systemic markers of inflammation may respond better to non-serotonergic antidepressants such as bupropion as compared to SSRIs.
This secondary data analysis used the clinical trial and biological data from the CO-MED trial to further evaluate whether pre-treatment CRP level, at a predefined threshold of 1 mg/L, differentially predicts clinically meaningful treatment outcomes (depression severity and side-effects) to SSRI monotherapy versus bupropion-SSRI combination which has noradrenergic, dopaminergic, and serotonergic effects, analogous to nortriptyline used by Uher et al. (2014). We conducted other secondary analyses to determine whether acute-phase reactants-specifically serum amyloid P component, alpha-2-macroglobulin and haptoglobin might also predict differential treatment outcomes.
2.0 Methods
2.1 Study Overview and Participants
This report relies on data from the Combining Medications to Depression Outcomes trial CO-MED trial (Rush et al., 2011) which recruited 665 treatment-seeking depressed participants who were randomly assigned after stratification for site to three treatment arms: SSRI monotherapy, bupropion-SSRI combination, and venlafaxine-mirtazapine combination (Rush et al., 2011). The present analytic sample included a sub-set of participants with baseline plasma samples who were treated with SSRI monotherapy or bupropion-SSRI combination (n=106) in the acute-phase trial which included visits at baseline and weeks 1, 2, 4, 6, 8, 10, and 12. The collection of baseline plasma samples was done as part of a separate add-on biomarker study that required an additional consent from participants of CO-MED trial. Participation in this add-on study was optional, hence the number of samples (n=106) collected prior to treatment initiation was only a sub-set of the total number of CO-MED trial participants who received either SSRI monotherapy or bupropion-SSRI combination (n=445). Those participants who did not provide plasma (n=339) at baseline were younger (mean age=41.87 years vs. 46.65, p <0.001) and had lower use of statin medication (12.7% vs 21.7%, p=0.02) as compared to the analytic sample of this report. The two groups did not differ on any other baseline clinical and sociodemographic features as detailed in Supplementary Table 1.
The CO-MED trial used broad inclusion and exclusion criteria to recruit from both psychiatric and primary care clinics, which were chosen to ensure adequate minority representation to select a diverse participant group (Rush et al., 2011). The inclusion and exclusion criteria are fully listed at (https://clinicaltrials.gov/ct2/show/NCT00590863). Briefly, participants were treatment-seeking patients with nonpsychotic major depressive disorder, diagnosed by a clinical interview and the MINI International Neuropsychiatric Interview (MINI) (Sheehan et al., 1998). The current depressive episode had to be at least 2 months in duration and at least of moderate severity (17-item Hamilton Rating Scale at least 16) with either a chronic or recurrent course by DSM IV (Rush et al., 2011).
All study related procedures or assessments were completed only after obtaining written informed consent from participants. The CO-MED trial was reviewed and approved by the Institutional Review Boards at UT Southwestern Medical Center at Dallas, the University of Pittsburgh Data Coordinating Center, each participating regional center, and all relevant clinical sites. Additionally, the study was monitored by an independent data safety and monitoring board also monitored the study. Further details of CO-MED trial have been described by Rush et al. (Rush et al., 2011) (clinicaltrials.gov identifier NCT00590863).
2.2 Medications
Participants were treated with measurement based care (MBC) using two types of pills in single blind fashion, with dosage adjustments made at weeks 1, 2, 4, 6, and 8 based on symptom severity and side-effect, as detailed elsewhere (Rush et al., 2011). At the end of acute-phase, mean escitalopram dose was 17.6 mg/day and mean placebo dose was 1.4 pills/day in the SSRI monotherapy treatment arm, whereas mean bupropion SR dose was 324.0 mg/day and mean escitalopram dose was 14.0 mg /day in the bupropion-SSRI combination treatment arm (Rush et al., 2011).
2.3 Assessments
At baseline, participants provided clinical and sociodemographic information. These included age, gender, race, Hispanic ethnicity, onset of depression before age 18, presence of suicidal ideations at baseline, presence of rheumatoid arthritis as a comorbid medical condition, presence of anxious features (derived from HRSD17) (Rush et al., 2011), melancholic features (derived from IDS-C) (McGrath et al., 2008), or atypical features (derived from mood reactivity, leaden paralysis, weight gain or increase appetite, hypersomnia, and interpersonal sensitivity items of IDS-C) (Sung et al., 2013), and baseline depression severity.
At baseline and all treatment visits, participants completed the 16-item Quick Inventory of Depressive Symptomatology - Self-Report (QIDS-SR) scale which was the primary depression symptom severity outcome measure in the CO-MED trial. Each QIDS-SR item is scored from 0–3. Total score is calculated from nine domains that define a major depressive episode based on responses to each item. The score ranges from 0–27, with higher scores indicating greater depression severity (Rush et al., 2003). It correlates highly (0.86–0.93) with HRSD17 (Rush et al., 2006a). In previous reports, the reported Cronbach’s α of QIDS-SR has ranged from 0.86 to 0.87 (Rush et al., 2003).
At each visit after baseline, the Frequency, Intensity, and Burden of Side Effect Rating Scale (FIBSER) was also completed. This three item self-report measure assesses the frequency, intensity, and daily burden of side effects (range 0–6 on each item with higher numbers reflecting greater side effects severity). The Cronbach’s α ranges from 0.91–0.93 (Wisniewski et al., 2006). We used the sum of all three item ratings to measure of overall side effects (Schatzberg et al., 2015).
2.4 Measurement of inflammatory biomarkers
At baseline, peripheral venous samples were collected in EDTA tubes and shipped overnight to the Biologic Core of National Institute of Mental Health Repository and Genomics Resource (NIMH RGR) (RUCDR Infinite Biologics, Piscataway, NJ). Plasma was extracted on receipt and stored at −80°C. For this report, plasma samples were obtained from the NIMH RGR and transported on dry ice. The levels of inflammatory biomarkers were determined by the Microarray Core at UT Southwestern Medical Center in all samples at the same time blinded to treatment allocation and outcomes using the Bioplex Pro™ human acute-phase 4-plex panel (Bio-Rad Laboratories, Hercules, CA, USA) with Bio-plex® 200 instrument, which was equipped with Bio-Plex Manager software version 6.0 (Bio-Rad Laboratory, Hercules, CA, USA). This panel measures levels of CRP, alpha-2-macroglobulin, haptoglobin, and serum amyloid P component, which were interpreted only if intra- and inter-assays variations were less than 10% of the detection limits (or precision range) specified by the manufacturer. The biomarker levels in this 4-plex panel were expressed in ng/ml after a 10,000-fold dilution using the standards provided in the kit (Bio-Rad Laboratory, Hercules, CA, USA).
2.5 Statistical analyses
We used log transformation for those biomarkers that were not normally distributed (CRP and alpha-2-macroglobulin). In separate multivariate analyses for each biomarker (log of CRP, log of alpha-2-macroglobulin, and serum amyloid P component), we tested the association of baseline clinical and sociodemographic characteristics on pre-treatment levels of each biomarker. The baseline characteristics that were associated with biomarker levels at a permissive threshold of p <0.10 in these multivariate analyses were used in subsequent analyses to test the effect of baseline biomarkers on treatment outcomes. Using the methods outlined by Uher et al. (2014) for outcome analyses, we used separate repeated measures mixed model analyses (PROC MIXED as implemented in SAS) with total scores of QIDS-SR and FIBSER from all available visits, both at baseline as well as post-baseline, during the acute-phase of CO-MED trial as dependent variables and the following as independent variables: pre-treatment level of inflammatory biomarker, treatment arm, time, time-by-treatment-arm, treatment-arm-by-biomarker interaction, and the baseline characteristics that were associated with biomarker levels. By week 4, 13 out of 55 participants in bupropion-SSRI had dropped out whereas 10 out of 51 participants in SSRI monotherapy had dropped out.
Our primary analysis examined the treatment-arm-by-biomarker interaction, which if found significant, would indicate that the outcomes between SSRI monotherapy and bupropion-SSRI combination differed on the basis of baseline biomarker levels. To visualize the treatment-arm-by-biomarker interaction, we plotted the estimates of dependent variable (QIDS-SR and/or FIBSER) over the course of acute-phase of CO-MED trial for both treatment arms separately against the baseline plasma biomarker level. Additionally, in the mixed model analyses, we used the threshold of CRP less than 1 mg/L to compare outcomes between treatment arms as well as within treatment arms to test the notion reported by Uher et al. (2014). This allowed us to 1) test the superiority of SSRI monotherapy over bupropion-SSRI combination in participants with CRP level less than 1 mg/L, and 2) test different outcomes in each treatment arm based on whether participants had CRP level < 1mg/L or ≥ 1mg/L. As some somatic symptoms of depression can be associated with infection/illness, we conducted a sensitivity analysis by repeating the above-mentioned mixed model analysis while using modified total score of QIDS-SR, which excluded somatic items (appetite/weight, concentration, energy, and psychomotor agitation/retardation) and controlling for baseline characteristics that were associated with CRP level. The results were similar, and therefore we report on the full QIDS-SR for consistency with the outcome measurement in the CO-MED trial.
As secondary analysis, we also tested for treatment-arm-by-biomarker interaction with remission as the dependent variable in logistic regression analyses. Remission during acute-phase of CO-MED trial was attained if out of the last two consecutive QIDS-SR score at least one was less than 6 while the other was less than 8. To visualize this interaction, we plotted percentage of participants in remission based on CRP level < 1mg/L or ≥ 1mg/L in both treatment arms as well as in the full analytic sample of this report. Additionally, to demonstrate the advantage of using CRP level based treatment assignment, we estimated the number needed to treat to attain 1 additional remission as compared to the random treatment allocation that was used during CO-MED trial. We used the following formula to estimate the remission rate with a CRP threshold based treatment assignment: [(observed remission rate with SSRI monotherapy in participants with CRP <1 mg/L)*(proportion of participants with CRP <1 mg/L) + (observed remission rate with bupropion-SSRI combination in participants with CRP ≥1 mg/L)*(proportion of participants with CRP ≥1 mg/L)]. Number needed to treat was then calculated using following formula: 1/[(estimated remission rate with a CRP threshold based assignment)-(observed remission rate)].
We set the threshold of significance at p <0.05 and used SAS version 9.3 for all our analyses.
3.0 Results
Of the 665 participants in CO-MED trial, 106 participants who were treated with SSRI monotherapy or bupropion-SSRI combination provided plasma and constitute the analytic sample for this report. Table 1 presents the baseline mean concentrations of CRP, log of CRP, alpha-2-macroglobulin, log of alpha-2-macroglobulin, and serum amyloid P component along with select demographic variables; there was no significant difference between the two treatment arms in baseline clinical and biological markers. Of all baseline clinical and demographic variables tested, only higher BMI (t=4.96, p<0.0001), female gender (t=1.69, p=0.09) and absence of atypical symptoms (t=2.18, p=0.03) were associated with higher levels of log of CRP at baseline (See Table 2). In the SSRI monotherapy treatment arm, 37 out of 51 participants had CRP level ≥1 mg/L, whereas in the bupropion-SSRI combination treatment arm 37 out of 55 participants had CRP level ≥1 mg/L.
Table 1.
Sociodemographic and clinical characteristics of CO-MED trial participants who provided plasma at baseline
| Total | SSRI monotherapy |
Bupropion-SSRI combination |
|||||||
|---|---|---|---|---|---|---|---|---|---|
| Number | 106 | 51 | 55 | ||||||
| Categorical variable | N | % | N | % | N | % | Chi-square | p-value | |
| Sex | 0.07 (df=1) | 0.80 | |||||||
| Male | 32 | 30.2 | 16 | 31.4 | 16 | 29.1 | |||
| Female | 74 | 69.8 | 35 | 68.6 | 39 | 70.9 | |||
| Race | 3.64 (df=2) | 0.16 | |||||||
| White | 66 | 62.3 | 27 | 52.9 | 39 | 70.9 | |||
| Black | 30 | 28.3 | 18 | 35.3 | 12 | 21.8 | |||
| Other | 10 | 9.4 | 6 | 11.8 | 4 | 7.3 | |||
| Monthly income | 0.64 (df=2) | 0.73 | |||||||
| <$2000 | 55 | 59.1 | 26 | 56.5 | 29 | 61.6 | |||
| $2000 - $4000 | 21 | 22.6 | 12 | 26.1 | 9 | 19.2 | |||
| >$4000 | 17 | 18.3 | 8 | 17.4 | 9 | 19.2 | |||
| Education | 4.02 (df=2) | 0.13 | |||||||
| <12 years | 15 | 14.1 | 4 | 7.8 | 11 | 20 | |||
| 12 −15 years | 64 | 60.4 | 35 | 68.6 | 29 | 52.7 | |||
| >15 years | 27 | 25.5 | 12 | 23.5 | 15 | 27.3 | |||
| Hispanic | 15 | 14.2 | 8 | 15.7 | 7 | 12.7 | 0.19 (df=1) | 0.66 | |
| Anxious features | 76 | 71.7 | 33 | 64.7 | 43 | 78.2 | 2.37 (df=1) | 0.12 | |
| Atypical features | 22 | 20.8 | 10 | 19.6 | 12 | 21.8 | 0.08 (df=1) | 0.80 | |
| Melancholic Features | 31 | 29.3 | 14 | 27.5 | 17 | 30.9 | 0.15 (df=1) | 0.70 | |
| Suicidal ideation at baseline | 58 | 54.7 | 27 | 52.9 | 31 | 56.4 | 0.13 (df=1) | 0.72 | |
| Onset of depression before age 18 |
42 | 39.6 | 18 | 35.3 | 24 | 43.6 | 0.77 (df=1) | 0.38 | |
| Use of Statin | 23 | 21.7 | 13 | 25.5 | 10 | 18.2 | 0.83 (df=1) | 0.36 | |
| Use of NSAIDs | 36 | 36 | 19 | 40.4 | 17 | 32.1 | 0.75 (df=2) | 0.39 | |
| CRP greater than 1 mg/L | 74 | 69.8 | 37 | 72.6 | 37 | 67.3 | 0.35 (df=1) | 0.55 | |
| Continuous variables | Mean | SD | Mean | SD | Mean | SD | t-value | p-value | |
| Mean age in years | 46.64 | 11.89 | 47.04 | 11.80 | 46.27 | 12.06 | 0.33 (df=104) | 0.74 | |
| Mean QIDS-SR | 15.30 | 4.13 | 15.69 | 3.37 | 14.95 | 4.73 | 0.92 (df=104) | 0.36 | |
| Mean baseline CRP level mg/L | 5.10 | 8.52 | 5.83 | 10.86 | 4.43 | 5.55 | 0.84 (df=104) | 0.40 | |
| Mean baseline log of CRP level | 0.82 | 1.33 | 0.88 | 1.39 | 0.77 | 1.29 | 0.41 (df=104) | 0.69 | |
| Mean baseline alpha-2- macroglobulin level ng/ml# |
24.43 | 42.53 | 21.49 | 38.57 | 27.16 | 46.08 | 0.68 (df=104) | 0.50 | |
| Mean baseline log of alpha-2- macroglobulin level |
1.84 | 1.52 | 1.73 | 1.39 | 1.94 | 1.56 | 0.70 (df=104) | 0.48 | |
| Mean baseline serum amyloid P component level ng/ml# |
3.30 | 1.31 | 3.31 | 1.40 | 3.30 | 1.22 | 0.03 (df=104) | 0.97 | |
CO-MED is Combining Medications to Enhance Depression Outcomes, ESCIT is escitalopram, PBO is placebo, BUP is bupropion, SD is standard deviation, NSAID is non-steroidal anti-inflammatory drugs, df is degrees of freedom, and QIDS-SR is Quick Inventory of Depressive Symptomatology Self-Report. CRP is C-Reactive Protein.
Chi-square for categorical, F value for continuous data
concentration expressed in ng/ml after 10,000-fold dilution
Table 2.
Test of association of sociodemographic variables and illness characteristics with pre-treatment biomarker levels in CO-MED trial
| Log of C-Reactive Protein | Log of alpha-2- macroglobulin |
Serum amyloid P component |
|||||||
|---|---|---|---|---|---|---|---|---|---|
| F value | df | p Value | F value | df | p Value | F value | df | p Value | |
| Gender | 2.85 | 1, 82 | 0.09 | 1.56 | 1, 82 | 0.22 | 0.47 | 1, 82 | 0.50 |
| Race | 1.73 | 2, 82 | 0.18 | 1.33 | 2, 82 | 0.27 | 0.29 | 2, 82 | 0.75 |
| Hispanic ethnicity | 0.49 | 1, 82 | 0.49 | 0.38 | 1, 82 | 0.54 | 0.03 | 1, 82 | 0.85 |
| Age | 0.15 | 1, 82 | 0.70 | 0.07 | 1, 82 | 0.79 | 0.52 | 1, 82 | 0.47 |
| Rheumatoid arthritis at baseline |
1.08 | 1, 82 | 0.30 | 0.72 | 1, 82 | 0.40 | 3.51 | 1, 82 | 0.07 |
| Body mass index (BMI) | 24.59 | 1, 82 | <0.001 | 0.90 | 1, 82 | 0.35 | 1.85 | 1, 82 | 0.18 |
| Anxious features at baseline | 0.45 | 1, 82 | 0.51 | 0.57 | 1, 82 | 0.45 | 0.50 | 1, 82 | 0.48 |
| Atypical features at baseline | 4.75 | 1, 82 | 0.03 | 0.92 | 1, 82 | 0.34 | 0.00 | 1, 82 | 0.95 |
| Melancholic features at baseline |
0.15 | 1, 82 | 0.70 | 0.07 | 1, 82 | 0.79 | 0.11 | 1, 82 | 0.74 |
| Baseline depression severity | 0.13 | 1, 82 | 0.72 | 0.82 | 1, 82 | 0.37 | 0.04 | 1, 82 | 0.84 |
| Baseline suicidal ideation | 0.98 | 3, 82 | 0.41 | 2.30 | 3, 82 | 0.08 | 0.69 | 3, 82 | 0.56 |
| Treatment arm | 0.23 | 1, 82 | 0.63 | 0.81 | 1, 82 | 0.37 | 0.03 | 1, 82 | 0.87 |
| Use of NSAID | 0.59 | 1, 82 | 0.44 | 0.04 | 1, 82 | 0.85 | 0.73 | 1, 82 | 0.39 |
| Use of Statin | 0.10 | 1, 82 | 0.68 | 1.37 | 1, 82 | 0.25 | 1.05 | 1, 82 | 0.31 |
Separate generalized linear models with baseline levels of each biomarker (C-Reactive Protein, alpha-2-macroglobulin and serum amyloid P component) were used to test the association of listed baseline sociodemographic and illness characteristics. CO-MED is Combining Medications to Enhance Depression Outcomes, df is degrees of freedom, and NSAID is non-steroidal anti-inflammatory drugs.
Prediction of differential treatment outcomes between SSRI monotherapy versus bupropion-SSRI combination based on baseline CRP, serum amyloid P component or alpha-2-macroglobulin
We found a significant effect of treatment-arm-by-biomarker interaction for log of CRP, after controlling for presence of atypical depression, gender, and BMI, when assessing change in depression severity as measured by QIDS-SR (F=5.62, df= 1, 100, p=0.02), but not in side-effect severity as measured by FIBSER (F=0.22, df=1, 94, p=0.64). There was no treatment-arm-by-biomarker interaction for log of alpha-2-macroglobulin (QIDS-SR: F=0.11, df=1, 99, p=0.74; FIBSER: F=0.78, df=1, 94, p=0.92) or serum amyloid P component (QIDS-SR: F=1.48, df=1, 100, p=0.23; FIBSER: F=0.35, df=1, 94, p=0.55) (see Supplementary Table 2. We found that during the acute-phase, higher levels of baseline log of CRP were associated with smaller reductions in depression severity in SSRI monotherapy treatment arm as suggested by increase in QIDS-SR averaged over acute-phase with higher baseline CRP level (r=0.40) (Figure 1, Panel A).
Figure 1. Association of Baseline C-Reactive Protein and Changes in Depression Severity During Acute-Phase of CO-MED Trial.
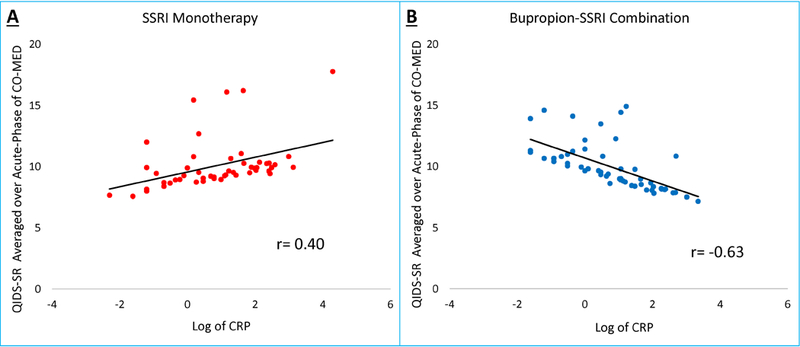
For individual participants in Combining Medications to Enhance Depression Outcomes (CO-MED) trial, depression severity averaged over all visits (baseline and weeks 1–12) of acute-phase was plotted against log of C-reactive protein (CRP) level at baseline.
However, higher baseline CRP levels were associated with lower QIDS-SR scores (r=−0.63) suggesting greater reductions in depression severity in bupropion-SSRI combination treatment arm in persons with higher CRP levels at baseline (Figure 1, Panel B).
Do depressed patients with low CRP (less than 1 mg/L) respond better to SSRI monotherapy than to bupropion-SSRI combination?
We also found that among depressed participants with CRP level less than 1 mg/L, SSRI monotherapy was associated with numerically greater reduction of depression severity that did not attain statistical significance as compared to those taking bupropion-SSRI combination (estimated difference in QIDS-SR=−2.6, standard error (SE)=1.34, t=−1.93, df=99, p=0.057), (see figure 2). For participants on SSRI monotherapy, those with CRP level less than 1 mg/L had significantly greater reduction in depression severity as compared to those with CRP levels greater than 1 mg/L (estimated difference in QIDS-SR = −2.48, SE=1.27, t=−1.98, df=99, p=0.05) over the course of this acute-phase trial. When comparing scores at each visit, both groups of participants (CRP (< or ≥ 1 mg/L) started at similar depression severity levels in the SSRI monotherapy treatment arm but those with CRP less than 1 mg/L, as compared to those with CRP ≥1 mg/L, had significantly lower depression severity by week 2 and continued to have lower depression severity at weeks 6, 8, and 10 but not at weeks 4 and 12, (see Figure 3 Panel A).
Figure 2. Differential changes in depression severity between SSRI monotherapy and bupropion-SSRI combination based on CRP level at baseline.
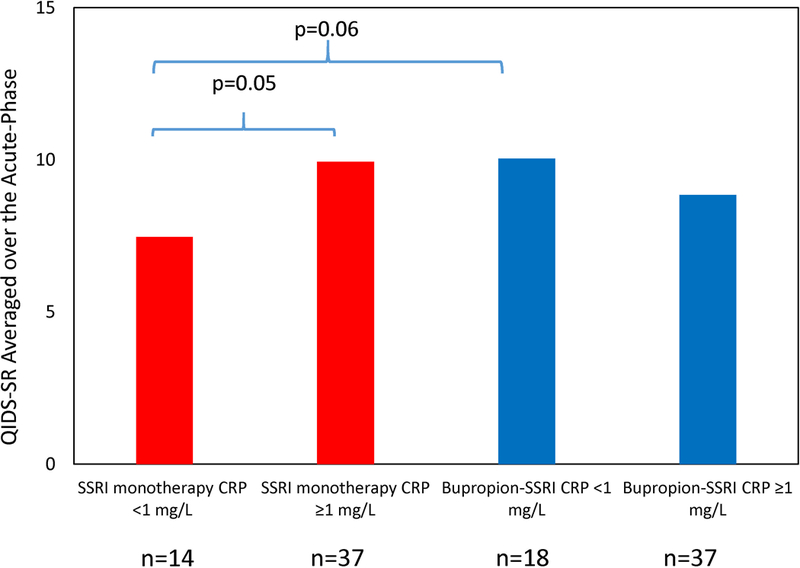
Participants in SSRI monotherapy (escitalopram plus placebo) and bupropion-SSRI combination treatment arms were divided in two groups based on a priori defined C-reactive protein (CRP) threshold (< and ≥ 1 mg/L), and average of depression severity over the course of acute-phase (baseline and weeks 1–12) of Combining Medications to Enhance Depression Outcomes (CO-MED) trial were calculated for these four groups.
Figure 3. Early reduction in depression severity with SSRI monotherapy in depressed patients with low (<1mg/L) CRP level at baseline.
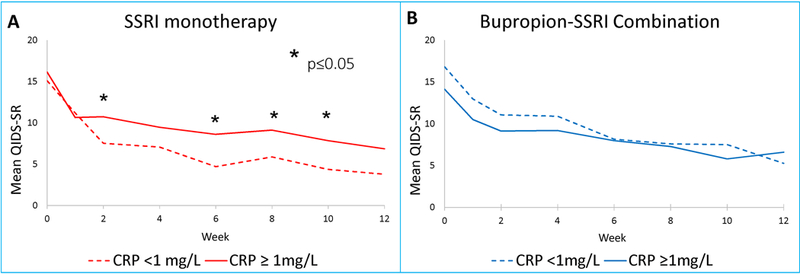
Mean depression severity at each visit of acute-phase of Combining Medications to Enhance Depression Outcomes (CO-MED) in SSRI monotherapy (Panel A) and bupropion-SSRI combination (Panel B). QIDS-SR is Quick Inventory of Depressive Symptomatology Self-Report (QIDS-SR) and CRP is C-reactive protein.
Similarly, we found a significant treatment-arm-by-biomarker interaction with remission as the dependent variable (chi-square=4.69, df=1, p=0.03) after controlling for gender, BMI and presence of atypical features. To illustrate this interaction, we plotted the remission rate for groups of participants with CRP levels < and ≥ 1 mg/L in each treatment arm, as shown in Figure 4. We found that in contrast to the bupropion-SSRI treatment arm, where ≥1 mg/L CRP level was associated with higher rates of remission (remission rate=51.35%) as compared to <1 mg/L CRP level (remission rate=33.33%), participants on SSRI monotherapy with CRP level <1 mg/L had higher rates of remission (remission rate=57.14%) as compared to those with ≥1 mg/L CRP level (remission rate=29.73%), also see Figure 4. The remission rate in full analytic sample (random treatment allocation) was 41.51%. The estimated remission rate with CRP threshold based treatment assignment, calculated using methodss described in statistical analysis section, was 53.10%. Hence, we estimated a number needed to treat (NNT)=8.6 for superiority of CRP threshold based treatment assignment versus random treatment allocation.
Figure 4. Remission rates during acute-phase of CO-MED trial based on C-reactive protein (CRP) level at baseline.
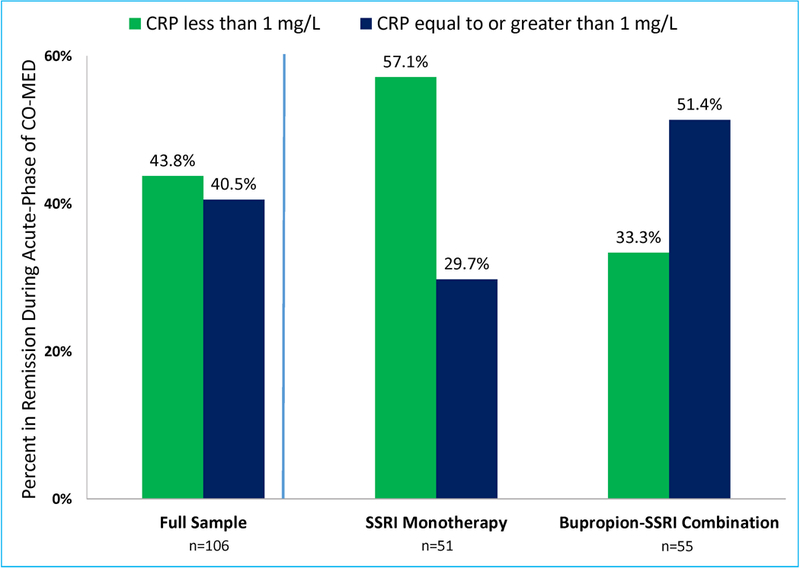
Remission rates in the full sample (n=106) as well as SSRI monotherapy and bupropion-SSRI treatment arms of Combining Medications to Enhance Depression Outcomes (CO-MED) were calculated after dividing participants in two groups based on a priori defined C-reactive protein (CRP) threshold < and ≥ 1 mg/L.
4.0 Discussion
At baseline, levels of CRP, but NOT alpha-2-macroglobulin or serum amyloid P component levels, were differentially associated with reduction in depression severity between SSRI monotherapy versus bupropion-SSRI combination. Lower levels of CRP were associated with greater depressive symptom reduction with SSRI monotherapy whereas higher baseline CRP levels were associated with better outcomes with bupropion-SSRI combination. We estimated that if CRP threshold based treatment assignment is implemented, 8.6 depressed patients will need to be treated for 1 additional remission, as compared to random treatment allocation. Side effect burden was unrelated to any baseline inflammatory marker. Participants with low CRP levels (<1 mg/L) performed markedly better with SSRI monotherapy than participants with higher CRP levels, and this effect was evident as early as the second week of treatment. Proportion of participants with CRP levels ≥1 mg/L (69.8%) and mean levels of CRP (5.1 mg/L) in this study were similar to those reported in the overall US population (Woloshin and Schwartz, 2005) and other studies of depressed patients (Shelton et al., 2015; Wium-Andersen et al., 2013), but higher than what was reported by Uher et al. where 45.6% participants had CRP ≥1 mg/L and the mean CRP level was 1.3–1.6 mg/L (Uher et al., 2014).
Our findings are consistent with previous reports of higher levels of pro-inflammatory cytokines at baseline being associated with worse outcomes with SSRI medications such as escitalopram (Eller et al., 2008; O’Brien et al., 2007). Consistent with previous reports, we also found significant association of CRP level and BMI (Rethorst et al., 2014) and gender (Khera et al., 2005). In contrast to previous reports which have found presence of atypical depression (Lamers et al., 2016) to be associated with higher CRP levels, we found the converse; CRP levels were lower in those with atypical features as compared to those without atypical features. Additionally, we found that there was no significant association between CRP levels and depression severity (Verduijn et al., 2015). The lack of moderator effect of serum amyloid P component and alpha-2-macroglobulin is novel and suggests specific role of systemic inflammation in predicting antidepressant treatment response.
By design, we set out to evaluate the superiority of SSRI monotherapy with low CRP level as initially reported by Uher et al. (Uher et al., 2014) in a separate sample of depressed patients. Hence, similarities between our findings and those of Uher et al. (Uher et al., 2014) with regard to the superiority of SSRI monotherapy in participants with low CRP levels is a major strength of our report. Clinically, these findings are that SSRI monotherapy is preferred for depressed patients with low (<1 mg/L) CRP level whereas combination with bupropion may be preferred in patients with higher levels. Given these results and those reported earlier with the threshold of 1mg/L (Uher et al., 2014), utilizing a cut-point for CRP level to guide treatment selection may improve outcomes in clinical care. In fact, the implementation of treatment selection based on CRP level can be facilitated in busy clinical practices with the availability of point-of-care (POC) testing of CRP.
While the conventional models have focused on serotonergic versus noradrenergic antidepressants as well as Th1 1 versus Th2 cells (Martino et al., 2012), the improvement with combination treatments containing bupropion in patients with higher level of CRP may be accounted for by the modulation of dopaminergic neurotransmission. As a subset of treatment resistant depressed patients have elevated systemic inflammation that respond to drugs specifically targeting inflammation (Raison et al., 2013), and with recent reports of dopamine agonist medication such as pramipexole being effective in treatment resistant depression (Fawcett et al., 2016), there is further opportunity to systematically use drugs that modulate dopaminergic neurotransmission as antidepressant medication in depressed patients with elevated pre-treatment levels of inflammatory biomarkers.
Our findings suggest that depressed patients with low inflammation (<1 mg/L) do markedly better on SSRIs. The reason for loss of additional benefit upon the addition of bupropion to SSRI is unclear. It may be attributed to the anti-inflammatory effects of bupropion. In previous reports using animal models, co-administration of NSAIDs resulted in antagonism of behavioral effects of SSRIs (Warner-Schmidt et al., 2011). We hope that this report will lead to future investigations that specifically evaluate the effect of SSRIs and/or bupropion in context of “high” and “low” inflammation.
Our study has several limitations. This is a secondary analysis on a sub-set of participants in the CO-MED trial. As identifying inflammatory biological markers as moderators of treatment outcome was not the primary outcome of the CO-MED trial, we did not a priori test the power to detect moderator effect of CRP. Additionally, the sample size and baseline clinical and sociodemographic variables in this secondary analysis limited our ability to account for potential confounding factors that are associated with CRP levels. Finally, the immune system is a complex interplay of multiple factors, and focusing on just acute-phase reactants such as CRP may have been inadequate. Hence, findings from this study should be considered preliminary and pilot in nature. As both treatment arms contained SSRI medications, future studies comparing SSRI monotherapy versus bupropion monotherapy will further clarify the differential effect pre-treatment CRP levels on treatment outcomes with serotonergic vs. non-serotonergic antidepressants.
5.0 Conclusion
Baseline CRP levels can predict differential treatment outcomes to SSRI monotherapy versus bupropion-SSRI combination. Low CRP levels are associated with greater reductions in depression severity with SSRI monotherapy, while with bupropion-SSRI combination, those with higher levels (≥1 mg/L) had a better response. Inflammatory markers such as CRP have a role in clinical practice.
Supplementary Material
Highlights.
Pre-treatment C-reactive protein (CRP) levels predict differential response to currently available antidepressant treatments.
Depressed patients with low CRP level (<1 mg/L) respond better to SSRI monotherapy whereas those with higher levels respond better to combination of bupropion and SSRI.
A CRP threshold (< or ≥ 1 mg/L) based treatment assignment, as compared to random treatment allocation, will require treatment of 8.6 depressed patients for 1 additional remission.
Acknowledgements:
CO-MED trial was funded by NIMH under contract N01 MH-90003 to the University of Texas Southwestern Medical Center at Dallas (Principal Investigators, M. H. Trivedi and A.J. Rush). This work was also supported in part through the Center for Depression Research and Clinical Care at UT Southwestern (Principal Investigator: Madhukar H. Trivedi, MD) and Hersh Foundation. The authors thank the clinical staff at each clinical site for their assistance with this project; all of the study participants; and Savitha Kalidas, Ph.D. for administrative support. Forest Pharmaceuticals, GlaxoSmithKline, Organon, and Wyeth Pharmaceuticals provided medications for CO-MED trial at no cost. The content of this publication does not necessarily reflect the views or policies of the U.S. Department of Health and Human Services, nor does mention of trade names, commercial products, or organizations imply endorsement by the U.S. government. NIMH had no role in the drafting or review of the manuscript or in the collection or analysis of the data.
Clinicaltrials.gov identifier: NCT00590863
Footnotes
Publisher's Disclaimer: This is a PDF file of an unedited manuscript that has been accepted for publication. As a service to our customers we are providing this early version of the manuscript. The manuscript will undergo copyediting, typesetting, and review of the resulting proof before it is published in its final citable form. Please note that during the production process errors may be discovered which could affect the content, and all legal disclaimers that apply to the journal pertain.
Previous presentation: The findings of this report were presented at the 2016 Annual Meeting of American College of Neuropsychopharmacology.
References
- Arnow BA, Blasey C, Williams LM, Palmer DM, Rekshan W, Schatzberg AF, Etkin A, Kulkarni J, Luther JF, Rush AJ, 2015. Depression Subtypes in Predicting Antidepressant Response: A Report From the iSPOT-D Trial. Am J Psychiatry 172, 743–750. [DOI] [PubMed] [Google Scholar]
- Ascher JA, Cole JO, Colin JN, Feighner JP, Ferris RM, Fibiger HC, Golden RN, Martin P, Potter WZ, Richelson E, et al. , 1995. Bupropion: a review of its mechanism of antidepressant activity. J Clin Psychiatry 56, 395–401. [PubMed] [Google Scholar]
- Brown AS, Sourander A, Hinkka-Yli-Salomaki S, McKeague IW, Sundvall J, Surcel HM, 2014. Elevated maternal C-reactive protein and autism in a national birth cohort. Mol Psychiatry 19, 259–264. [DOI] [PMC free article] [PubMed] [Google Scholar]
- Brustolim D, Ribeiro-dos-Santos R, Kast RE, Altschuler EL, Soares MB, 2006. A new chapter opens in anti-inflammatory treatments: the antidepressant bupropion lowers production of tumor necrosis factor-alpha and interferon-gamma in mice. Int Immunopharmacol 6, 903–907. [DOI] [PubMed] [Google Scholar]
- Cremers TI, Flik G, Folgering JH, Rollema H, Stratford RE Jr., 2016. Development of a Rat Plasma and Brain Extracellular Fluid Pharmacokinetic Model for Bupropion and Hydroxybupropion Based on Microdialysis Sampling, and Application to Predict Human Brain Concentrations. Drug Metab Dispos 44, 624–633. [DOI] [PubMed] [Google Scholar]
- Danesh J, Wheeler JG, Hirschfield GM, Eda S, Eiriksdottir G, Rumley A, Lowe GD, Pepys MB, Gudnason V, 2004. C-reactive protein and other circulating markers of inflammation in the prediction of coronary heart disease. N Engl J Med 350, 1387–1397. [DOI] [PubMed] [Google Scholar]
- Dantzer R, O’Connor JC, Freund GG, Johnson RW, Kelley KW, 2008. From inflammation to sickness and depression: when the immune system subjugates the brain. Nat Rev Neurosci 9, 46–56. [DOI] [PMC free article] [PubMed] [Google Scholar]
- Dowlati Y, Herrmann N, Swardfager W, Liu H, Sham L, Reim EK, Lanctot KL, 2010. A meta-analysis of cytokines in major depression. Biol Psychiatry 67, 446–457. [DOI] [PubMed] [Google Scholar]
- Ebbinghaus M, Gajda M, Boettger MK, Schaible H-G, Bräuer R, 2012. The anti-inflammatory effects of sympathectomy in murine antigen-induced arthritis are associated with a reduction of Th1 and Th17 responses. Ann Rheum Dis 71, 253–261. [DOI] [PubMed] [Google Scholar]
- Eller T, Vasar V, Shlik J, Maron E, 2008. Pro-inflammatory cytokines and treatment response to escitaloprsam in major depressive disorder. Prog Neuropsychopharmacol Biol Psychiatry 32, 445–450. [DOI] [PubMed] [Google Scholar]
- Emberson JR, Whincup PH, Morris RW, Walker M, Lowe GD, Rumley A, 2004. Extent of regression dilution for established and novel coronary risk factors: results from the British Regional Heart Study. Eur J Cardiovasc Prev Rehab 11(2), 125–134. [DOI] [PubMed] [Google Scholar]
- Fawcett J, Rush AJ, Vukelich J, Diaz SH, Dunklee L, Romo P, Yarns BC, Escalona R, 2016. Clinical Experience With High-Dosage Pramipexole in Patients With Treatment-Resistant Depressive Episodes in Unipolar and Bipolar Depression. Am J Psychiatry 173, 107–111. [DOI] [PubMed] [Google Scholar]
- Felger JC, 2016. The Role of Dopamine in Inflammation-Associated Depression: Mechanisms and Therapeutic Implications. Curr Top Behav Neurosci, 10.1007/7854_2016_13. [DOI] [PubMed]
- Greeson JM, Gettes DR, Spitsin S, Dubé B, Benton TD, Lynch KG, Douglas SD, Evans DL, The Selective Serotonin Reuptake Inhibitor Citalopram Decreases Human Immunodeficiency Virus Receptor and Coreceptor Expression in Immune Cells. Biol Psychiatry 80, 33–39. [DOI] [PMC free article] [PubMed] [Google Scholar]
- Haapakoski R, Mathieu J, Ebmeier KP, Alenius H, Kivimaki M, 2015. Cumulative meta-analysis of interleukins 6 and 1beta, tumour necrosis factor alpha and C-reactive protein in patients with major depressive disorder. Brain Behav Immun 49, 206–215. [DOI] [PMC free article] [PubMed] [Google Scholar]
- Hannestad J, DellaGioia N, Bloch M, 2011. The Effect of Antidepressant Medication Treatment on Serum Levels of Inflammatory Cytokines: A Meta-Analysis. Neuropsychopharmacology 36, 2452–2459. [DOI] [PMC free article] [PubMed] [Google Scholar]
- Harley J, Luty S, Carter J, Mulder R, Joyce P, 2010. Elevated C-reactive protein in depression: a predictor of good long-term outcome with antidepressants and poor outcome with psychotherapy. J Psychopharmacol 24, 625–626. [DOI] [PubMed] [Google Scholar]
- Kaptoge S, Di Angelantonio E, Lowe G, Pepys MB, Thompson SG, Collins R, Danesh J, 2010. C-reactive protein concentration and risk of coronary heart disease, stroke, and mortality: an individual participant meta-analysis. Lancet 375, 132–140. [DOI] [PMC free article] [PubMed] [Google Scholar]
- Khera A, McGuire DK, Murphy SA, Stanek HG, Das SR, Vongpatanasin W, Wians JFH, Grundy SM, de Lemos JA, 2005. Race and Gender Differences in C-Reactive Protein Levels. J Am Coll Cardiol 46, 464–469. [DOI] [PubMed] [Google Scholar]
- Kubera M, Simbirtsev A, Mathison R, Maes M, 2000. Effects of repeated fluoxetine and citalopram administration on cytokine release in C57BL/6 mice. Psychiatry Res 96, 255–266. [DOI] [PubMed] [Google Scholar]
- Lamers F, Bot M, Jansen R, Chan MK, Cooper JD, Bahn S, Penninx BWJH, 2016. Serum proteomic profiles of depressive subtypes. Transl Psychiatry 6, e851. [DOI] [PMC free article] [PubMed] [Google Scholar]
- Lieberknecht V, Junqueira SC, Cunha MP, Barbosa TA, de Souza LF, Coelho IS, Santos AR, Rodrigues AL, Dafre AL, Dutra RC, 2016. Pramipexole, a Dopamine D2/D3 Receptor-Preferring Agonist, Prevents Experimental Autoimmune Encephalomyelitis Development in Mice. Mol Neurobiol, 10.1007/s12035-016-9717-5. [DOI] [PubMed]
- Maes M, Delanghe J, Scharpe S, Meltzer HY, Cosyns P, Suy E, Bosmans E, 1994. Haptoglobin phenotypes and gene frequencies in unipolar major depression. Am J Psychiatry 151, 112–116. [DOI] [PubMed] [Google Scholar]
- Martino M, Rocchi G, Escelsior A, Fornaro M, 2012. Immunomodulation Mechanism of Antidepressants: Interactions between Serotonin/Norepinephrine Balance and Th1/Th2 Balance. Curr Neuropharmacol 10, 97–123. [DOI] [PMC free article] [PubMed] [Google Scholar]
- McGrath PJ, Khan AY, Trivedi MH, Stewart JW, Morris DW, Wisniewski SR, Miyahara S, Nierenberg AA, Fava M, Rush AJ, 2008. Response to a selective serotonin reuptake inhibitor (citalopram) in major depressive disorder with melancholic features: a STAR*D report. J Clin Psychiatry 69, 1847–1855. [DOI] [PubMed] [Google Scholar]
- Melnikov M, Belousova O, Murugin V, Pashenkov capital Em C, Boysmall ka C. o.C.A., 2016. The role of dopamine in modulation of Th-17 immune response in multiple sclerosis. J Neuroimmunol 292, 97–101. [DOI] [PubMed] [Google Scholar]
- O’Brien SM, Scully P, Fitzgerald P, Scott LV, Dinan TG, 2007. Plasma cytokine profiles in depressed patients who fail to respond to selective serotonin reuptake inhibitor therapy. J Psychiatr Res 41, 326–331. [DOI] [PubMed] [Google Scholar]
- Pepys MB, Hirschfield GM, 2003. C-reactive protein: a critical update. J Clin Invest 111, 1805–1812. [DOI] [PMC free article] [PubMed] [Google Scholar]
- Raison CL, Rutherford RE, Woolwine BJ, Shuo C, Schettler P, Drake DF, Haroon E, Miller AH, 2013. A randomized controlled trial of the tumor necrosis factor antagonist infliximab for treatment-resistant depression: the role of baseline inflammatory biomarkers. JAMA Psychiatry 70, 31–41. [DOI] [PMC free article] [PubMed] [Google Scholar]
- Rethorst CD, Bernstein I, Trivedi MH, 2014. Inflammation, obesity, and metabolic syndrome in depression: analysis of the 2009–2010 National Health and Nutrition Examination Survey (NHANES). J Clin Psychiatry 75, e1428–1432. [DOI] [PMC free article] [PubMed] [Google Scholar]
- Ridker PM, 2003. Cardiology Patient Page. C-reactive protein: a simple test to help predict risk of heart attack and stroke. Circulation 108, e81–85. [DOI] [PubMed] [Google Scholar]
- Rush AJ, Bernstein IH, Trivedi MH, Carmody TJ, Wisniewski S, Mundt JC, Shores-Wilson K, Biggs MM, Woo A, Nierenberg AA, Fava M, 2006a. An Evaluation of the Quick Inventory of Depressive Symptomatology and the Hamilton Rating Scale for Depression: A Sequenced Treatment Alternatives to Relieve Depression Trial Report. Biol Psychiatry 59, 493–501. [DOI] [PMC free article] [PubMed] [Google Scholar]
- Rush AJ, Trivedi MH, Ibrahim HM, Carmody TJ, Arnow B, Klein DN, Markowitz JC, Ninan PT, Kornstein S, Manber R, Thase ME, Kocsis JH, Keller MB, 2003. The 16-Item Quick Inventory of Depressive Symptomatology (QIDS), clinician rating (QIDS-C), and self-report (QIDS-SR): a psychometric evaluation in patients with chronic major depression. Biol Psychiatry 54, 573–583. [DOI] [PubMed] [Google Scholar]
- Rush AJ, Trivedi MH, Stewart JW, Nierenberg AA, Fava M, Kurian BT, Warden D, Morris DW, Luther JF, Husain MM, Cook IA, Shelton RC, Lesser IM, Kornstein SG, Wisniewski SR, 2011. Combining medications to enhance depression outcomes (CO-MED): acute and long-term outcomes of a single-blind randomized study. Am J Psychiatry 168, 689–701. [DOI] [PubMed] [Google Scholar]
- Rush AJ, Trivedi MH, Wisniewski SR, Nierenberg AA, Stewart JW, Warden D, Niederehe G, Thase ME, Lavori PW, Lebowitz BD, McGrath PJ, Rosenbaum JF, Sackeim HA, Kupfer DJ, Luther J, Fava M, 2006b. Acute and longer-term outcomes in depressed outpatients requiring one or several treatment steps: a STAR*D report. Am J Psychiatry 163, 1905–1917. [DOI] [PubMed] [Google Scholar]
- Sacerdote P, Bianchi M, Panerai AE, 1994. Chlorimipramine and nortriptyline but not fluoxetine and fluvoxamine inhibit human polymorphonuclear cell chemotaxis In vitro. Gen Pharmacol 25, 409–412. [DOI] [PubMed] [Google Scholar]
- Schatzberg AF, DeBattista C, Lazzeroni LC, Etkin A, Greer M Murphy J, Williams LM, 2015. ABCB1 Genetic Effects on Antidepressant Outcomes: A Report From the iSPOT-D Trial. Am J Psychiatry 172, 751–759. [DOI] [PubMed] [Google Scholar]
- Sheehan DV, Lecrubier Y, Sheehan KH, Amorim P, Janavs J, Weiller E, Hergueta T, Baker R, Dunbar GC, 1998. The Mini-International Neuropsychiatric Interview (MINI): the development and validation of a structured diagnostic psychiatric interview for DSM-IV and ICD-10. J Clin Psychiatry [PubMed]
- Shelton RC, Falola M, Li L, Zajecka J, Fava M, Papakostas GI, 2015. The pro-inflammatory profile of depressed patients is (partly) related to obesity. J Psychiatr Res 70, 91–97. [DOI] [PMC free article] [PubMed] [Google Scholar]
- Shenoy AR, Dehmel T, Stettner M, Kremer D, Kieseier BC, Hartung HP, Hofstetter HH, 2013. Citalopram suppresses thymocyte cytokine production. J Neuroimmunol 262, 46–52. [DOI] [PubMed] [Google Scholar]
- Strawbridge R, Arnone D, Danese A, Papadopoulos A, Herane Vives A, Cleare AJ, 2015. Inflammation and clinical response to treatment in depression: A meta-analysis. Eur Neuropsychopharmacol 25, 1532–1543. [DOI] [PubMed] [Google Scholar]
- Sung SC, Wisniewski SR, Balasubramani GK, Zisook S, Kurian B, Warden D, Trivedi MH, Rush AJ, 2013. Does early-onset chronic or recurrent major depression impact outcomes with antidepressant medications? A CO-MED trial report. Psychol Med 43, 945–960. [DOI] [PubMed] [Google Scholar]
- Uher R, Tansey KE, Dew T, Maier W, Mors O, Hauser J, Dernovsek MZ, Henigsberg N, Souery D, Farmer A, McGuffin P, 2014. An inflammatory biomarker as a differential predictor of outcome of depression treatment with escitalopram and nortriptyline. AM J Psychiatry 171, 1278–1286. [DOI] [PubMed] [Google Scholar]
- Verduijn J, Milaneschi Y, Schoevers RA, van Hemert AM, Beekman AT, Penninx BW, 2015. Pathophysiology of major depressive disorder: mechanisms involved in etiology are not associated with clinical progression. Transl Psychiatry 5, e649. [DOI] [PMC free article] [PubMed] [Google Scholar]
- Warner-Schmidt JL, Vanover KE, Chen EY, Marshall JJ, Greengard P, 2011. Antidepressant effects of selective serotonin reuptake inhibitors (SSRIs) are attenuated by antiinflammatory drugs in mice and humans. Proc Natl Acad Sci U S A 108, 9262–9267. [DOI] [PMC free article] [PubMed] [Google Scholar]
- Wisniewski SR, Rush AJ, Balasubramani GK, Trivedi MH, Nierenberg AA, 2006. Self-rated global measure of the frequency, intensity, and burden of side effects. Journal of psychiatric practice 12, 71–79. [DOI] [PubMed] [Google Scholar]
- Wium-Andersen M, Ørsted D, Nielsen S, Nordestgaard B, 2013. ELevated c-reactive protein levels, psychological distress, and depression in 73 131 individuals. JAMA Psychiatry 70, 176–184. [DOI] [PubMed] [Google Scholar]
- Woloshin S, Schwartz LM, 2005. Distribution of C-reactive protein values in the United States. N Engl J Med 352, 1611–1613. [DOI] [PubMed] [Google Scholar]
- Yoshimura R, Hori H, Ikenouchi-Sugita A, Umene-Nakano W, Ueda N, Nakamura J, 2009. Higher plasma interleukin-6 (IL-6) level is associated with SSRI- or SNRI-refractory depression. Prog Neuropsychopharmacol Biol Psychiatry 33, 722–726. [DOI] [PubMed] [Google Scholar]
Associated Data
This section collects any data citations, data availability statements, or supplementary materials included in this article.