Abstract
Background:
Binocular summation (BiS), or improvement in binocular vision exceeding the better eye alone, is affected by strabismus. Being easily measured, BiS may be a useful indicator for subjective outcomes like stereopsis in strabismus. This study aims to investigate the relationship between BiS and measures of control of intermittent exotropia (IXT).
Methods:
Patients with IXT were recruited before undergoing strabismus surgery and underwent tests of binocular and monocular high and low contrast visual acuity, stereopsis at distance and near, and Newcastle Score (NCS), a score developed by incorporating home control and clinic control criteria into a control rating scale. BiS was calculated using high-contrast Early Treatment of Diabetic Retinopathy Study (ETDRS) and Sloan low-contrast acuity charts (LCA) at 2.5% and 1.25% contrast as the difference between the binocular score and that of the better eye. The relationship between BiS and measures of IXT control (NCS and distance near stereoacuity disparity) was evaluated using a correlation analysis by Spearman correlation coefficients and the Kruskal-Wallis test.
Results:
Thirty-four patients were included (mean [± standard deviation (SD)] age 19±16years) having a mean (± SD) of 26±16Δ IXT at distance and 20±16Δ at near. Mean (± SD) BiS for ETDRS and Sloan LCA at 2.5% and 1.25% was 0.8±3.6, 1.9±6.0 and −2.3±7.2, respectively. The Spearman correlation coefficient of BiS and NCS was −0.53 (95% CI −0.85 to −0.25) for 2.5% LCA and −0.43 (95% CI −0.77 to −0.13) for 1.25% LCA. BiS at 2.5% LCA (p=0.006) and at 1.25% LCA (p=0.029) significantly differed between the groups based on NCS score groupings (1–3, 4–6, and 7–9), with patients who had better control scores having higher levels of BiS. BiS did not differ significantly between patients grouped according to the difference between stereoacuity measured at near versus distance.
Conclusion:
Significantly lower low contrast BiS in patients with higher NCS may suggest that decreased BiS is associated with less control in IXT. This finding suggests that BiS may reflect control in IXT across a population of patients with IXT.
Keywords: Binocular summation, control, intermittent exotropia
INTRODUCTION
Intermittent exotropia (IXT) is a form of early onset childhood strabismus having 2% prevalence in children under age 11 years,1 and may become progressively more frequent over time.1,2 There are several controversies in management of IXT. For example, there is no consensus regarding how and when to treat it, or what constitutes a good outcome. A range of criteria has been used for follow-up and to determine surgical indications, as well as to evaluate surgical outcome. Criteria have included magnitude and type of postoperative deviation, and sensory criteria. There is increasing recognition of the importance of strabismic control in outcomes.3
Binocular summation (BiS), defined as the superiority of binocular over monocular performance on visual threshold tasks,4 is a measure of binocular function that may represent a novel way to evaluate and monitor strabismus. Strabismic patients demonstrate subnormal BiS and even binocular inhibition for low contrast visual acuity (VA).5 We hypothesize that BiS may have a relationship with a patient’s control of IXT. The purpose of this study was to evaluate the relationship of BiS scores with other current markers used for evaluating control in preoperative IXT patients.
MATERIALS AND METHODS
This study was approved by the local Institutional Review Board and conformed to the requirements of the Declaration of Helsinki and the US Health Insurance Portability and Accountability Act. Written informed consent was obtained in advance from participants. Patients with IXT were recruited during 2010 to 2014 from the preoperative clinics of four of the authors. IXT was defined as a divergent deviation intermittently controlled by fusional mechanisms. Patients were excluded if they had amblyopia, constant exotropia, prior ocular surgery, any cranial nerve palsy, anomalous retinal correspondence, central nervous system defects, obvious nystagmus, younger than 3 years of age or older than 80 years of age, or any structural lesion causing an interocular difference in best corrected logMAR of or exceeding 0.3 unit. Participants underwent a screening examination in which VA was tested using the Early Treatment Diabetic Retinopathy Study (ETDRS) protocol with their habitual refractive correction.6 If logMAR was worse than 0.2 unit in either eye, a non-cycloplegic manifest refraction (refractometry) was performed and study tests were performed with this correction. All subjects had also undergone cycloplegic refraction within the previous six months as part of pre-operative planning, and so this refraction was also utilized in cases where a manifest refraction could not be performed. Next, binocular alignment was measured at distance (6 m) and near (30 cm) using cover/uncover and alternate prism cover testing. Right eye, left eye, and binocular testing were performed in an order randomly assigned prior to testing that was consistently maintained for each subject for the various psychophysical tests. All testing was performed by trained technicians experienced in the examination of patients for research studies, with adherence to detailed standard protocols, including written scripts and instructions for testing. The tests were performed in the following order.
Stereoacuity.
The near Randot stereo test (Stereo Optical Co., Inc., Chicago, IL, U.S.A), in which the patient matches the pictures with a disparity range from 800 to 40 seconds of arc. The test was administered by holding the test booklet upright before the subject 40 cm away with the use of polarizing glasses to be worn over prescription glasses, if using any. The near Randot score was noted as the lowest disparity at which the subject could identify at least two of the three presented shapes (with disparities tested in the following order: 800, 400, 200, 100, 60, 40 arcsec). The Distance Randot stereo test (Stereo Optical Co., Inc., Chicago, IL, U.S.A) was also used at 3 meters in a normally illuminated room while wearing polarizing glasses (Stereo Optical Polarized Viewer). If the subject wore corrective spectacles, polarizing glasses were worn over the corrective lenses. Scoring was noted to be the lowest level of disparity at which a subject could identify both of the geometric shapes correctly (with disparities tested in the following order: 400, 200, 100 and 60 arcsec). Patients who could not identify shapes even at the largest disparity (800 arcsec at near and 400 arcsec at distance) were assigned a score of 10,000 arcsec for their stereoacuity.
Distance-near stereo acuity disparity as a measure of IXT control.
Less than two levels of discrepancy between distance stereopsis and near stereoacuity was defined as excellent distance near stereoacuity disparity, while 2–4 levels of discrepancy as fair and more than 4 lines of discrepancy of distance stereopsis from near stereoacuity as poor distance near stereoacuity disparity as previously defined.7
Newcastle Score.
This score was developed by incorporating subjective (home control) and objective (clinic control) criteria into a control rating scale. The Newcastle score algorithm has been previously published.3,8 It is produced by calculating and then adding scores for the observed frequency with which the IXT is manifest at home as observed by the parents and the scores for control of deviation at near and distance after cover testing in the office. The minimum score is 0 and maximum is 9 (manifest more than 50% of the time and present spontaneously both at distance and near).
High-Contrast Visual Acuity.
The ETDRS protocol6 at 3 m was used for testing VA scored as the total number of letters identified correctly with a maximum score of 70 (Snellen equivalent 20/12.5). The ETDRS chart (Precision Vision, La Salle, Illinois) was mounted on a retroilluminator producing chart luminance, measured by a digital meter, of 168 cd/m2. The chart had 5 letters per line arranged in 0.1 logMAR unit steps as specified in the ETDRS protocol.
Low-Contrast Visual Acuity.
Sloan acuity was tested (Precision Vision, La Salle, Illinois) at low-contrast levels of 2.5% followed by 1.25%, using the ETDRS protocol at 3 m in a dimly lit room. Sloan charts have a similar format to the ETDRS charts (5 letters per line) with each Sloan chart corresponding to a different contrast level. The low-contrast acuity (LCA) score is the number of letters identified correctly with a maximum score of 70 (14 lines).
Statistical Analysis.
Binocular summation was calculated by subtracting the better eye score from the binocular score (binocular score minus better eye score). The relationship between BiS scores and existing measures of IXT control (NCS and distance near stereoacuity disparity) was using scatter plots to show the relationship between each continuous BiS score and continuous NCS or logarithm of distance and near stereopsis. Spearman coefficients were calculated to estimate the degree of correlations. However, since the correlation coefficients rely on the assumption of dose-response relationship, the relationship was also examined by dividing patients into subgroups using box plots and Kruskall-Wallis tests. In such analysis, the patients were divided into 3 subgroups according to NCS: 1–3, 4–6 and 7–9, while distance near stereo disparity was defined as poor, fair or excellent as described above. If there was a statistically significant difference in a Kruskal-Wallis test, pairwise subgroup analysis was done by Mann Whitney U test to find the differences between two subgroups.
All statistical analysis was performed using Stata (StataCorp, College Station TX), and a p-value of less than 0.05 was considered to be statistically significant.
RESULTS
Thirty-four patients (18 female) with a mean (± standard deviation [SD]) age of 19±16 (median: 11.5 years, range: 3.5–68) years were enrolled. The mean (± SD) age of onset of exodeviation was 6.9±7.2 (median: 5: range: 0.5–38) years. The mean (± SD) distance alignment was 26±16 prism diopters (median: 25 diopters, range: 10–65) while the mean (± SD) near alignment was 20±16 diopters (median: 20 diopters, range: 4–65). The mean (± SD) binocular visual acuity on EDTRS (high contrast), 2.5 % LCA and 1.25% LCA charts was 58±20 letters (median: 58, range: 2–97), 32±12 letters (median: 35, range:2–45) and 21±12 letters (median: 24, range:2–38), respectively. The median for logarithms of near and distance stereopsis and NCS were 2 (100 arcsec) (range= 1.60– 4/nil), 3.72 (5200 arcsec) (range=1.78–4/nil) and 4 (10,000 arcsec) (range=2–9), respectively. There were 9 (26%) patients in the 1–3 NCS group, 20 (59%) patients in the 4–6 NCS group and 5 (15%) patients in the 7–9 NCS group. The mean (± SD) BiS for ETDRS (high contrast), 2.5 % LCA and 1.25% LCA charts were 0.8±3.6 (median: 1, range: −8 – 9), 1.9±6.0 (median: −2, range: −20 – 17), −2.3±7.2 (median:2.5, range: −9–14), respectively.
Low correlation was found between high-contrast ETDRS BiS and the logarithm of near (r=−0.17, 95% CI: −0.43 – 0.30) and distance (r=0.03, 95% CI −0.28 – 0.45) stereopsis, as well as for BiS measured at 2.5% LCA and log near (r=−0.37, 95% CI −0.68 – 0.10) and log distance (r=−0.28, 95% CI −0.69 – 0.10) stereopsis, and 1.25% LCA and log near (r=−0.13, 95% CI −0.36 – 0.49) and log distance (r=−0.16, 95% CI −0.45 – 0.40) stereopsis. The Spearman correlation coefficient of BiS at 2.5 % and NCS was −0.53 (95% CI −0.85 - −0.25). Similarly, moderate correlation was found between BiS at 1.25 % LCA and NCS (r= −0.43, 95% CI −0.77 - −0.13). On the other hand, the BiS on the high contrast ETDRS chart had low correlation with NCS (r=0.09, 95% CI −0.40 – 0.32). The scatter plots of NCS with each BiS in ETDRS, 2.5% LCA and 1.25 % LCA charts are depicted in Figures 1, 2 and 3 respectively.
Figure 1:
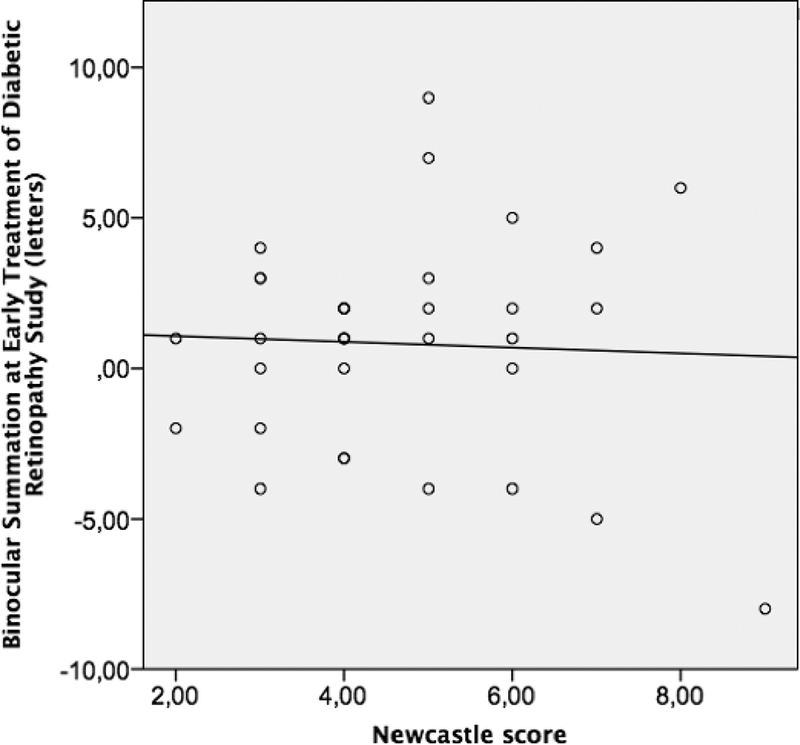
The scatter plot for binocular summation at Early Treatment at Diabetic Retinopathy Study charts and Newcastle Score
Figure 2.
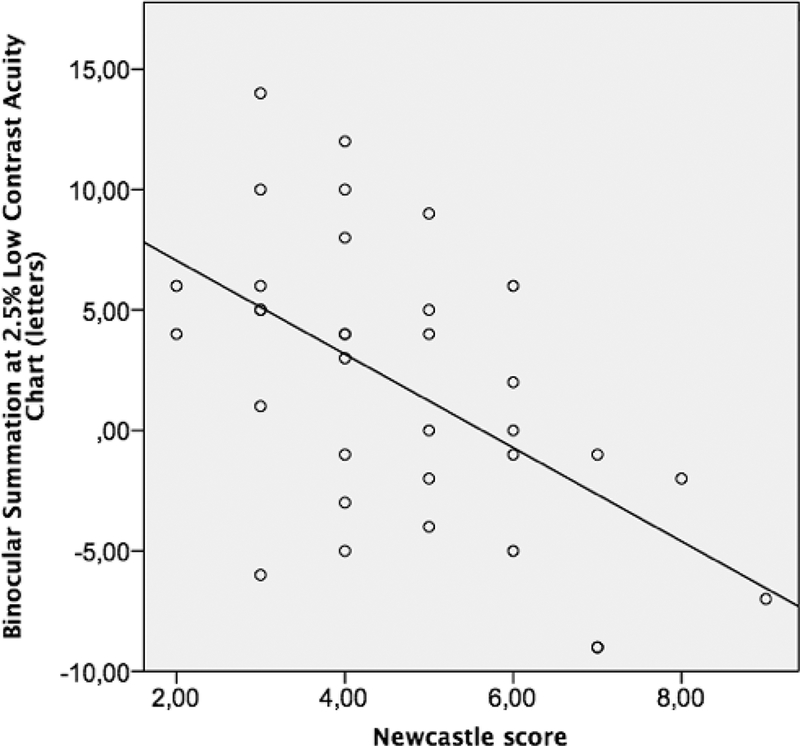
The scatter plot for binocular summation at 2.5 % Low Contrast Acuity charts for Newcastle Score
Figure 3:
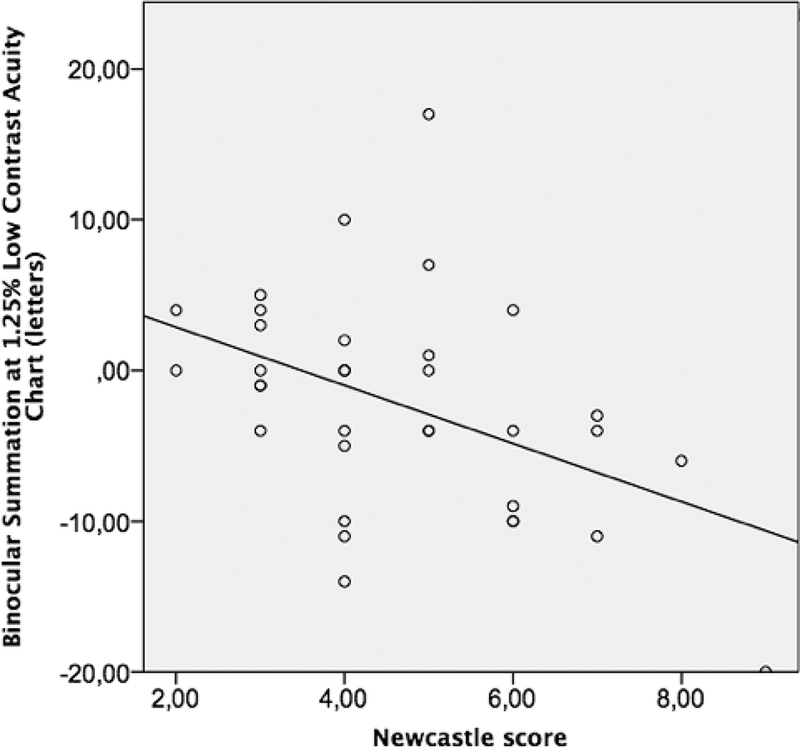
The scatter plot for binocular summation at 1.25 % Low Contrast Acuity charts for Newcastle Score
The BiS at 2.5% LCA and at 1.25% LCA significantly differed between NCS groups (Table 1, p=0.006 for 2.5% and p=0.029 for 1.25% LCA). The box plot graphics for BiS at 2.5% and 1.25 % LCA charts are depicted in Figures 4 and 5. Mann Whitney analysis yielded significant differences in BiS in especially low score (1–3) and high score (7–9) groups (p=0.006 for BiS at 2.5% LCA and p=0.005 for BiS at 1.25% LCA). The difference between BiS for 2.5% contrast for those with moderate NCS (4–6) and high NCS (7–9) was also significant (p=0.007) after post hoc analysis. The mean BiS score for high-contrast ETDRS, 2.5% LCA and 1.25 % LCA charts in each poor, fair and excellent control groups according to distance near stereo acuity disparity were not significantly different (Table 2).
Table 1:
Binocular Summation (letters, median, range) in groups based on control as assessed by Newcastle Score.
| Binocular Summation (Letters): Median (range) |
||||
|---|---|---|---|---|
| Early Treatment of Diabetic Retinopathy Study |
2.5% Low- contrasa tcuity |
1.25% Low- contrast acuity |
||
| Newcastle Score Groups | 1–3 | 1 (−4 – 4) | 5 (−6 – 14) | 0 (−4 – 5) |
| 4–6 | 1 (−4 – 9) | 2.5(−5 – 12) | −4 (−14 – 17) | |
| 7-9 | 2 (−8 – 6) | −7 (−9 – −1) | −6 (−20 – −3) | |
| p value (Kruskal Wallis) | 0.92 | 0.006 | 0.029 | |
Figure 4:
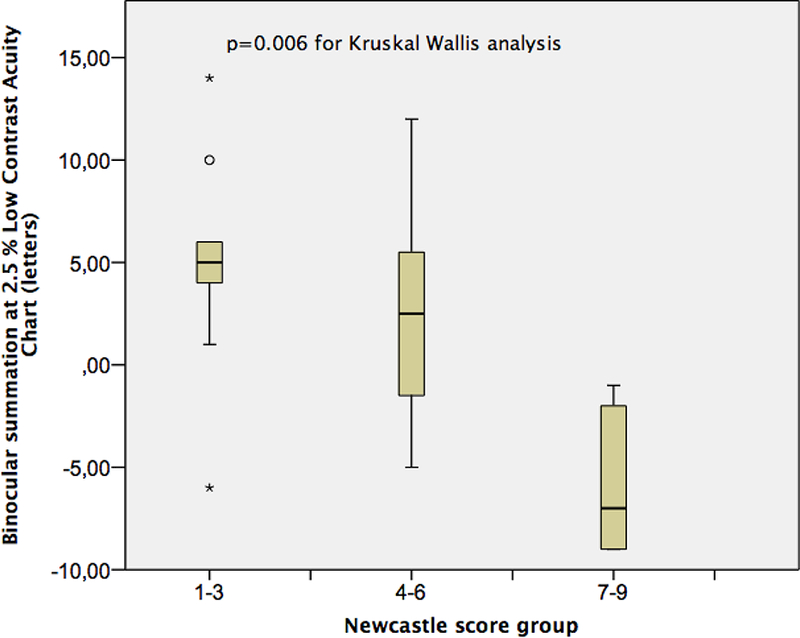
The box plot for binocular summation at 2.5 % Low Contrast Acuity charts for Newcastle Score groups.
Figure 5:
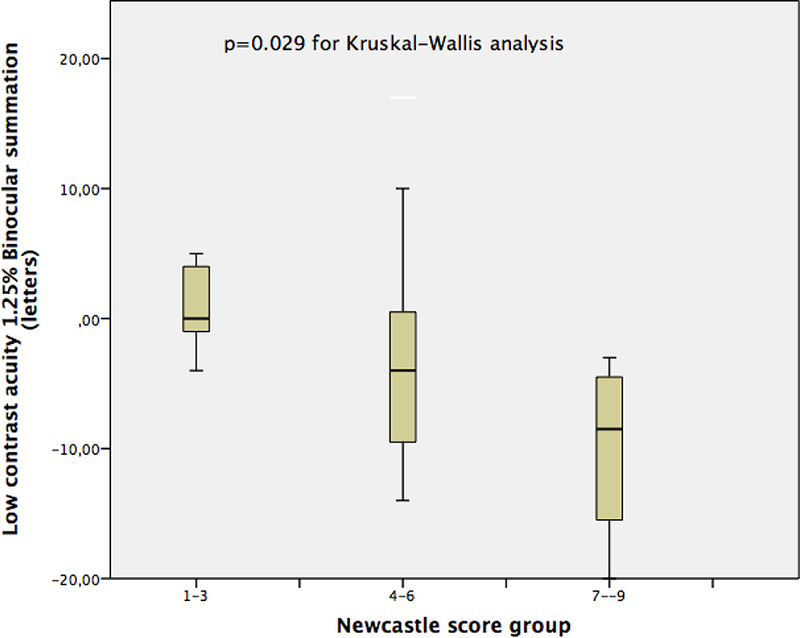
The box plot for binocular summation at 1.25 % Low Contrast Acuity charts for Newcastle Score groups.
Table 2:
Binocular Summation (letters, median, range) in groups based on control as assessed by distance –near stereoacuity disparity
| Binocular Summation (Letters): Mean ± Standard Deviation |
||||
|---|---|---|---|---|
| Early Treatment Diabetic Retinopathy Study |
2.5% Low Contrast Acuity |
1.25% Low Contrast Acuity |
||
|
Distance —near stereoacuity disparity groups |
Good control |
2 (−4 – 5) | 4 (9 – 14) | −2.5 (−11 – 5) |
|
Fair control |
0 (−3 – 6) | −1 (−3 – 8) | 2 (−6 – 10) | |
|
Poor control |
1 (−8 – 7) | 4 (−9 −10) | −4 (−20 – 7) | |
|
p value (Kruskal- Wallis) |
0.38 | 0.88 | 0.42 | |
DISCUSSION
While the ability to control IXT has traditionally been considered a measure of severity of IXT, there is no consensus regarding the best method by which to measure control in IXT. BiS is another functional measure of binocularity that we wished to investigate to determine its relationship to IXT control. Advanced age12 and interocular differences in visual acuity (VA) both impair BiS.4,12,13 When interocular differences in VA are very large, a destructive neural interaction can occur, known as binocular inhibition, diminishing binocular performance compared with that of the better eye.14,15 In these cases, participants see better monocularly than binocularly. Patients with strabismus are more likely to demonstrate binocular inhibition.5,16–18 We hypothesized that patients with better control of IXT would have better BiS scores and less binocular inhibition.
The NCS for IXT was developed to grade the severity of the distance deviation incorporating subjective parental report of control (home control) with an objective criterion (clinic control).3,9 This scale has shown to be reliable for monitoring control and response to treatment.3,10 However, this method depends on several subjective responses and relies on patients and their families to recall control at home. More recently, Mohney and Holmes have also developed a control scale using distance and near measurements in the office to eliminate the potential error in parental observation.11 However, even clinical observations are observer-dependent and therefore subject to variability and bias.
In this study we evaluated the relationship of BiS with end points used as measures of control in IXT, that generally refers to the observed frequency with which the IXT is manifest, together with a measure of the speed or ease of realignment after dissociation.19 The NCS, assigning a numerical value to control, has been proposed to facilitate serial assessments of individual patients and comparisons among patients with IXT, thereby facilitating standardized management.19 The mean BiS at 2.5% and 1.25% LCA charts were significantly different between groups of patients with low and high NCS groups. Conversely, the mean BiS at high contrast was not significantly different between these groups.
Another measure of control studied was distance-near stereo disparity. Differences between distance and near stereoacuity have been suggested to approximate control in IXT given that distance stereoacuity seems to deteriorate more often in patients with poor control.7,20 There was no significant difference in mean BiS in the distance-near stereoacuity disparity groups. This may be due to a true difference in the outcome that these two scales measure. Given that NCS and the distance-near disparity were also not well correlated, one must consider that distance-near disparity may not be an accurate measurement of control in IXT. Since in this population BiS for all of the charts and the distance and near stereoacuity scores were not significantly correlated, there is no reason to include stereopsis as a confounding factor for analysis in this study.
The BiS scores of our study patients (mean± SD: 1.9 ±1.0 letters and −2.3 ± 1.2 letters for the BiS scores for the 2.5% and 1.25% LCA charts, respectively) in our study are lower than for normal patients aged 3 to 65 years (6 ± 4 letters, and 3 ± 4 letters for the 2.5% and 1.25% LCA chart respectively).21 It is not surprising that there was binocular inhibition at 1.25% given that we have previously reported binocular inhibition at the lowest levels of contrast in strabismic patients. Neural BiS and inhibition for various electrophysiological and psychophysical tasks probably arises from interactions in cortical layer VI and is most easily demonstrated at low contrast.5,22
There are some limitations in this study. The clinical scores of NCS were provided by different physicians though calculated according to the described steps in previous studies.3 This may cause differences in clinical scores. BiS might respond instantaneously to the state of IXT control, and so be no less variable than the alignment at time of testing. Similarly a single NCS score does not fully represent global strabismus control in a given patient, given that there is variability of control from moment to moment in patients with intermittent exotropia. Also, we must consider other reasons for the variability in our correlation analysis, including perhaps that subjects in our study had differing types of intermittent exotropia, such as monofixational intermittent exotropia. In addition, we only included patients who were in the pre-operative clinic for IXT. Therefore, we did not study patients with very mild IXT who were not undergoing surgery, or patients with amblyopia or other ophthalmologic diseases.
In light of these limitations, our study showed that BiS at 2.5% low contrast are significantly lower in patients with high NCS scores as compared to lower NCS scores, possibly measuring similar features of IXT. Therefore, there is a positive relationship between IXT control and BiS in a general population of patients with IXT although they are not consistently directly related at the level of each individual patient.
Acknowledgments
Grant support (SLP):
NIH/NEI K23EY021762
Research to Prevent Blindness Walt and Lily Disney Award for Amblyopia Research
REFERENCES
- 1.Govindan M, Mohney BG, Diehl NN, Burke JP. Incidence and types of childhood exotropia: a population-based study. Ophthalmology. January 2005;112(1):104–108. [DOI] [PubMed] [Google Scholar]
- 2.Mohney BG. Common forms of childhood strabismus in an incidence cohort. Am J Ophthalmol 2007; 144(3):465–7. [DOI] [PubMed] [Google Scholar]
- 3.Haggerty H, Richardson S, Hrisos S, Strong NP, Clarke MP. The Newcastle Control Score: a new method of grading the severity of intermittent distance exotropia. Br J Ophthalmol. February 2004;88(2):233–235. [DOI] [PMC free article] [PubMed] [Google Scholar]
- 4.Blake R, Sloane M, Fox R. Further developments in binocular summation. Percept Psychophys. September 1981;30(3):266–276. [DOI] [PubMed] [Google Scholar]
- 5.Pineles SL, Velez FG, Isenberg SJ, et al. Functional burden of strabismus: decreased binocular summation and binocular inhibition. JAMA Ophthalmol. November 2013;131(11):1413–1419. [DOI] [PMC free article] [PubMed] [Google Scholar]
- 6.Early Treatment Diabetic Retinopathy Study design and baseline patient characteristics. ETDRS report number 7. Ophthalmology. May 1991;98(5 Suppl):741–756. [DOI] [PubMed] [Google Scholar]
- 7.Pineles SL, Ela-Dalman N, Zvansky AG, Yu F, Rosenbaum AL. Long-term results of the surgical management of intermittent exotropia. J AAPOS. August 2010;14(4):298–304. [DOI] [PubMed] [Google Scholar]
- 8.Buck D, Clarke MP, Haggerty H, et al. Grading the severity of intermittent distance exotropia: the revised Newcastle Control Score. Br J Ophthalmol. April 2008;92(4):577. [DOI] [PubMed] [Google Scholar]
- 9.Clarke MP. Intermittent exotropia. J Pediatr Ophthalmol Strabismus. May-June 2007;44(3):153–157; quiz 178–159. [DOI] [PubMed] [Google Scholar]
- 10.Watts P, Tippings E, Al-Madfai H. Intermittent exotropia, overcorrecting minus lenses, and the Newcastle scoring system. J AAPOS. October 2005;9(5):460–464. [DOI] [PubMed] [Google Scholar]
- 11.Mohney BG, Holmes JM. An office-based scale for assessing control in intermittent exotropia. Strabismus. September 2006;14(3):147–150. [DOI] [PMC free article] [PubMed] [Google Scholar]
- 12.Gagnon RW, Kline DW. Senescent effects on binocular summation for contrast sensitivity and spatial interval acuity. Curr Eye Res. November 2003;27(5):315–321. [DOI] [PubMed] [Google Scholar]
- 13.Pineles SL, Birch EE, Talman LS, et al. One eye or two: a comparison of binocular and monocular low-contrast acuity testing in multiple sclerosis. Am J Ophthalmol. July 2011;152(1):133–140. [DOI] [PMC free article] [PubMed] [Google Scholar]
- 14.Baker DH, Meese TS, Summers RJ. Psychophysical evidence for two routes to suppression before binocular summation of signals in human vision. Neuroscience. April 25 2007;146(1):435–448. [DOI] [PubMed] [Google Scholar]
- 15.Moradi F, Heeger DJ. Inter-ocular contrast normalization in human visual cortex. J Vis. 2009;9(3):13 11–22. [DOI] [PMC free article] [PubMed] [Google Scholar]
- 16.Chiesi C, Sargentini AD, Bolzani R. Binocular visual perception in strabismics studied by means of visual evoked responses. Doc Ophthalmol. August 15 1984;58(1):51–56. [DOI] [PubMed] [Google Scholar]
- 17.Giuseppe N, Andrea F. Binocular interaction in visual-evoked responses: summation, facilitation and inhibition in a clinical study of binocular vision. Ophthalmic Res. 1983;15(5):261–264. [DOI] [PubMed] [Google Scholar]
- 18.Leguire LE, Rogers GL, Bremer DL. Visual-evoked response binocular summation in normal and strabismic infants. Defining the critical period. Invest Ophthalmol Vis Sci. January 1991;32(1):126–133. [PubMed] [Google Scholar]
- 19.Buck D, Hatt SR, Haggerty H, et al. The use of the Newcastle Control Score in the management of intermittent exotropia. Br J Ophthalmol. February 2007;91(2):215–218. [DOI] [PMC free article] [PubMed] [Google Scholar]
- 20.Stathacopoulos RA, Rosenbaum AL, Zanoni D, et al. Distance stereoacuity. Assessing control in intermittent exotropia. Ophthalmology. April 1993;100(4):495–500. [DOI] [PubMed] [Google Scholar]
- 21.Pineles SL, Velez FG, Yu F, Demer JL, Birch E. Normative reference ranges for binocular summation as a function of age for low contrast letter charts. Strabismus. December 2014;22(4):167–175. [DOI] [PMC free article] [PubMed] [Google Scholar]
- 22.Blake R, Wilson H. Binocular vision. Vision Res. April 13 2011;51(7):754–770. [DOI] [PMC free article] [PubMed] [Google Scholar]


