

Hung et al. combine in vitro neuronal cultures, in utero electroporation, and transcriptomic profiling to show that the activation of TLR8, TLR7, or TLR3 results in dendritic shortening and that TLR7 and TLR3 but not TLR8 also control axonal growth. In-depth transcriptomic analyses show that TLRs use different downstream pathways to control neuronal morphology despite signaling through the same adapter, MYD88.
Abstract
Neuroinflammation is associated with diverse neurological disorders. Endosomal Toll-like receptors (TLRs) including TLR3, TLR7, and TLR8 cell-autonomously regulate neuronal differentiation. However, the mechanisms by which these three TLRs affect neuronal morphology are unclear. In this study, we compare these TLRs in mouse neurons. By combining in vitro neuronal cultures, in utero electroporation, and transcriptomic profiling, we show that TLR8, TLR7, and TLR3 promote dendritic pruning via MYD88 signaling. However, they induce different transcriptomic profiles related to innate immunity, signaling, and neuronal development. The temporal expression patterns and the effects on neuronal morphology are not identical upon activation of these endosomal TLRs. Pathway analyses and in vitro studies specifically implicate mitogen-activated protein kinase signaling in TLR8-mediated dendritic pruning. We further show that TLR8 is more critical for dendritic arborization at a late development stage in vivo. The activation of TLR8, TLR7, or TLR3 results in dendritic shortening, and TLR7 and TLR3 but not TLR8 also control axonal growth. In-depth transcriptomic analyses show that TLRs use different downstream pathways to control neuronal morphology, which may contribute to neuronal development and pathological responses.
Introduction
Neurodevelopmental disorders including autism spectrum disorders, schizophrenia, attention deficient hyperactivity disorder, and mental retardation are caused by both environmental insults and genetic deficiencies. Among various environmental factors, acute inflammation at early developmental stages is one of most studied factors influencing neural development (Wright et al., 1993; Patterson, 2002). Maternal immune activation is the best-studied model demonstrating that multiple factors in both adaptive and innate immunity are involved in controlling brain development (Smith et al., 2007; Parker-Athill and Tan, 2010; Choi et al., 2016; Filiano et al., 2016; Kugelberg, 2016; Kim et al., 2017; Wu et al., 2017).
In addition to maternal immune activation, accumulated evidence also indicates that neuronal innate immune responses regulate neuronal development and function. Endosomal Toll-like receptors (TLRs) including TLR3, TLR7, and TLR8 as well as downstream adapters (such as MYD88 and SARM1) and inflammasomes have been shown to be expressed in neurons and to control neuronal morphology in a cell-autonomous manner (Ma et al., 2006; Cameron et al., 2007; Chen et al., 2011, 2017; Liu et al., 2013, 2014, 2015; Wu et al., 2016). All endosomal TLRs recognize nucleotides (Shimizu, 2017). TLR3 recognizes double-stranded RNAs (Alexopoulou et al., 2001; Liu et al., 2008), whereas both TLR7 and TLR8 bind single-stranded RNAs (ssRNA; Diebold et al., 2004; Heil et al., 2004). After neuronal TLR3 activation, both dendrites and axons withdraw (Cameron et al., 2007; Chen et al., 2017), and dendritic spines became smaller and more dense (Chen et al., 2017). Activation of neuronal TLR7 also negatively regulates dendritic and axonal growth (Liu et al., 2013, 2015). TLR8 acts as a negative regulator of neurite growth (Ma et al., 2006), but its effect on dendrites, axons, or both has not yet been specified. In addition to nucleotides derived from pathogens, these endosomal TLRs and inflammasome sensors also recognize endogenous ligands such as self mRNAs and DNA derived from dead cells or autophagosomes and miRNA released via exosomal secretion (Barrat et al., 2005; Kondo et al., 2012; Lehmann et al., 2012; Park et al., 2014; Liu et al., 2015; Man et al., 2016; Monteith et al., 2016; Lian et al., 2017). Together, these sensors establish an alarm system for cells to sense both exogenous and intrinsic danger signals (Czirr and Wyss-Coray, 2012). Using this alarm system, neurons may be able to detect exogenous insults as well as intrinsic signals to regulate their growth and differentiation. Thus, even without pathogen infection, neuronal innate immune machinery may participate in the regulation of neural development by sensing intrinsic signals.
Ligand engagement triggers complex downstream TLR pathways to induce expression of various inflammatory and antiviral cytokines, i.e., the critical effectors of innate immunity. Toll/IL-1 receptor homology (TIR) domain–containing adapters are essential for TLR signaling (Kondo et al., 2012). Specifically, in peripheral tissues and immune cells, TLR7, TLR8, and other TLRs mainly use myeloid differentiation primary response gene 88 (MYD88) as a key signaling adapter to trigger immune responses (Akira and Sato, 2003). In neurons, TLR7 also uses MYD88 to control immediate early gene c-Fos expression and IL-6 production, consequently down-regulating dendritic and axonal growth (Liu et al., 2013). TLR3 uses TIR domain–containing adapter-inducing IFN-β (TRIF)/TIR domain–containing adapter molecule 1 to deliver downstream signals for cytokine expression in immune cells (Yamamoto et al., 2002) as well as neurons (Chen et al., 2017). However, in contrast with TLR7, TLR3-induced cytokines are not involved in the regulation of neuronal morphology controlled by TLR3 (Chen et al., 2017). Instead, the interaction with MYD88 is required for TLR3 to down-regulate Disc1 expression and thereby shorten dendritic length (Chen et al., 2017). Thus, different neuronal TLRs may use distinct pathways to regulate neuronal morphology.
Although TLR8 was the first reported endosomal TLR to regulate neuronal morphology (Ma et al., 2006), it is unclear how TLR8 activation achieves this function and whether it shares any similarity with TLR3 and/or TLR7 in terms of the respective mechanism. In this study, we combined in vitro neuronal cultures, in utero electroporation (IUE), and transcriptomic profiling, to reveal that different endosomal TLRs have differential effects on neuronal morphology via various pathways, suggesting complex mechanisms of TLR function and regulation in neuronal development.
Results
Up-regulation of Tlr8 upon Tlr7 deficiency and neuronal maturation
Both TLR7 and TLR8 recognize ssRNAs. Tlr8 expression was up-regulated in Tlr7−/− neurons (Fig. 1 A; Liu et al., 2013). This up-regulation of Tlr8 is neuron specific and does not occur in peripheral tissues (Liu et al., 2013). Thus, it would seem that neurons compensate for the defect of Tlr7−/− neurons in ssRNA recognition by increasing Tlr8 expression. However, Tlr7 deletion still influences dendritic and axonal growth (Liu et al., 2013, 2015), suggesting that up-regulation of TLR8 in Tlr7-deficient neurons is not sufficient to completely ameliorate the defects and also implies differential regulation or functioning of Tlr7 and Tlr8 in neurons. Consistent with this speculation, we found that in WT cultured neurons, Tlr8 expression levels gradually increased as the neurons matured, whereas Tlr7 expression levels did not change over different time points (Fig. 1 B). Under our culture conditions, neurons fully mature to form synaptic contacts at ∼18 d in vitro (DIV; Chao et al., 2008; Chen and Hsueh, 2012). Higher Tlr8 expression levels at 18 DIV suggest a role for TLR8 in mature neurons. The differential expression profiles also suggest that the roles of TLR7 and TLR8 in neurons are unlikely to be identical. We have previously revealed the function and pathways of TLR3 and TLR7 in the regulation of neuronal morphology (Liu et al., 2013; Chen et al., 2017). In this study, we elucidate the role of TLR8 in neurons and compare TLR8 with both TLR3 and TLR7.
Figure 1.

Tlr8is up-regulated in Tlr7−/− neurons and restricts dendritic growth but not axonal extension of cortical and hippocampal neurons. (A and B) Up-regulated Tlr8 RNA levels in Tlr7-deficient neurons. (B) Increased Tlr8 RNA levels in mature neuronal cultures. Q-PCR was performed and normalized with internal control Gapdh. Numbers (N) of independent repeated experiments are indicated. For each experiment, three embryonic cortices and hippocampi were pooled for each set of experiments. (C and D) Different concentrations of CL075 with or without 5 µM poly dT were added to WT and Tlr7−/− cultured neurons at 4 DIV. 1 d later, neurons were harvested for immunostaining using dendritic marker MAP2 antibodies. (C) Dosage effect on WT neurons of CL075 in the presence or absence of poly dT. Based on a previous study (Gorden et al., 2006), CL075 activates TLR7 and CL075/poly dT activates TLR8. (D) Comparison of the responses of WT and Tlr7−/− neurons. (E) Tlr7−/− cultured neurons were treated with CL075 alone or mixed with poly dT at 2 DIV for 24 h and analyzed using axonal marker SMI312 antibodies. (F) Coimmunoprecipitation of Myc-tagged TLR8 and HA-tagged MYD88. The fast-migrating protein species was likely the product of TLR8 proteolysis (Lee and Barton, 2014). IB, immunoblot; IP immunoprecipitation. (G) Dendritic morphology of Tlr7−/−– and Tlr7−/−;Myd88−/−-cultured neurons at 5 DIV. Bars, 20 µm. The sample size (n) indicates the number of examined neurons, which were randomly collected blind from two (C, D, and F) or three (E) independent experiments. Data are presented as mean + SEM (error bars). *, P < 0.05; **, P < 0.01; ***, P < 0.001. Two-tailed nonparametric Mann–Whitney test (A) and one-way (B and E) and two-way (C, D, and G) ANOVA with Bonferroni’s multiple comparisons tests were used.
TLR8 regulates dendritic growth but not axonal growth
A previous study indicated that CL075 (also known as 3M002), a thiazoloquinolone derivative, binds murine TLR7 and that a mixture of CL075 and thymidine homopolymer (poly dT) activates murine TLR8 (Fig. 1 C, top; Gorden et al., 2006). We have previously shown that CL075 specifically activates TLR7 in neurons to negatively regulate dendrite and axonal growth (Liu et al., 2013). To elucidate the role and signaling of TLR8 in neurons, we first determined the effect of the CL075/poly dT mixture on neuronal morphology. Different amounts of CL075 were mixed with 5 µM poly dT and applied to WT neuronal cultures at 4 DIV. Similar to a previous study (Liu et al., 2013), 4 µM CL075 alone was sufficient to activate TLR7 and shorten the dendritic length of neurons (Fig. 1 C). However, the mixture of 4 µM CL075 and 5 µM poly dT that should presumably activate TLR8 did not have a negative effect on the dendritic length of WT neurons (Fig. 1 C), perhaps because of low Tlr8 levels in immature WT neurons.
Because Tlr8 is up-regulated in Tlr7−/− neurons, it renders them a nice model for investigating the specific effect of TLR8 on neuronal morphology. We thus compared treatments of CL075 alone and CL075 plus poly dT on WT and Tlr7−/− neurons. In contrast with CL075, a combination of CL075 and poly dT did shorten the dendritic length of Tlr7−/− neurons but not WT neurons (Fig. 1 D), supporting an effect of the CL075/poly dT mix on TLR8 but not TLR7. Moreover, the effect of the CL075/poly dT treatment was specific for dendrites but not axons (Fig. 1 E), further supporting that the action of CL075/poly dT is not mediated by TLR7 because TLR7 activation shortens the lengths of both dendrites and axons (Liu et al., 2013).
Our previous studies evidenced a role for MYD88 in mediating the function of TLR3 and TLR7 in controlling neuronal morphology (Liu et al., 2013; Chen et al., 2017). MYD88 has also been suggested to be a downstream signaling adapter of TLR8 via direct protein interaction in peripheral cells (Kondo et al., 2012). We first confirmed the interaction between TLR8 and MYD88 using coimmunoprecipitation (Fig. 1 F). The involvement of MYD88 in TLR8 signaling was then investigated by comparing Tlr7−/−;Myd88−/− and Tlr7−/− neurons. In contrast with Tlr7−/− neurons, CL075/poly dT treatment did not reduce the dendritic length of Tlr7−/−;Myd88−/− neurons (Fig. 1 G), suggesting that MYD88 is also required for TLR8 signaling in dendritic growth, mirroring observations for the TLR3 and TLR7 pathways (Liu et al., 2013; Chen et al., 2017).
To further confirm the specificity of CL075/poly dT on TLR8, we performed Tlr8 knockdown using an artificial miRNA knockdown system. The knockdown efficiency of Tlr8 miRNA (miR-Tlr8) was confirmed in TLR8-HA overexpressed cells (Fig. 2 A). Compared with Tlr7−/− neurons transfected with control plasmid (miR-Ctrl), Tlr8 knockdown in Tlr7−/− neurons enhanced the dendritic growth of Tlr7−/− neurons (Fig. 2 B), suggesting that as for TLR7 (Liu et al., 2013, 2015), TLR8 can recognize endogenous ligands in the culture to restrict dendritic growth. When TLR8 is absent, neurons are insensitive to the endogenous ligands of TLR8 in cultures and grow better. Importantly, addition of CL075/poly dT did not restrict dendrite growth of Tlr8-knockdown Tlr7−/− neurons (Fig. 2 B), supporting the specific effect of CL075/poly dT on TLR8.
Figure 2.

Tlr8 knockdown promotes dendritic growth in vitro and in vivo. (A) Immunoblotting using HA tag antibody to examine the effect of TLR8 knockdown constructs on TLR8 expression in HEK293T cells. Two expression vectors were used to express miR-Ctrl and miR-Tlr8 as indicated. (B) Tlr7−/−-cultured neurons were transfected with miR-Ctrl and miR-Tlr8 at 2 DIV, and then treated with CL075/poly dT at 4 DIV. Dendritic morphology was analyzed at 5 DIV based on GFP signals. The sample sizes (n) of the examined neurons are indicated. Data were collected from two independent experiments. (C and D) IUE with miR-Ctrl or miR-Tlr8 was performed at E15.5 with WT (C) and Tlr7−/− (D) mice. Layer 2/3 cortical neurons were outlined by GFP signal at P7, P14, and P21 as indicated. N, number of examined mice; n, number of examined neurons. Bars: (B) 20 µm; (C and D) 50 µm. The data are presented as mean + SEM (error bars). *, P < 0.05; **, P < 0.01; ***, P < 0.001. Two-way ANOVA with Bonferroni’s multiple comparisons test (B) and two-tailed nonparametric Mann–Whitney tests (C and D) were used.
In conclusion, CL075 alone and a CL075/poly dT mix specifically act through TLR7 and TLR8, respectively, to control neuronal morphology. Although MYD88 is required for both TLR7 and TLR8, the downstream pathways and effectors of TLR7 and TLR8 in neurons are different because unlike TLR7, TLR8 activation does not influence the axonal growth of neurons.
TLR8 is more critical for dendritic arborization at the late development stage
We then investigated the effect of Tlr8 knockdown in vivo. IUE was used to deliver miR-Tlr8 and miR-Ctrl into cerebral cortex at E15.5. In WT mice, Tlr8 knockdown did not alter dendritic morphology or length at P7. However, at both P14 and P21, Tlr8 knockdown enhanced dendritic arborization of WT neurons (Fig. 2 C). Compared with control neurons, total dendritic length of Tlr8 knockdown neurons was increased by 12% and ∼19% at P14 and P21, respectively (Fig. 2 C). At P14, the number of dendritic branch tips was also increased by ∼20% via Tlr8 knockdown (Fig. 2 C). Similar to WT mice, knockdown of Tlr8 in Tlr7−/− mice did not alter dendritic morphology at P7 but increased total dendritic length and branch tip number at P14 (Fig. 2 D). Note that at P14, Tlr8 knockdown in Tlr7−/− neurons increased total dendritic length and total dendritic branch tips by 21% and 30%, respectively (Fig. 2 D). The enhancement by Tlr8 knockdown in Tlr7−/− was greater than that in WT neurons at P14 (Fig. 2 C vs. Fig. 2 D, P14 groups), consistent with the up-regulation of Tlr8 expression in Tlr7−/− neurons. Together, these results suggest that TLR8 cell-autonomously regulates dendritic growth and branching in vivo, particularly when neurons are attaining maturity.
Dendritic pruning by TLR8 activation
To further investigate how TLR8 activation regulates dendritic arborization of mature neurons, CL075/poly dT was added to WT cortical and hippocampal mixed cultures at 17 DIV. Consistent with our in vivo data (Fig. 2 B), TLR8 activation impaired dendritic arborization of mature neurons in cultures (Fig. 3 A). We then performed a time-lapse study. CL075/poly dT and control vehicle were added to WT neurons at 16 DIV. 12 h later, neuronal morphology (as outlined by transfected GFP) was monitored by time-lapse imaging for another 12 h. The difference in total dendritic length (Δ length) for individual neurons between the start time of recording and the end point was measured. Control neurons still extended their dendrites under these conditions (Fig. 3 B), with only three of 17 examined neurons withdrawing their dendrites (Fig. 3 B, bottom right). In contrast, CL075/poly dT treatment resulted in dendritic pruning and negative values of Δ length (Fig. 3 B, bottom left), with 16 of 20 examined neurons withdrawing their dendrites after CL075/poly dT treatment (Fig. 3 B, bottom right). Thus, the pruning rate of dendrites was increased in CL075/poly dT–treated neurons. In addition to WT mature neurons, we also investigated the pruning effect of CL075/poly dT treatment on Tlr7−/− neurons at the early stage. At 7 DIV, i.e., the stage when neurons actively extend their dendrites, the difference between control and CL075/poly dT–treated groups was even more pronounced (Fig. 3 C). These time-lapse analyses indicate that TLR8 activation results in dendritic pruning.
Figure 3.

TLR8 activation induces dendritic pruning of neurons. (A) TLR8 activation impairs dendritic arborization of WT mature neurons. (B and C) TLR8 activation induces dendritic pruning of WT neurons at 17 DIV (B) and Tlr7−/−-cultured neurons at 7 DIV (C). (A–C) The data were randomly collected blind from two independent experiments and are presented as mean + SEM (error bars). The numbers of examined neurons (n) are indicated. Bars: (A and B) 100 µm; (C) 50 µm. *, P < 0.05; ***, P < 0.001. A two-tailed nonparametric Mann–Whitney test was used.
TLR8 activation alters dendritic spine density and immediate early gene expression but not basal synaptic responses
In monitoring dendritic morphology at 18 DIV, we noticed an increase in dendritic spine density under CL075/poly dT treatment (Fig. 4 A). We then measured miniature excitatory synaptic currents (mEPSCs) to examine whether this increased dendritic spine density enhances neuronal responses. Interestingly, neither the frequency nor amplitude of mEPSCs was altered upon TLR8 activation (Fig. 4 B). Expression of several different immediate early genes, including Arc, Egr1, Egr4, and c-Fos, was also examined by quantitative PCR (Q-PCR). The results show that RNA expression levels of Arc, Egr1, and Egr4, but not c-Fos, were reduced upon TLR8 activation (Fig. 4 C). Thus, the neuronal response was not enhanced after TLR8 activation in mature neurons even though dendritic spine density was increased. It would seem that the increased dendritic spine density may be a compensatory response to the shortened dendrites and/or inhibited neuronal response after CL075/poly dT treatment. The morphological features of TLR8 activation, namely shorter dendrites but higher dendritic spine density, resemble the neuronal morphology of some autism spectrum disorder brains (Penzes et al., 2011; Kulkarni and Firestein, 2012).
Figure 4.

TLR8 activation alters dendritic spine density and expression of immediate early genes but not mEPSC. (A) The effect of CL075/poly dT treatment for a day on dendritic spine density of WT cultured neurons transfected with GFP-actin. Data were randomly collected blind from two independent experiments. Cell numbers of examined neurons were 29 for control and 38 for CL075/poly dT treatment. n, number of examined dendrites. (B) The results of mEPSC after CL075/poly dT treatment for 1 d. Number of examined neurons (n) collected from four independent experiments (N) are indicated. (C) Expression of immediate early genes after CL075/poly dT treatment at 18 DIV for 6 h. Q-PCR analysis was normalized with internal control Gapdh. Each dot indicates the result of an independently repeated experiment. Three embryonic cortices and hippocampi were combined for one set of experiments. Means + SEM (error bars) are also indicated in A–C. Bars: (A, original) 50 µm; (enlarged) 1 µm. *, P < 0.05; **, P < 0.01. A two-tailed nonparametric Mann–Whitney test was used.
Independence of the TLR8 pathway from secreted factors
We then investigated the downstream effectors of TLR8 in neurons. Our previous studies had shown that activation of both TLR3 and TLR7 induces cytokine expression, although only TLR7 requires a cytokine, namely IL-6, to control neuronal morphology (Liu et al., 2013; Chen et al., 2017). In this study, we investigated cytokine expression of cultured neurons upon TLR8 activation at 4 DIV. In WT neurons, CL075 alone induced expression of various cytokines including Il-6, Il-1β, Tnfα, Il-12b, Ccl3, and Ccl4, but not Il-10 and Ccl5, specifically via TLR7 because Tlr7−/− neurons did not respond to CL075 alone (Fig. 5 A). When Tlr7−/− neurons were treated with CL075/poly dT to activate TLR8, none of the examined cytokines were induced (Fig. 5 A). Cytokine expression in mature cultures also revealed similar results (Fig. 5 B). These data suggest that TLR8 most likely does not use these cytokines to down-regulate dendrite growth.
Figure 5.

Secreted factors are not required for down-regulation of dendritic growth by TLR8 activation. (A and B) The effects of TLR7 and TLR8 activation for 6 h on cytokine and chemokine expressions of cultured neurons. Q-PCR was performed by normalization with internal control Gm10069 or Gapdh as indicated. Three embryonic cortices and hippocampi of the same genotype were combined for one set of experiments. One dot indicates the data of one independent experiment. Data were collected from six experiments (n = 6). (C and D) Experiments of conditioned medium (CM). Experimental flowcharts are summarized in the left panel. The effects of conditioned medium on dendritic length are summarized in the right panel. The sample size (n) indicates the number of examined neurons randomly collected blind from two (D) or three (C) independent experiments. The data are presented as mean + SEM (error bars). *, P < 0.05; **, P < 0.01; ***, P < 0.001. Two-way (A) and one-way (B) ANOVA with Bonferroni’s multiple comparisons test as well as two-tailed nonparametric Mann–Whitney tests (C and D) were used.
To further evaluate the involvement of secreted factors in the function of neuronal TLR8, conditioned medium collected from Tlr7−/− neurons treated with CL075/poly dT was applied to WT neurons for 24 h. If a secreted factor or factors are involved, the conditioned medium would be expected to have a similar effect in terms of restricting the dendrite growth of WT neurons. However, we did not observe an inhibitory effect for the conditioned medium collected from CL075/poly dT–treated Tlr7−/− neuronal cultures (Fig. 5 C). In contrast, the conditioned medium collected from TLR7-activated neurons down-regulated the dendritic growth of Tlr7−/− neurons (Fig. 5 D; Liu et al., 2013), indicating the presence of secreted factors in the conditioned medium that could control dendritic morphology upon TLR7 activation. Together, these analyses suggest that cytokines or other secreted factors are not involved in TLR8-regulated dendritic withdrawal.
Transcriptomic profiles differ in response to TLR3, TLR7, or TLR8 activation
Previous studies (Liu et al., 2013; Chen et al., 2017) and our above results suggest that although TLR3, TLR7, and TLR8 share some common features in regulating neuronal morphology such as using MYD88 and inducing dendritic shortening, the mechanisms underlying the roles of these three TLRs seem to differ. To investigate further, we performed next-generation sequencing to analyze the transcriptomic profiles of neurons in response to TLR3, TLR7, or TLR8 activation. At 4 DIV, poly(I:C) and CL075 were separately added into WT neurons to activate TLR3 and TLR7, respectively. As before, CL075/poly dT was used to activate TLR8 in Tlr7−/− neurons. Vehicle controls of WT and Tlr7−/− neurons were included to examine the effects of poly(I:C), CL075 alone, and the CL075/poly dT mix. We identified 202, 98, and 54 genes that were significantly up-regulated (P < 0.05; fold change >1.5) upon TLR3, TLR7, and TLR8 activation, respectively. Significantly down-regulated genes (P < 0.05; fold change >1.25) were also identified: 373 genes for TLR3, 86 genes for TLR7, and 178 genes for TLR8. The top genes controlled by TLR3, TLR7, and TLR8 activation (i.e., the up-regulated and down-regulated genes separately for each of the three TLRs) according to their p-values (Fig. 6 A) and fold change (Fig. 6 B) were compared. Among the top ten genes of each of these six groups, only Gm5643 (more specifically heterogenous nuclear ribonucleoprotein A1 pseudogene) appeared in up-regulated groups of both TLR3 and TLR8 (Fig. 6 A). The remaining 58 genes were all specific for either TLR3, TLR7, or TLR8 (Fig. 6 A). The expression levels of the top 30 genes in each group were cross-compared using a heat map (Fig. 6 B). These results demonstrate the distinct gene expression profiles upon TLR3, TLR7, and TLR8 activation in neurons.
Figure 6.

Gene list and heat map of the top targets of TLR3, TLR7, and TLR8 activation in neurons. (A and B) Transcriptomic profiles after TLR3, TLR7, and TLR8 activation for 6 h of WT and Tlr7−/−-cultured neurons at 4 DIV were analyzed by RNA-seq. (A) List of the top 10 differentially expressed genes based on the p-values from TLR3-, TLR7-, and TLR8-activated neurons. Red, up-regulated; dark blue, down-regulated. (B) Heat map representing the expression levels of genes across TLR3, TLR7, and TLR8 activation. The top 30 up- and down-regulated genes of each group based on fold change were picked for cross-comparison. The color-coded bar is the z score.
We then analyzed whether TLR3, TLR7, and TLR8 regulate the expression of any common genes. Uniquely regulated genes predominated under activation of TLR3 (up-regulated: 165, ∼82%; down-regulated: 343, ∼92%), TLR7 (up-regulated: 62, ∼63%; down-regulated: 69, ∼80%), or TLR8 (up-regulated: 49, ∼91%; down-regulated: 157, ∼88%; Fig. 7 A). Double- or triple-coregulated genes by TLR3, TLR7, and TLR8 were much fewer (Fig. 7 A). In fact, there were only two up-regulated and two down-regulated genes controlled by all three TLRs (Fig. 7 A and Table S1). Thus, our intersection analysis also suggests that TLR3, TLR7, and TLR8 tend to regulate different sets of genes in neurons, although there was some minimal overlap.
Figure 7.

Downstream signal networks of TLR3, TLR7, and TLR8 in neurons differ. (A) Venn diagram showing the overlap between TLR3, TLR7, and TLR8 up-regulated (left) and down-regulated (right) genes. Gene lists showing overlap among and between TLR3, TLR7, and TLR8 are available in Table S1. (B) GO of the biological functions for up-regulated and down-regulated genes from TLR3, TLR7, and TLR8 activation. Only four biological processes in the group of TLR8 up-regulated genes were identified. The top five GO biological processes of the rest of the groups are listed. Gene lists of each GO are available in Table S2.
We then investigated the gene ontology (GO) of these TLR-regulated targets (Fig. 7 B and Table S2). Genes related to innate immune responses, cytokine production, and defense and inflammatory responses were the top cellular pathways under TLR3 and TLR7 control. In contrast, the biological processes related to TLR8-up-regulated genes were less relevant and less significant to immune responses (Fig. 7 B, up-regulated). For down-regulated genes, the top five biological processes of TLR3, TLR7, and TLR8 all differed (Fig. 7 B and Table S2). TLR3 pathways are related to synaptic transmission and organization and cell adhesion. For TLR7, they were still highly relevant to immune responses such as antigen processing and defense response. For TLR8, MAPK and WNT signaling pathways were the top processes (Fig. 7 B and Table S2). Increased expressions of some cytokines by TLR7 activation such as Ccl3, Ccl4, and Tnfα as well as down-regulation of immediate early genes by TLR8 activation such as Egr1 and Arc (Table S2) were independently confirmed by Q-PCR (Figs. 4 C and 5 A), supporting the reliability of our RNA-seq data. When we cross-compared the double and triple coregulated genes (Table S1) with the genes in the top GO biological processes (Table S2), we found only four genes shared by TLR3- and TLR8–down-regulated groups, i.e., Prex2, Cdk6, Jag1, and Ccnd1. Protein interactions among target genes for these six groups of genes were also analyzed and summarized to reveal the differences of these TLR pathways (Figs. S1 and S2). Our analyses of gene expression, ontology, and protein interactions suggest that TLR3, TLR7, and TLR8 use different mechanisms to control neuronal activity and morphology.
Involvement of P38 kinases in the TLR8 pathway
In our GO analysis, “negative regulation of MAP kinase activity” was the most significant pathway down-regulated by TLR8 activation (Fig. 7 B and Table S2). Sprouty RTK signaling antagonist 4 (Spry4) and dual specificity phosphatase 6 (Dusp6) are well-known negative feedback inhibitors of the major ERK signaling cassette. Activation of the ERK pathway induces gene expression of these two inhibitors, which down-regulates ERK activity in a feedback loop (Kim and Bar-Sagi, 2004; Tetsu and McCormick, 2017). Reduced expression of both Dusp6 and Spry4 suggests lower ERK activity upon TLR8 activation. To investigate this possibility, we performed immunoblotting to examine MAPK activity. In addition to ERK, we also compared two other MAPKs: P38 and JNK. ERK activity (as indicated by phosphorylation levels) gradually decreased and reached a minimum ∼1 h after adding CL075/poly dT to WT neurons at 16 DIV (Fig. 8 A, left; ∼50% reduction at 1 h) and to Tlr7−/− neurons at 5 DIV (Fig. 8 B, left; ∼40% reduction at 1 h). These results are consistent with the reduced expressions of Dusp6 and Spry4 revealed by our RNA-seq analyses (Table S2). Interestingly, we found that in contrast with ERK, P38 activity increased >2.5-fold 10 min after CL075/poly dT treatment and lasted for at least 24 h in WT neurons (Fig. 8 A, middle) as well as in young Tlr7−/− neurons (Fig. 8 B, middle). Activity of JNK was not altered by CL075/poly dT treatment (Fig. 8, A and B, right). These results suggest that the activities of P38 and ERK are altered by TLR8 activation in neurons.
Figure 8.

P38 MAPK and ERK are involved in TLR8 activation in cultured neurons. (A and B) WT neurons at 16 DIV (A) and Tlr7−/− neurons at 5 DIV (B) were stimulated with CL075/poly dT for different time periods as indicated. Phosphorylation levels and total protein levels of ERK, P38, and JNK were assessed by immunoblotting. Results are representative of five independent experiments, and the data of each independent experiment is the mean of experimental duplication. The data are presented as the mean + SEM (error bars). *, P < 0.05; **, P < 0.01; ***, P < 0.001. A one-way ANOVA with Bonferroni’s multiple comparisons test was used.
Rescue effect of P38 and TAK1 inhibitors on neuronal morphology controlled by TLR8
Because P38 activation was faster than that of ERK inactivation (Fig. 8) and because P38 activation down-regulates ERK activity via protein phosphatase 2A (Liu and Hofmann, 2004; Junttila et al., 2008), we postulated that P38 acts upstream of ERK in response to TLR8 activation. To investigate the role of P38, we first confirmed that P38 is phosphorylated in neurons upon TLR8 activation through immunofluorescence staining with antibodies recognizing phosphorylated P38 and the neuron marker NeuN (Fig. 9 A). An inhibitor of P38 (SB203580) was applied to WT neurons in the presence or absence of CL075/poly dT. We found that SB203580 effectively neutralized the effect of CL075/poly dT treatment on dendrite pruning and branching of mature neurons (Fig. 9 B). However, SB20358 could not reverse the negative effect of CL075 alone on dendritic length through TLR7 activation (Fig. 9 C). Moreover, SB203580 alone did not influence dendritic morphology (Fig. 9, B and C). These data strengthen the evidence for a specific role for P38 in the TLR8 pathway controlling neuronal morphology.
Figure 9.

P38 and TAK1 inhibitors neutralize the negative effect of TLR8 activation on dendritic growth. (A and D) WT neurons were treated with CL075/poly dT for 30 min at 18 DIV and subjected to immunostaining with phospho-P38, phospho-TAK1, and neuronal marker NeuN antibodies as indicated. Counterstaining with DAPI was performed to label nuclei. (B and E) GFP was transfected at 12 DIV. CL075/poly dT and P38 inhibitor SB203580 (B) and three TAK1 inhibitors, Takinib, 5ZO, and NG25 (E), were added at 17 DIV for 1 d in WT cultured neurons. (C) SB203580 treatment did not influence the effect of CL075 on younger WT neurons at 4 DIV. (B–E) Sample size (n) indicates the number of examined neurons, which were randomly collected blind from two independent experiments. Data are presented as the mean + SEM (error bars). Bars: (A) 25 µm; (B) 50 µm; (D) 20 µm. **, P < 0.01; ***, P < 0.001. One-way (E) and two-way (B and C) ANOVA with Bonferroni’s multiple comparisons test as well as two-tailed nonparametric Mann–Whitney tests (D) were used.
MYD88 is known to activate the P38 pathway via TAK1, also known as MAP3K7 (Bergstrøm et al., 2015; Lee et al., 2015). Therefore, we investigated whether TAK1 is involved in TLR8-regulated dendritic morphology. Similar to p38, TAK1 phosphorylation was increased upon TLR8 activation in neurons (Fig. 9 D). Furthermore, three different TAK1 inhibitors—Takinib, 5ZO, and NG25—all effectively neutralized the negative effect of the CL075/poly dT mix on dendritic length of mature WT neurons (Fig. 9 E). These results suggest that TLR8 uses MYD88, TAK1, and P38 to control dendritic morphology in neurons.
Discussion
Our study suggests that endosomal TLRs regulate neuronal morphogenesis through complex and varying pathways (see summary in Fig. 10). We first distinguished the specific responses of TLR7 and TLR8 to CL075 and CL075/poly dT treatment, respectively. Unlike TLR3 and TLR7, TLR8 activation induces dendritic pruning but has no obvious effect on axonal growth. Transcriptomic profiles indicate that differing downstream pathways operate in neurons under TLR3, TLR7, and TLR8 activation, although a small number of genes regulating immune responses and development overlap among TLR3-TLR7 and TLR3-TLR8, respectively (Fig. 10 and Table S1). The roles of endosomal TLRs, particularly TLR3 and TLR8, in the regulation of development-related genes suggest that TLRs function in mammalian development and echo the original finding that the Drosophila melanogaster Toll gene controls dorsoventral patterning (Anderson et al., 1985; Hashimoto et al., 1988) as well as the later discovery of Toll-6 and Toll-7 involvement in wiring specificity of Drosophila olfactory circuit assembly (Ward et al., 2015). Based on our previous studies (Liu et al., 2013; Chen et al., 2017) and this study, we suggest that although these three endosomal TLRs all use MYD88 as their signaling adapter to down-regulate neuronal morphology, the downstream pathways and target genes of these three TLRs vary, and they regulate neuronal development in different ways (Fig. 10).
Figure 10.
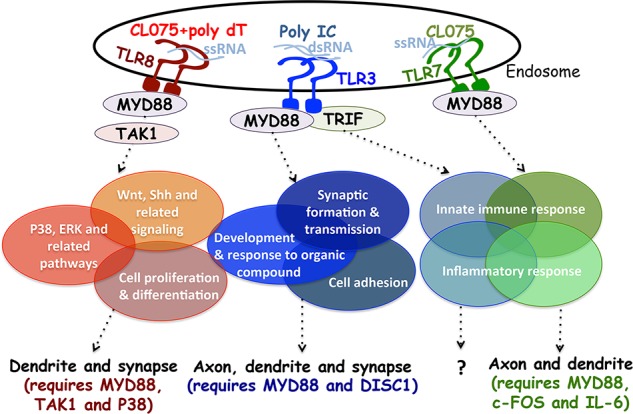
Summary of the TLR3, TLR7, and TLR8 pathways regulating neuronal morphology. TLR3, TLR7, and TLR8 all use MYD88 to control the downstream pathways regulating neuronal morphology, although TRIF is critical for TLR3 to regulate cytokine expression in neurons (Chen et al., 2017). The colored ellipses indicate the major biological processes of target genes downstream of TLR3 (blue), TLR7 (green), and TLR8 (red). Some ellipses overlap because some target genes are shared between different pathways, particularly for inflammatory and innate immune responses downstream of TLR3 and TLR7. For TLR3 and TLR8, only four genes (namely Prex2, Jag1, Cdk6, and Ccnd1) overlap among these top GO processes. The specific agonists and ligands of TLR3, TLR7, and TLR8 are also labeled. The effects of TLR3, TLR7, and TLR8 on neuronal morphology are indicated at bottom. For TLR8, MYD88, TAK1, and P38, MAPKs are required for dendritic pruning. MYD88 and DISC1 are required for TLR3-mediated neuronal morphogenesis (Chen et al., 2017). The biological function of cytokines or innate immune responses induced by the TLR3–TRIF pathway in neurons is unclear. TLR7 uses a traditional pathway involving in MYD88, c-FOS, and IL-6 to negatively regulate dendritic and axonal outgrowth in neurons (Liu et al., 2013).
The evidence indicates that neurons use various endosomal TLRs to detect diverse danger signals and down-regulate neuronal morphogenesis. The danger signals can either be foreign pattern molecules derived from pathogens or endogenous molecules released from dead cells (caused by apoptosis or infection) or autophagosomes (Czirr and Wyss-Coray, 2012). Although the downstream pathways of TLR3, TLR7, and TLR8 differ, their activations all result in dendritic shortening. This scenario suggests that neurons remain at least partially able to respond to danger signals even if mutation or other impairment disrupts one of the pathways. This redundancy would suggest that TLR regulation of neuronal morphology is critical or even necessary to fine-tune neuronal development. It would seem that the expression of different TLRs ensures that neurons can sense various danger signals and make appropriate responses to infection, cell death, or stress.
Based on our transcriptomic analysis and Q-PCR, Tlr8 (but not other TLRs) was specifically up-regulated in Tlr7−/− neurons, supporting the critical role of ssRNA recognition in regulation of neuronal morphology. Moreover, TLR7 and TLR8 exhibit inverse temporal effects on dendritic arborization. Compared with control neurons, Tlr7 knockdown leads to longer dendrites at P7 and P14 but not at P21 (Liu et al., 2013). Thus, TLR7 is critical in earlier developing neurons, and TLR8 is active later in more mature neurons. These inverse temporal effects and the differing downstream effectors of TLR7 and TLR8 in controlling neuronal morphology reflect the complicated regulation of dendritic morphology at different stages. Because TLR7 but not TLR8 also controls axonal growth, the dominant effect of TLR7 at the earlier stage may allow TLR7 to coregulate dendrites as well as axons. When neurons are attaining maturity, axonal projection is finished, so TLR8 may then replace the function of TLR7 to focus on fine-tuning dendrite morphology but not that of axons.
Although both TLR7 and TLR8 recognize ssRNA (Heil et al., 2004), species specificity exists in ssRNA recognition of TLR7 and TLR8. Murine TLR7 (human TLR8 equivalent) is known to interact with G/U-rich sequences, including viral RNA (Diebold et al., 2004; Hornung et al., 2005) and some miRNAs (Lehmann et al., 2012; Liu et al., 2015). Our previous study showed that Let7c and miR-21 shorten the dendritic length of WT neurons but not Tlr7−/− neurons (Liu et al., 2015), suggesting that the up-regulated TLR8 in Tlr7−/− neurons does not recognize Let7c and miR-21. Because TLR8 does not regulate dendritic arborization before P7 even in Tlr7−/− mouse brains, it seems very likely that endogenous ligands of TLR8 are not expressed before P7. Indeed, some miRNAs are expressed late such as miR-29b and miR-138 (Miska et al., 2004). It would be intriguing to investigate further whether TLR8 recognizes specific miRNAs or other noncoding RNAs to regulate neuronal morphology.
In addition to dendritic shortening, our results suggest that dendritic spine density is increased upon TLR8 activation. Because neither frequency nor amplitude of mEPSCs was altered and because expression of immediate early genes was reduced, we speculate that the increased dendritic spine density is likely a secondary response. TLR8-activated neurons probably endeavor to compensate for the defects of dendritic shortening by increasing dendritic spine density.
Our research indicates that the cytokines involved in innate immunity are not always required for TLRs to control neuronal morphology (Chen et al., 2017). Based on our transcriptomic profiling analyses, the genes up-regulated by TLR3 are involved in the innate immune response and inflammation, whereas the down-regulated genes are highly associated with synaptic formation and transmission, organ development, and cell adhesion (Figs. 7 and 10). Our previous study indicated that TRIF-dependent TLR3 signaling is critical for cytokine production in cultured neurons, whereas MYD88 is required for TLR3-dependent neuronal morphogenesis (Chen et al., 2017). Thus, neuronal TLR3 activation likely uses TRIF to activate expression of genes involved in innate immunity. In contrast, the MYD88-mediated TLR3 pathway may control expression of down-regulated genes involved in neuronal morphogenesis and development (Fig. 10). As for TLR3, the genes up-regulated by TLR7 activation are highly associated with the innate immune response. Because the TLR7-up-regulated genes only partially (approximately one third) overlap with those of TLR3 (Fig. 7), it is clear that even for innate immunity, TLR3 and TLR7 control different processes in neurons. This finding matches previous observations that different TLRs regulate expression of common as well as different genes in dendritic cells (Chevrier et al., 2011) and a BV-2 microglial cell line (Das et al., 2015).
It is very interesting but puzzling how MYD88 induces different downstream signaling pathways in different neuronal TLRs. There are two nonmutually exclusive possibilities to explain this observation. One is that different subcellular compartments of TLR signaling complexes determine the specificity. To investigate this possibility, specific antibodies for immunofluorescence staining and even superhigh-resolution microscopy would be required. Alternatively, how MYD88 interacts with different TLRs may differ, thereby inducing formation of different signaling complexes. MYD88 requires its N-terminal death and intermediate domains to interact with TLR3 (Chen et al., 2017) but binds TLR4 through its C-terminal TIR domain (Ohnishi et al., 2009). It is known that upon TLR activation, MYD88 forms protein aggregates to further recruit downstream kinases such as IRAK4 and IRAK2 to deliver the signal (Lin et al., 2010). It seems reasonable to suggest that the interactions of MYD88 with different TLRs results in different protein aggregate conformations, leading to recruitment of different downstream kinases and consequent activation of different pathways. Ultrastructural analyses of complexes containing MYD88, various TLRs, and even different downstream kinases will provide essential information for evaluating this supposition.
Echoing the roles of TLRs in regulation of neuronal morphology, a series of studies also revealed the impact of TLRs on mouse behaviors (Liu et al., 2014). Tlr3−/− mice show reduced anxiety-related behaviors, impaired motor coordination and a greater preference for novel objects. Tlr3 deletion also impairs cued fear memory. However, Tlr3−/− mice have better spatial memory in a water maze (Okun et al., 2010). For Tlr9 deletion, sensory and motor behaviors are abnormal (Khariv et al., 2013). Systematic behavioral analysis for Tlr7 knockout mice is still lacking, though TLR7 activation by imiquimod has been shown to enhance contextual fear memory and depression-like behaviors in mice (Kubo et al., 2012, 2013). Similarly, a behavioral study of Tlr8 knockout mice has not been performed. Note that all these studies used global knockout mice for behavioral analyses. To establish the role of neuronal TLRs in behaviors, studies using conditional knockout mice have to be conducted.
Materials and methods
Animals
TLR7−/− and Myd88−/− mice in a C57BL/6 genetic background were imported from the Jackson Laboratory. In TLR7−/− mice, exon 3 of Tlr7 gene was replaced by a lacZ gene (008380; The Jackson Laboratory; Lund et al., 2004). For Myd88, exon 3 of Myd88 locus was deleted in the Myd88-deficient allele (009088; The Jackson Laboratory; Hou et al., 2008). To generate Tlr7-/–;Myd88-/– embryos for neuronal culture, Tlr7+/−;Myd88+/− and Tlr7-/y;Myd88+/− mice that were originally obtained by crossing Tlr7−/− female mice and Myd88+/− male mice were crossed. The lines were maintained by backcrossing with C57BL/6 mice and were housed in the animal facility of the Institute of Molecular Biology, Academia Sinica, under a 14-h light/10-h dark cycle with controlled temperature and humidity. Cortical and hippocampal mixed cultures were prepared from embryos of either sex at E17–18. All animal experiments were performed with the approval of the Academia Sinica Institutional Animal Care and Utilization Committee and in strict accordance with its guidelines and those of the Council of Agriculture Guidebook for the Care and Use of Laboratory Animals.
Chemicals and antibodies
The antibodies and reagents used in this study were as follows: GFP (A6455; rabbit; Invitrogen; Chen et al., 2011); MAP2 (AB5622; rabbit; EMD Millipore; Chen et al., 2011); MAP2 (M4403; mouse; Sigma-Aldrich; Chen et al., 2011); SMI-312R (SMI-312R; mouse; Covance; Liu et al., 2013); HA (3F10; rat; Roche; Chen et al., 2017); phospho-P38 MAPK (9211; rabbit; Cell Signaling Technology); rabbit polyclonal P38 MAPK antibody (9212; rabbit; Cell Signaling Technology); phospho-ERK (4376; rabbit; Cell Signaling Technology); ERK (4695; rabbit; Cell Signaling Technology); phospho-JNK (9251; rabbit; Cell Signaling Technology); JNK (9252; rabbit; Cell Signaling Technology); phospho-TAK1 (9339; rabbit; Cell Signaling Technology); GAPDH (sc-25778; rabbit; Santa Cruz Biotechnology, Inc.; Chen et al., 2011); NeuN (MAB377; mouse; EMD Millipore; Wang et al., 2015); HRP-conjugated secondary antibodies (GE Healthcare); and Alexa Fluor 488– and Alexa Fluor 594–conjugated secondary antibodies (Invitrogen). Antibodies with validation profiles in Antibodypedia or 1DegreeBio are underlined. CL075, poly dT, poly(I:C) high molecular weight, and SB203580 were all purchased from InvivoGen. Takinib and NG 25 were purchased from Medchem Express, and (5Z)-7-oxozeaenol was purchased from Tocris.
Plasmids
For the miR-Tlr8 construct, the oligonucleotide sequence 5′-TGCTGTTTCAAACCAGGTAGAAGGAAGTTTTGGCCACTGACTGACTTCCTTCTCTGGTTTGAAA-3′ designed by the BLOCK-iT RNAi Designer tool (Invitrogen) was used. The paired oligonucleotides were inserted into a pcDNA6.2-GW/EmGFPmiR vector using the BLOCK-iT Pol II miR RNAi Expression Vector kit (Invitrogen). The plasmid pcDNA6.2-GW/EmGFP-miR-neg (miR-Ctrl; Invitrogen), predicted to not target any vertebrate gene, was used as a negative control. The negative control sequence is 5′-GAAATGTACTGCGCGTGGAGACGTTTTGGCCACTGACTGACGTCTCCACGCAGTACATTT-3′. These plasmids in the pcDNA vector were used in neuronal cultures. For IUE, the miRNA fragment in pcDNA 6.2-GW/EmGFP-miR-neg and -Tlr8 was further subcloned into the 3′ untranslated region of the GFP in pCAG vector (11150; Addgene; provided by C. Cepko; Matsuda and Cepko, 2004).
Q-PCR
Q-PCR was performed as described (Liu et al., 2013; Huang et al., 2014). In brief, to prepare total RNA from cultured cortical neurons, neurons were plated at a density of 106 cells/well in poly l-lysine–coated six-well plates. Cultured neurons were subjected to RNA extraction using TRIzol reagent according to the manufacturer’s instructions (Invitrogen), followed by DNase I (New England BioLabs) digestion for 30 min at 37°C to remove contaminating DNA. Reverse transcription was performed using the Transcriptor First Strand cDNA Synthesis kit (Roche) with an oligo(dT)18 primer. A real-time PCR assay was performed using the LightCycler480 (Roche) and Universal Probe Library probes (UPL; Roche) system. The primers and their paired probes were designed using the Assay Design Center Web Service (Roche) and are summarized in Table S3. The PCR thermal profile was set as follows: denaturation at 95°C for 10 min; 45 cycles of denaturation at 95°C for 10 s, annealing at 60°C for 30 s, and extension at 72°C for 1 s; and a final cooling step at 40°C for 30 s. Samples were assayed experimentally in triplicate and then averaged to represent the data of a single experiment. Six to eight independent biological repeats using different animals were performed for each set of experiments.
Cell culture, transfection, drug treatment, immunoprecipitation, and immunoblotting
Mouse hippocampi and dorsocaudal parts of cortices that are adjacent to hippocampi were pooled for culturing in maintaining medium (Neurobasal medium/DMEM [1:1] with B27 supplement, 0.5 mM glutamine and 1× penicillin-streptomycin; all from Thermo Fisher Scientific). Transfection of neuronal cultures was performed using calcium phosphate precipitation methods as described (Jiang and Chen, 2006) with some modifications. In brief, cultured neurons were transferred to prewarmed transfection medium (a 1:4 mixture of maintaining medium and DMEM [11960; Thermo Fisher Scientific]; 0.8 ml/well in 12-well plate) and incubated at 37°C for 1 h. For two wells of transfection, 3 µg plasmid DNA and 10 µl of 2.5 M CaCl2 were mixed first in final 100-µl solution. 100 μl of 2× Hepes-buffered saline (548 mM NaCl, 20 mM KCl, 2.8 mM Na2HPO4, 30 mM d-glucose, and 84 mM Hepes, pH 7.05–7.07) was then added dropwise to the DNA/CaCl2 mixture and gently vortexed. The DNA solutions were further incubated for 15–20 min at room temperature to form fine precipitate before adding to cultured neurons. After incubation for 15–60 min at 37°C, the DNA solutions were removed from culture. Transfection wash buffer (135 mM NaCl, 20 mM Hepes, 4 mM KCl, 1 mM Na2HPO4, 2 mM CaCl2, 1 mM MgCl2, and 10 mM glucose, pH 7.3) was added to the culture (1 ml/well) for 5 min at 5% CO2 incubation to dissolve precipitates. After transfection, the cultures were placed back in the original culture medium. Cotransfected or coexpressed GFP was used to outline neuronal morphology. To prepare the CL075/poly dT mixture, half the amount of cultured medium was first collected from cultures and vortexed with CL075 and poly dT. For immunoprecipitation, HEK293T cells were transfected with various constructs using Lipofectamine 2000 (Invitrogen). The lysates were incubated with 0.5 µg HA antibodies and protein G–Sepharose beads (Sigma-Aldrich) for 3–4 h at 4°C. The precipitated complexes were washed and immunoblotted with antibodies as indicated. For immunoblotting, cultured neurons plated in 12-well plates were lysed with 100 µl of 1× SDS sample buffer. Proteins were separated by SDS-PAGE and blotted on polyvinylidene difluoride membranes. The membranes were blocked with 5% nonfat milk in TBST for 1 h at room temperature and incubated with antibodies in 5% BSA-TBST for phosphor-protein or 0.5% nonfat milk–TBST for others at 4°C overnight. After three washes with TBST, membranes were incubated with HRP-conjugated secondary antibodies in 0.5% nonfat milk-TBST for 2 h at room temperature. The protein signals were visualized and quantified using ImageQuant LAS 4000 with the software ImageQuant LAS 4000 Biomolecular Imager (GE Healthcare).
IUE and imaging of brain sections
IUE was performed as previously described (Chen et al., 2017). In brief, pregnant female WT (crossed with WT male mice) and Tlr7−/− (crossed with Tlr7–/Y mice) mice were exposed to 1.8% isoflurane in oxygen during surgery. E15.5 embryos were used for in vivo electroporation of the cortex. Control plasmid pCAG-GFP-miR-Ctrl or pCAG-GFP-miR-Tlr8 was injected into one of the lateral ventricles of embryo brain using a glass micropipette. The embryonic brain then received five pulses (30 V for 50 ms) of electric shock at 950-ms intervals using an ECM830 square wave pulse generator (BTX; Harvard Apparatus). To minimize variation, half of the embryos of each litter were electroporated with miR-Tlr8 into one of the brain hemispheres (e.g., left cerebral cortex), and the other half had miR-Ctrl electroporated into the other hemisphere (e.g., right cerebral cortex). The electroporated offspring were anesthetized and perfused with 4% PFA in PBS at P7, P14, and P21. After 4% PFA postfixation overnight at 4°C and 30% sucrose dehydration, brains were embedded in optimal cutting temperature compound (Tissue-Tek; Sakura) and sliced into 100- or 150-µm-thick sections using a cryostat. The brain slices were then counterstained with DAPI to visualize the nuclei. After mounting with antifade solution (0.5% N-propyl gallate, 20 mM Tris, pH 8.0, and 90% glycerol), neuronal images were captured according to the GFP signal at 20–22°C with a confocal microscope (LSM 700; Zeiss) equipped with transmitted light detector (Zeiss LSM; transmitted light detector [T-PMT]) and a 20×/NA 0.80 (Plan Apochromat) objective lens. Z series images of 8–19 sections spaced 2 µm apart were acquired and projected into single images for quantification using Zen acquisition and analysis software (Zeiss). For publication, the images were processed using Photoshop (Adobe) with minimal adjustment of brightness or contrast applied to the entire images. The quantification of dendrite length and tip number and the camera lucida drawings were performed with ImageJ (National Institutes of Health). Pups from two litters were analyzed for each time point.
Immunofluorescence staining, microscope image acquisition, and live recording of cultured neurons
Immunostaining of cultured neurons was performed as described (Liu et al., 2013, 2015). Alexa Fluor 488– and Alexa Fluor 594–conjugated secondary antibodies and DAPI were used to visualize the results. Vectashield mounting medium (H-1000; Vector Labs) or antifade solution was used to preserve the fluorescent signals. For morphological analysis, immunofluorescent images of fixed cultured neurons were visualized at 20–22°C with a fluorescence microscope (AxioImager M2; Zeiss) equipped with a 20× 0.80 NA (Plan Apochromat; Zeiss) objective lens and were acquired using a cooled charge-coupled device camera (Rolera EM-C2; QImaging) with Zen software (Zeiss). Phospho-P38/NeuN and phorpho-TAK1/NeuN stained images were captured at 20–22°C with a confocal microscope (LSM 700; Zeiss) equipped with transmitted light detector (Zeiss LSM; T-PMT), a 40× 1.25 NA objective lens or a 20× 0.80 NA objective lens, and Zen acquisition and analysis software (Zeiss). For dendritic spine analysis, images of neurons were recorded at 20–22°C with a confocal microscope (LSM 700; Zeiss) equipped with a 63× 1.4 NA oil objective as a z series of 5–12 sections spaced 0.6 µm apart. The z series of images were then projected into single images for quantification. For live recordings of dendrite dynamics, cultures in original medium were placed in a chamber maintained at 37°C and 5% CO2 and imaged with a spinning-disk confocal microscope (Revolution WD; Andor Technology) equipped with a 20× 0.75 NA objective lens and MetaMorph software (7.8; Molecular Devices). For publication, the images were assembled and processed with Photoshop (CS3 or CS6, image mode 8 bits; Adobe) with minimal or no adjustment of brightness or contrast applied to the whole images.
Neuronal morphometry
Analyses of dendrites and axons in vitro or in vivo were performed as previously described (Chen et al., 2011, 2017; Liu et al., 2013, 2015). In brief, the identity of dendrite and axon was first confirmed using markers MAP2 (dendrite) and SMI-312 (axon). Dendritic and axonal features were then mainly determined by transfected GFP. Three parameters were used to determine dendritic morphology: (1) the total dendritic length, including primary dendrite and all dendritic branches; (2) the number of primary dendrites, where the primary dendrites are the processes directly emerging from the soma; and (3) the number of dendritic branch tips. For axons, total axonal length including primary axon and all axonal branches were determined. The analysis of dendritic spine density was as previously described (Wang et al., 2011; Chen and Hsueh, 2012; Shih and Hsueh, 2016). In brief, GFP-actin was transfected into cultured neurons at 12 DIV to outline neuronal morphology at 18 DIV. For each neuron, three (not less than two) clearly recognizable dendritic fragments were analyzed. The number of spines present on the dendrites (along 20 μm of each dendrite starting from a point 20 μm away from the soma) was manually counted and traced. To minimize the effects of bias, the experiments were performed blind through the relabeling of samples or images by other laboratory members. All experiments were independently repeated two or three times. For each repeat, neurons were randomly picked blind from each group for analysis. All measurements were performed using ImageJ.
mEPSCs
WT cultured neurons were treated with CL075/poly dT at 17 DIV, and whole-cell patch clamps were performed at 18 DIV to record mEPSCs. Neurons were incubated in extracellular solution containing 136.5 mM NaCl, 5.4 mM KCl, 5 mM Hepes, 1.8 mM CaCl2, 0.53 mM MgCl2, 5.56 mM glucose, 0.001 mM tetrodotoxin, and 0.02 mM bicuculline. The intracellular solution contained 135.25 mM K-gluconate, 8.75 mM KCl, 0.2 mM EGTA, 7 mM Na2-phosphocreatine, 10 mM Hepes, 4 mM Mg-ATP, and 0.3 mM Na-ATP. Neurons were voltage-clamped at −70 mV, and mEPSCs were recorded with an Axon Axopatch 200B amplifier (Molecular Devices) and filtered at 1 kHz. Clampfit software (10.4; Molecular Devices) was used to detect mEPSCs from the raw data with an amplitude threshold of 5 pA.
RNA-seq and bioinformatic analyses
At 4 DIV, total RNA was extracted from mouse cultured neurons 6 h after treatment using TRIzol reagent according to the manufacturer’s instructions (Invitrogen). To investigate the downstream targets of TLR3, TLR7, and TLR8, WT neurons were treated with vehicle control, poly(I:C) (for TLR3 activation) or CL075 (for TLR7 activation), whereas Tlr7−/− neurons were treated with vehicle control and CL075/poly dT (for TLR8 activation). RNA was quality controlled and quantified using an Agilent 2100 Bioanalyzer. The mRNA sequencing libraries were prepared using a TruSeq Stranded mRNA kit (Illumina), and 75–76-cycle single-read sequencing was performed using the 500 High-output v2 (75 cycle) sequencing kit on an Illumina NextSeq500 instrument. Bioinformatic analysis was performed as described (Padmanabhan et al., 2018). In brief, CLC Genomics Workbench (v.10.1.1, QIAGEN) was used for raw sequencing trimming, sequence mapping, and data analysis. Raw sequencing reads were trimmed by removing adapter sequences, low-quality sequences (Phred quality score of < 20), and sequences with lengths >25 bp. Sequencing reads were mapped to the mouse genome assembly (mm10) from University of California, Santa Cruz, with the following parameters: mismatches = 2, minimum fraction length = 0.9, minimum fraction similarity = 0.9, and maximum hits per read = 5. Gene expressions were based on transcripts per kilobase million. Differential expression (i.e., fold changes) of genes in response to TLR3, TLR7, or TLR8 activation were estimated by generalized linear model (McCarthy et al., 2012). The statistical significance (P < 0.05) was further decided by Wald Test. The Venn diagram (Fig. 7 A) was drawn with the software VENNY (2.0; Oliveros, 2007). GO biological processes were assessed using Metascape (http://metascape.org/gp/index.html#/main/step1) and the interaction maps (Figs. S1 and S2) were created in STRING (https://string-db.org/). Heat maps were generated using MeV v4.9.
Data availability
The RNA-seq raw data has been deposited to NCBI with accession no. GSE107199.
Statistical analysis
All the quantitative data in this study are presented as means + SEM. Graphs were plotted and analyzed using Prism (5.0 and 7.0; GraphPad software). No statistical method was applied to evaluate the sample size, but our sample sizes are similar to those of previous publications (Liu et al., 2013; Huang et al., 2014; Shih and Hsueh, 2016). Basically, six to eight independent cultures were used for Q-PCR. For the study of dendrite and axon morphology, 30–40 neurons were randomly collected blind each time from two to three independent experiments. For dendritic spine analysis, three dendrites of each neuron were quantitated, and 30–40 neurons were randomly collected blind each time from two independent experiments. Data collection and analysis were conducted randomly and blind through relabeling of the samples by other laboratory members. None of the collected data were excluded from analysis. Statistical analysis was performed using the two-tailed nonparametric test (Mann–Whitney test) for two-group comparisons. For multiple group comparisons, we applied one-way analysis of variance (ANOVA) with Bonferroni’s test in Prism. Two-way ANOVA with Bonferroni’s test was performed in Prism to analyze the effects of two genetic factors combined with two different treatments. P-values <0.05 were considered significant.
Online supplemental material
Figs. S1 and S2 summarize the interaction maps of TLR3-, TLR7-, and TLR8-regulated genes as indicated. Table S1 lists the coregulated genes. Table S2 contains the top five biological processes regulated by TLRs. Table S3 summarizes primer sequences and probe numbers for Q-PCR.
Supplementary Material
Acknowledgments
We thank Sue-Ping Lee at the Imaging Core, Dr. Shu-Yun Tung at the Genomics Core, Ruei-Lin Chiang and Dr. Paul Wei-Che Hsu at the Bioinformatics Core, Huei-Fang Wu at the Electrophysiology and Calcium Imaging Core Facility, the Transgenic Core Facility, and the Animal Facility of the Institute of Molecular Biology, Academia Sinica, for excellent technical assistance; Dr. Connie Cepko at Harvard Medical School for the plasmid pCAG-GFP; Dr. John O’Brien for English editing; and members of Y.-P. Hsueh’s laboratory for relabeling samples for blind experiments.
This work was supported by grants from Academia Sinica, the Ministry of Science and Technology (MOST 106-2321-B-001-019 and 105-2311-B-001-061-MY3), and the Simons Foundation (SFARI#388449) to Y.-P. Hsueh.
The authors declare no competing financial interests.
Author contributions: Y.-F. Hung designed and performed the majority of experiments, blind analyzed the data, and wrote the manuscript. C.-Y. Chen assisted in designing experiments, analyzed the RNA-seq results for TLR3, and performed IUE and immunoblotting. Y.-C. Shih was involved in IUE. H.-Y. Liu and C.-M. Huang prepared the constructs for IUE and performed and analyzed the initial IUE study. Y.-P. Hsueh designed experiments, supervised the project, secured financial support, and wrote the manuscript.
References
- Akira S., and Sato S.. 2003. Toll-like receptors and their signaling mechanisms. Scand. J. Infect. Dis. 35:555–562. 10.1080/00365540310015683 [DOI] [PubMed] [Google Scholar]
- Alexopoulou L., Holt A.C., Medzhitov R., and Flavell R.A.. 2001. Recognition of double-stranded RNA and activation of NF-kappaB by Toll-like receptor 3. Nature. 413:732–738. 10.1038/35099560 [DOI] [PubMed] [Google Scholar]
- Anderson K.V., Jürgens G., and Nüsslein-Volhard C.. 1985. Establishment of dorsal-ventral polarity in the Drosophila embryo: Genetic studies on the role of the Toll gene product. Cell. 42:779–789. 10.1016/0092-8674(85)90274-0 [DOI] [PubMed] [Google Scholar]
- Barrat F.J., Meeker T., Gregorio J., Chan J.H., Uematsu S., Akira S., Chang B., Duramad O., and Coffman R.L.. 2005. Nucleic acids of mammalian origin can act as endogenous ligands for Toll-like receptors and may promote systemic lupus erythematosus. J. Exp. Med. 202:1131–1139. 10.1084/jem.20050914 [DOI] [PMC free article] [PubMed] [Google Scholar]
- Bergstrøm B., Aune M.H., Awuh J.A., Kojen J.F., Blix K.J., Ryan L., Flo T.H., Mollnes T.E., Espevik T., and Stenvik J.. 2015. TLR8 senses Staphylococcus aureus RNA in human primary monocytes and macrophages and induces IFN-β production via a TAK1-IKKβ-IRF5 signaling pathway. J. Immunol. 195:1100–1111. 10.4049/jimmunol.1403176 [DOI] [PubMed] [Google Scholar]
- Cameron J.S., Alexopoulou L., Sloane J.A., DiBernardo A.B., Ma Y., Kosaras B., Flavell R., Strittmatter S.M., Volpe J., Sidman R., and Vartanian T.. 2007. Toll-like receptor 3 is a potent negative regulator of axonal growth in mammals. J. Neurosci. 27:13033–13041. 10.1523/JNEUROSCI.4290-06.2007 [DOI] [PMC free article] [PubMed] [Google Scholar]
- Chao H.W., Hong C.J., Huang T.N., Lin Y.L., and Hsueh Y.P.. 2008. SUMOylation of the MAGUK protein CASK regulates dendritic spinogenesis. J. Cell Biol. 182:141–155. 10.1083/jcb.200712094 [DOI] [PMC free article] [PubMed] [Google Scholar]
- Chen Y.K., and Hsueh Y.P.. 2012. Cortactin-binding protein 2 modulates the mobility of cortactin and regulates dendritic spine formation and maintenance. J. Neurosci. 32:1043–1055. 10.1523/JNEUROSCI.4405-11.2012 [DOI] [PMC free article] [PubMed] [Google Scholar]
- Chen C.Y., Lin C.W., Chang C.Y., Jiang S.T., and Hsueh Y.P.. 2011. Sarm1, a negative regulator of innate immunity, interacts with syndecan-2 and regulates neuronal morphology. J. Cell Biol. 193:769–784. 10.1083/jcb.201008050 [DOI] [PMC free article] [PubMed] [Google Scholar]
- Chen C.Y., Liu H.Y., and Hsueh Y.P.. 2017. TLR3 downregulates expression of schizophrenia gene Disc1 via MYD88 to control neuronal morphology. EMBO Rep. 18:169–183. 10.15252/embr.201642586 [DOI] [PMC free article] [PubMed] [Google Scholar]
- Chevrier N., Mertins P., Artyomov M.N., Shalek A.K., Iannacone M., Ciaccio M.F., Gat-Viks I., Tonti E., DeGrace M.M., Clauser K.R., et al. 2011. Systematic discovery of TLR signaling components delineates viral-sensing circuits. Cell. 147:853–867. 10.1016/j.cell.2011.10.022 [DOI] [PMC free article] [PubMed] [Google Scholar]
- Choi G.B., Yim Y.S., Wong H., Kim S., Kim H., Kim S.V., Hoeffer C.A., Littman D.R., and Huh J.R.. 2016. The maternal interleukin-17a pathway in mice promotes autism-like phenotypes in offspring. Science. 351:933–939. 10.1126/science.aad0314 [DOI] [PMC free article] [PubMed] [Google Scholar]
- Czirr E., and Wyss-Coray T.. 2012. The immunology of neurodegeneration. J. Clin. Invest. 122:1156–1163. 10.1172/JCI58656 [DOI] [PMC free article] [PubMed] [Google Scholar]
- Das A., Chai J.C., Kim S.H., Lee Y.S., Park K.S., Jung K.H., and Chai Y.G.. 2015. Transcriptome sequencing of microglial cells stimulated with TLR3 and TLR4 ligands. BMC Genomics. 16:517 10.1186/s12864-015-1728-5 [DOI] [PMC free article] [PubMed] [Google Scholar]
- Diebold S.S., Kaisho T., Hemmi H., Akira S., and Reis e Sousa C.. 2004. Innate antiviral responses by means of TLR7-mediated recognition of single-stranded RNA. Science. 303:1529–1531. 10.1126/science.1093616 [DOI] [PubMed] [Google Scholar]
- Filiano A.J., Xu Y., Tustison N.J., Marsh R.L., Baker W., Smirnov I., Overall C.C., Gadani S.P., Turner S.D., Weng Z., et al. 2016. Unexpected role of interferon-γ in regulating neuronal connectivity and social behaviour. Nature. 535:425–429. 10.1038/nature18626 [DOI] [PMC free article] [PubMed] [Google Scholar]
- Gorden K.K., Qiu X.X., Binsfeld C.C., Vasilakos J.P., and Alkan S.S.. 2006. Cutting edge: Activation of murine TLR8 by a combination of imidazoquinoline immune response modifiers and polyT oligodeoxynucleotides. J. Immunol. 177:6584–6587. 10.4049/jimmunol.177.10.6584 [DOI] [PubMed] [Google Scholar]
- Hashimoto C., Hudson K.L., and Anderson K.V.. 1988. The Toll gene of Drosophila, required for dorsal-ventral embryonic polarity, appears to encode a transmembrane protein. Cell. 52:269–279. 10.1016/0092-8674(88)90516-8 [DOI] [PubMed] [Google Scholar]
- Heil F., Hemmi H., Hochrein H., Ampenberger F., Kirschning C., Akira S., Lipford G., Wagner H., and Bauer S.. 2004. Species-specific recognition of single-stranded RNA via Toll-like receptor 7 and 8. Science. 303:1526–1529. 10.1126/science.1093620 [DOI] [PubMed] [Google Scholar]
- Hornung V., Guenthner-Biller M., Bourquin C., Ablasser A., Schlee M., Uematsu S., Noronha A., Manoharan M., Akira S., de Fougerolles A., et al. 2005. Sequence-specific potent induction of IFN-alpha by short interfering RNA in plasmacytoid dendritic cells through TLR7. Nat. Med. 11:263–270. 10.1038/nm1191 [DOI] [PubMed] [Google Scholar]
- Hou B., Reizis B., and DeFranco A.L.. 2008. Toll-like receptors activate innate and adaptive immunity by using dendritic cell-intrinsic and -extrinsic mechanisms. Immunity. 29:272–282. 10.1016/j.immuni.2008.05.016 [DOI] [PMC free article] [PubMed] [Google Scholar]
- Huang T.N., Chuang H.C., Chou W.H., Chen C.Y., Wang H.F., Chou S.J., and Hsueh Y.P.. 2014. Tbr1 haploinsufficiency impairs amygdalar axonal projections and results in cognitive abnormality. Nat. Neurosci. 17:240–247. 10.1038/nn.3626 [DOI] [PubMed] [Google Scholar]
- Jiang M., and Chen G.. 2006. High Ca2+-phosphate transfection efficiency in low-density neuronal cultures. Nat. Protoc. 1:695–700. 10.1038/nprot.2006.86 [DOI] [PubMed] [Google Scholar]
- Junttila M.R., Li S.P., and Westermarck J.. 2008. Phosphatase-mediated crosstalk between MAPK signaling pathways in the regulation of cell survival. FASEB J. 22:954–965. 10.1096/fj.06-7859rev [DOI] [PubMed] [Google Scholar]
- Khariv V., Pang K., Servatius R.J., David B.T., Goodus M.T., Beck K.D., Heary R.F., and Elkabes S.. 2013. Toll-like receptor 9 deficiency impacts sensory and motor behaviors. Brain Behav. Immun. 32:164–172. 10.1016/j.bbi.2013.04.007 [DOI] [PubMed] [Google Scholar]
- Kim H.J., and Bar-Sagi D.. 2004. Modulation of signalling by Sprouty: A developing story. Nat. Rev. Mol. Cell Biol. 5:441–450. 10.1038/nrm1400 [DOI] [PubMed] [Google Scholar]
- Kim S., Kim H., Yim Y.S., Ha S., Atarashi K., Tan T.G., Longman R.S., Honda K., Littman D.R., Choi G.B., and Huh J.R.. 2017. Maternal gut bacteria promote neurodevelopmental abnormalities in mouse offspring. Nature. 549:528–532. 10.1038/nature23910 [DOI] [PMC free article] [PubMed] [Google Scholar]
- Kondo T., Kawai T., and Akira S.. 2012. Dissecting negative regulation of Toll-like receptor signaling. Trends Immunol. 33:449–458. 10.1016/j.it.2012.05.002 [DOI] [PubMed] [Google Scholar]
- Kubo Y., Yanagawa Y., Matsumoto M., Hiraide S., Kobayashi M., and Togashi H.. 2012. Toll-like receptor 7-mediated enhancement of contextual fear memory in mice. Pharmacol. Biochem. Behav. 102:495–501. 10.1016/j.pbb.2012.06.017 [DOI] [PubMed] [Google Scholar]
- Kubo Y., Yanagawa Y., Matsumoto M., Hiraide S., and Togashi H.. 2013. Enhanced depressive-like behaviors after Toll-like receptor 7 stimulation in mice. Nihon Shinkei Seishin Yakurigaku Zasshi. 33:41–47. [PubMed] [Google Scholar]
- Kugelberg E. 2016. Neuroimmunology: IL-17A mediates a path to autism. Nat. Rev. Immunol. 16:205 10.1038/nri.2016.35 [DOI] [PubMed] [Google Scholar]
- Kulkarni V.A., and Firestein B.L.. 2012. The dendritic tree and brain disorders. Mol. Cell. Neurosci. 50:10–20. 10.1016/j.mcn.2012.03.005 [DOI] [PubMed] [Google Scholar]
- Lee B.L., and Barton G.M.. 2014. Trafficking of endosomal Toll-like receptors. Trends Cell Biol. 24:360–369. 10.1016/j.tcb.2013.12.002 [DOI] [PMC free article] [PubMed] [Google Scholar]
- Lee J., Tian Y., Chan S.T., Kim J.Y., Cho C., and Ou J.H.. 2015. TNF-α induced by hepatitis C virus via TLR7 and TLR8 in hepatocytes supports interferon signaling via an autocrine mechanism. PLoS Pathog. 11:e1004937 10.1371/journal.ppat.1004937 [DOI] [PMC free article] [PubMed] [Google Scholar]
- Lehmann S.M., Krüger C., Park B., Derkow K., Rosenberger K., Baumgart J., Trimbuch T., Eom G., Hinz M., Kaul D., et al. 2012. An unconventional role for miRNA: Let-7 activates Toll-like receptor 7 and causes neurodegeneration. Nat. Neurosci. 15:827–835. 10.1038/nn.3113 [DOI] [PubMed] [Google Scholar]
- Lian Q., Xu J., Yan S., Huang M., Ding H., Sun X., Bi A., Ding J., Sun B., and Geng M.. 2017. Chemotherapy-induced intestinal inflammatory responses are mediated by exosome secretion of double-strand DNA via AIM2 inflammasome activation. Cell Res. 27:784–800. 10.1038/cr.2017.54 [DOI] [PMC free article] [PubMed] [Google Scholar]
- Lin S.C., Lo Y.C., and Wu H.. 2010. Helical assembly in the MyD88-IRAK4-IRAK2 complex in TLR/IL-1R signalling. Nature. 465:885–890. 10.1038/nature09121 [DOI] [PMC free article] [PubMed] [Google Scholar]
- Liu Q., and Hofmann P.A.. 2004. Protein phosphatase 2A-mediated cross-talk between p38 MAPK and ERK in apoptosis of cardiac myocytes. Am. J. Physiol. Heart Circ. Physiol. 286:H2204–H2212. 10.1152/ajpheart.01050.2003 [DOI] [PubMed] [Google Scholar]
- Liu H.Y., Hong Y.F., Huang C.M., Chen C.Y., Huang T.N., and Hsueh Y.P.. 2013. TLR7 negatively regulates dendrite outgrowth through the Myd88-c-Fos-IL-6 pathway. J. Neurosci. 33:11479–11493. 10.1523/JNEUROSCI.5566-12.2013 [DOI] [PMC free article] [PubMed] [Google Scholar]
- Liu H.Y., Chen C.Y., and Hsueh Y.P.. 2014. Innate immune responses regulate morphogenesis and degeneration: Roles of Toll-like receptors and Sarm1 in neurons. Neurosci. Bull. 30:645–654. 10.1007/s12264-014-1445-5 [DOI] [PMC free article] [PubMed] [Google Scholar]
- Liu H.Y., Huang C.M., Hung Y.F., and Hsueh Y.P.. 2015. The microRNAs Let7c and miR21 are recognized by neuronal Toll-like receptor 7 to restrict dendritic growth of neurons. Exp. Neurol. 269:202–212. 10.1016/j.expneurol.2015.04.011 [DOI] [PubMed] [Google Scholar]
- Liu L., Botos I., Wang Y., Leonard J.N., Shiloach J., Segal D.M., and Davies D.R.. 2008. Structural basis of Toll-like receptor 3 signaling with double-stranded RNA. Science. 320:379–381. 10.1126/science.1155406 [DOI] [PMC free article] [PubMed] [Google Scholar]
- Lund J.M., Alexopoulou L., Sato A., Karow M., Adams N.C., Gale N.W., Iwasaki A., and Flavell R.A.. 2004. Recognition of single-stranded RNA viruses by Toll-like receptor 7. Proc. Natl. Acad. Sci. USA. 101:5598–5603. 10.1073/pnas.0400937101 [DOI] [PMC free article] [PubMed] [Google Scholar]
- Ma Y., Li J., Chiu I., Wang Y., Sloane J.A., Lü J., Kosaras B., Sidman R.L., Volpe J.J., and Vartanian T.. 2006. Toll-like receptor 8 functions as a negative regulator of neurite outgrowth and inducer of neuronal apoptosis. J. Cell Biol. 175:209–215. 10.1083/jcb.200606016 [DOI] [PMC free article] [PubMed] [Google Scholar]
- Man S.M., Karki R., and Kanneganti T.D.. 2016. AIM2 inflammasome in infection, cancer, and autoimmunity: Role in DNA sensing, inflammation, and innate immunity. Eur. J. Immunol. 46:269–280. 10.1002/eji.201545839 [DOI] [PMC free article] [PubMed] [Google Scholar]
- Matsuda T., and Cepko C.L.. 2004. Electroporation and RNA interference in the rodent retina in vivo and in vitro. Proc. Natl. Acad. Sci. USA. 101:16–22. 10.1073/pnas.2235688100 [DOI] [PMC free article] [PubMed] [Google Scholar]
- McCarthy D.J., Chen Y., and Smyth G.K.. 2012. Differential expression analysis of multifactor RNA-Seq experiments with respect to biological variation. Nucleic Acids Res. 40:4288–4297. 10.1093/nar/gks042 [DOI] [PMC free article] [PubMed] [Google Scholar]
- Miska E.A., Alvarez-Saavedra E., Townsend M., Yoshii A., Sestan N., Rakic P., Constantine-Paton M., and Horvitz H.R.. 2004. Microarray analysis of microRNA expression in the developing mammalian brain. Genome Biol. 5:R68 10.1186/gb-2004-5-9-r68 [DOI] [PMC free article] [PubMed] [Google Scholar]
- Monteith A.J., Kang S., Scott E., Hillman K., Rajfur Z., Jacobson K., Costello M.J., and Vilen B.J.. 2016. Defects in lysosomal maturation facilitate the activation of innate sensors in systemic lupus erythematosus. Proc. Natl. Acad. Sci. USA. 113:E2142–E2151. 10.1073/pnas.1513943113 [DOI] [PMC free article] [PubMed] [Google Scholar]
- Ohnishi H., Tochio H., Kato Z., Orii K.E., Li A., Kimura T., Hiroaki H., Kondo N., and Shirakawa M.. 2009. Structural basis for the multiple interactions of the MyD88 TIR domain in TLR4 signaling. Proc. Natl. Acad. Sci. USA. 106:10260–10265. 10.1073/pnas.0812956106 [DOI] [PMC free article] [PubMed] [Google Scholar]
- Okun E., Griffioen K., Barak B., Roberts N.J., Castro K., Pita M.A., Cheng A., Mughal M.R., Wan R., Ashery U., and Mattson M.P.. 2010. Toll-like receptor 3 inhibits memory retention and constrains adult hippocampal neurogenesis. Proc. Natl. Acad. Sci. USA. 107:15625–15630. 10.1073/pnas.1005807107 [DOI] [PMC free article] [PubMed] [Google Scholar]
- Oliveros J.C.2007. Venny. An interactive tool for comparing lists with Venn's diagrams.http://bioinfogp.cnb.csic.es/tools/venny/index.html
- Padmanabhan A., Candelaria N., Wong K.K., Nikolai B.C., Lonard D.M., O’Malley B.W., and Richards J.S.. 2018. USP15-dependent lysosomal pathway controls p53-R175H turnover in ovarian cancer cells. Nat. Commun. 9:1270 10.1038/s41467-018-03599-w [DOI] [PMC free article] [PubMed] [Google Scholar]
- Park C.K., Xu Z.Z., Berta T., Han Q., Chen G., Liu X.J., and Ji R.R.. 2014. Extracellular microRNAs activate nociceptor neurons to elicit pain via TLR7 and TRPA1. Neuron. 82:47–54. 10.1016/j.neuron.2014.02.011 [DOI] [PMC free article] [PubMed] [Google Scholar]
- Parker-Athill E.C., and Tan J.. 2010. Maternal immune activation and autism spectrum disorder: Interleukin-6 signaling as a key mechanistic pathway. Neurosignals. 18:113–128. 10.1159/000319828 [DOI] [PMC free article] [PubMed] [Google Scholar]
- Patterson P.H. 2002. Maternal infection: Window on neuroimmune interactions in fetal brain development and mental illness. Curr. Opin. Neurobiol. 12:115–118. 10.1016/S0959-4388(02)00299-4 [DOI] [PubMed] [Google Scholar]
- Penzes P., Cahill M.E., Jones K.A., VanLeeuwen J.E., and Woolfrey K.M.. 2011. Dendritic spine pathology in neuropsychiatric disorders. Nat. Neurosci. 14:285–293. 10.1038/nn.2741 [DOI] [PMC free article] [PubMed] [Google Scholar]
- Shih Y.T., and Hsueh Y.P.. 2016. VCP and ATL1 regulate endoplasmic reticulum and protein synthesis for dendritic spine formation. Nat. Commun. 7:11020 10.1038/ncomms11020 [DOI] [PMC free article] [PubMed] [Google Scholar]
- Shimizu T. 2017. Structural insights into ligand recognition and regulation of nucleic acid-sensing Toll-like receptors. Curr. Opin. Struct. Biol. 47:52–59. 10.1016/j.sbi.2017.05.010 [DOI] [PubMed] [Google Scholar]
- Smith S.E., Li J., Garbett K., Mirnics K., and Patterson P.H.. 2007. Maternal immune activation alters fetal brain development through interleukin-6. J. Neurosci. 27:10695–10702. 10.1523/JNEUROSCI.2178-07.2007 [DOI] [PMC free article] [PubMed] [Google Scholar]
- Tetsu O., and McCormick F.. 2017. ETS-targeted therapy: Can it substitute for MEK inhibitors? Clin. Transl. Med. 6:16 10.1186/s40169-017-0147-4 [DOI] [PMC free article] [PubMed] [Google Scholar]
- Wang H.F., Shih Y.T., Chen C.Y., Chao H.W., Lee M.J., and Hsueh Y.P.. 2011. Valosin-containing protein and neurofibromin interact to regulate dendritic spine density. J. Clin. Invest. 121:4820–4837. 10.1172/JCI45677 [DOI] [PMC free article] [PubMed] [Google Scholar]
- Wang H.Y., Hsieh P.F., Huang D.F., Chin P.S., Chou C.H., Tung C.C., Chen S.Y., Lee L.J., Gau S.S., and Huang H.S.. 2015. RBFOX3/NeuN is required for hippocampal circuit balance and function. Sci. Rep. 5:17383 10.1038/srep17383 [DOI] [PMC free article] [PubMed] [Google Scholar]
- Ward A., Hong W., Favaloro V., and Luo L.. 2015. Toll receptors instruct axon and dendrite targeting and participate in synaptic partner matching in a Drosophila olfactory circuit. Neuron. 85:1013–1028. 10.1016/j.neuron.2015.02.003 [DOI] [PMC free article] [PubMed] [Google Scholar]
- Wright P., Gill M., and Murray R.M.. 1993. Schizophrenia: Genetics and the maternal immune response to viral infection. Am. J. Med. Genet. 48:40–46. 10.1002/ajmg.1320480110 [DOI] [PubMed] [Google Scholar]
- Wu P.J., Liu H.Y., Huang T.N., and Hsueh Y.P.. 2016. AIM 2 inflammasomes regulate neuronal morphology and influence anxiety and memory in mice. Sci. Rep. 6:32405 10.1038/srep32405 [DOI] [PMC free article] [PubMed] [Google Scholar]
- Wu W.L., Hsiao E.Y., Yan Z., Mazmanian S.K., and Patterson P.H.. 2017. The placental interleukin-6 signaling controls fetal brain development and behavior. Brain Behav. Immun. 62:11–23. 10.1016/j.bbi.2016.11.007 [DOI] [PMC free article] [PubMed] [Google Scholar]
- Yamamoto M., Sato S., Mori K., Hoshino K., Takeuchi O., Takeda K., and Akira S.. 2002. A novel Toll/IL-1 receptor domain-containing adapter that preferentially activates the IFN-beta promoter in the Toll-like receptor signaling. J. Immunol. 169:6668–6672. 10.4049/jimmunol.169.12.6668 [DOI] [PubMed] [Google Scholar]
Associated Data
This section collects any data citations, data availability statements, or supplementary materials included in this article.
Supplementary Materials
Data Availability Statement
The RNA-seq raw data has been deposited to NCBI with accession no. GSE107199.