Abstract
Tumor morphology improved sensitivity, accuracy, and specificity of the diagnosis, but all diagnostic techniques have attenuation correction issues.
To compare computed tomographic (CT), positron emission tomographic (PET), and magnetic resonance imaging (MRI) characteristics of patients with brain tumor in a Chinese setting.
A nonrandomized, nonexperimental, cross-sectional trial.
Jining No. 1 People's Hospital, China.
In total, 127 patients who had clinically confirmed a brain tumor were included in the cross-sectional study. Patients were subjected to brain CT, MRI, and PET. The tumors resected after brain surgery were subjected to morphological diagnosis. Statistical analysis of data of surgically removed tumor and that of different methods of diagnosis was performed using Wilcoxon test following Tukey–Kramer test. Spearmen correlation was performed between diagnostic modalities and in vivo morphology. Results were considered significant at 99% of confidence level.
The data of diameter and volume of tumor derived from CT (Spearman r = 0.9845 and 0.9706), and MRI (Spearman r = 0.955 and 0.2378) were failed to correlate with that of that of the surgically removed tumor. However, prediction of diameter and volume of the tumor by PET (Spearman r = 0.9922 and 0.9921) were correlated with that of the surgically removed tumor. CT and MRI were failed to quantified pituitary adenomas.
The study was recommended PET for assessment of brain tumor.
Keywords: brain neoplasms, computed tomography, magnetic resonance imaging, positron emission tomography, serologic tests
1. Introduction
Brain tumor could be developed in the body over several days.[1] It is difficult to screen out brain tumor without radiography.[2] Addition of anatomical parameters including morphology of tumors could be improved sensitivity, accuracy, and specificity of diagnosis process.[3] To study the morphology of tumor after surgical resection is an invasive and risky method. Therefore, there is a need for a noninvasive diagnostic method(s) for a brain tumor.
Physiological stress and surrounding impact are different for each individual.[4] However, the clinical manifestations (CM) of brain tumor are conditions that most preferably found in the adjacent area of the brain.[5] The development of the tumor can become in the right frontal part of the brain. However, the other parts of the brain could be normal.[6]
Plain-film radiography (PFR) of brain tumor is provided nonspecific results.[7] The currently available guidelines to use it are provided a rough idea of malignancies in brain tumor conditions.[8] The brain tumor predicted by it could have more serious conditions.[9] It has limited applications in brain tumor diagnosis and has more applications in traumatic brain injury.[10]
The computed tomography (CT) was first made available for human subjects in 1974 by Ambrose, Hounsfield, and Cormack. It has the advantage of providing differences in electron densities among the tissues and used contrast(s),[11] which helps to understand the functional and structural status of the clinically significant symptoms, for assisting the treatment decision-making.[12–15] Magnetic resonance imaging (MRI), CT, and positron emission tomography (PET) are widely used methods for human neuroimaging.[6]
Currently used CT has a capacity resolution with submillimeter at 90 s of acquisition time without contrast brain studies.[16] It is easy to use.[17] It is provided less information than MRI in brain diagnosis,[18] but, at present, is used for diagnosis of Parkinson disease,[19] aging,[20] and head trauma.[21]
Advanced MR sequences, for example, diffusion tensor imaging and perfusion MR imaging have advantages of differentiation of low-grade gliomas from high-grade gliomas,[22] but these are efficient to distinguish radiation necrosis from residual gliomas after chemotherapy.[23] Moreover, the exponential component-polynomial component is used for an unsupervised and robust gliomas.[24]
There are several studies available for comparing 2 or more radiological diagnostic techniques in brain tumor, but all studies could not be succeeded in conclusion on any single accurate diagnostic technique because of attenuation correction issues.[25]
The primary aim of the study was to diagnose brain tumor in patients who had clinically confirmed brain malignancies in a Chinese setting. The secondary endpoint of the study was to compare accuracy and efficacy of CT scan, PET scan, and MRI with parameters of the surgically removed tumor at the level I of evidence.
2. Materials and methods
2.1. Chemicals
[18]F-fluorodeoxyglucose (FDG) was purchased from BV Cyclotron VU, Amsterdam, The Netherlands.
2.2. Ethical approval and consent to participate and publication
The trial had been registered in Research registry (www.researchregistry.com), UID No. researchregistry3395, dated June 25, 2014. The Jining No. 1 People's Hospital review board had approved the diagnostic protocols for radiographical research of brain in human subjects under the law of China and 2013 Declaration of Helsinki. The work is reported in line with the STROCSS criteria (Strengthening the Reporting of Cohort Studies in Surgery). Written informed consent for radiology, anesthesia, surgeries, to have additional procedures done purely for research purposes, and patient information and images (if any) to be published in all formats (hard and/or electronics) irrespective of time and language were provided by the patients or their legally authorized representatives.
2.3. Inclusion criteria
In total, 127 patients who had problems with remembering, confusion, focal neurological deficit, abnormal behavior, and/or increased sleepiness admitted (clinically confirmed brain malignancies by serological tests) admitted to the department of the neuropsychology of Jining No. 1 People's Hospital during July 2014 to December 2017 were included in the nonrandomized, nonexperimental, cross-sectional study. Patients who had aged >18 years were only included in the study.
2.4. Exclusion criteria
Patients <18 years of age and who did not follow-up protocols were excluded from the study. Patients who had no any suspected features of brain malignancy were excluded from the study. Patients who had rectal cancer, hepatic disorders, anemia, leukemia, neutropenia, and skin cancer excluded from the study (because these features may interfere with clinical pathology).
Demographical and clinical data of the patients before the diagnosis of brain tumor are reported in Table 1. STARD (Standards for Reporting of Diagnostic Accuracy Studies) flowchart of nonrandomized, nonexperimental, cross-sectional, diagnosis study is reported in Figure 1.
Table 1.
Demographical and clinical data of the enrolled patients before diagnosis.
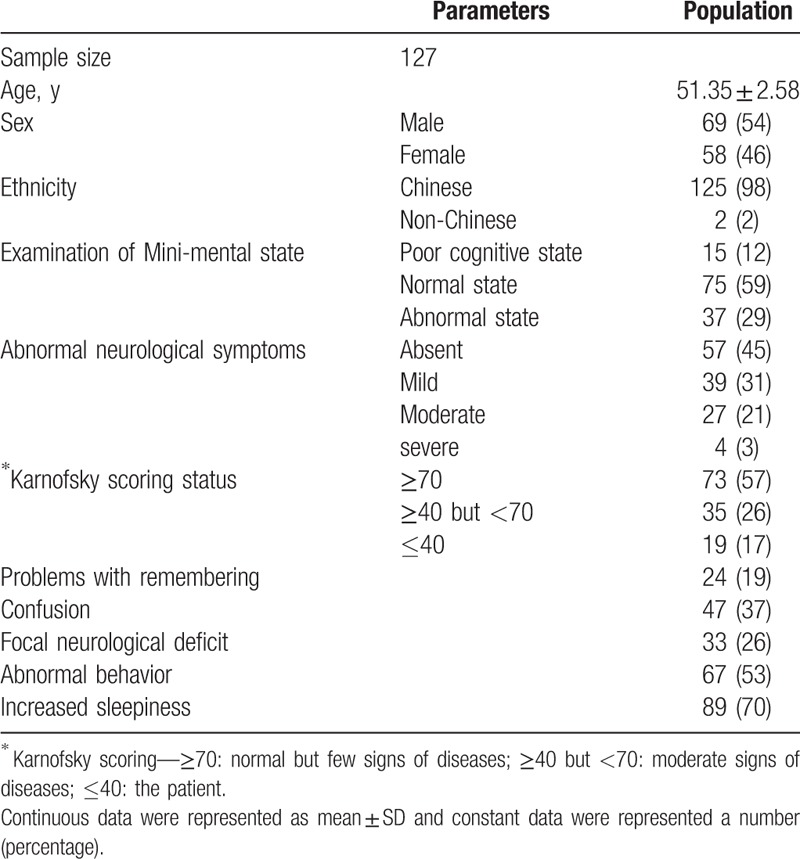
Figure 1.
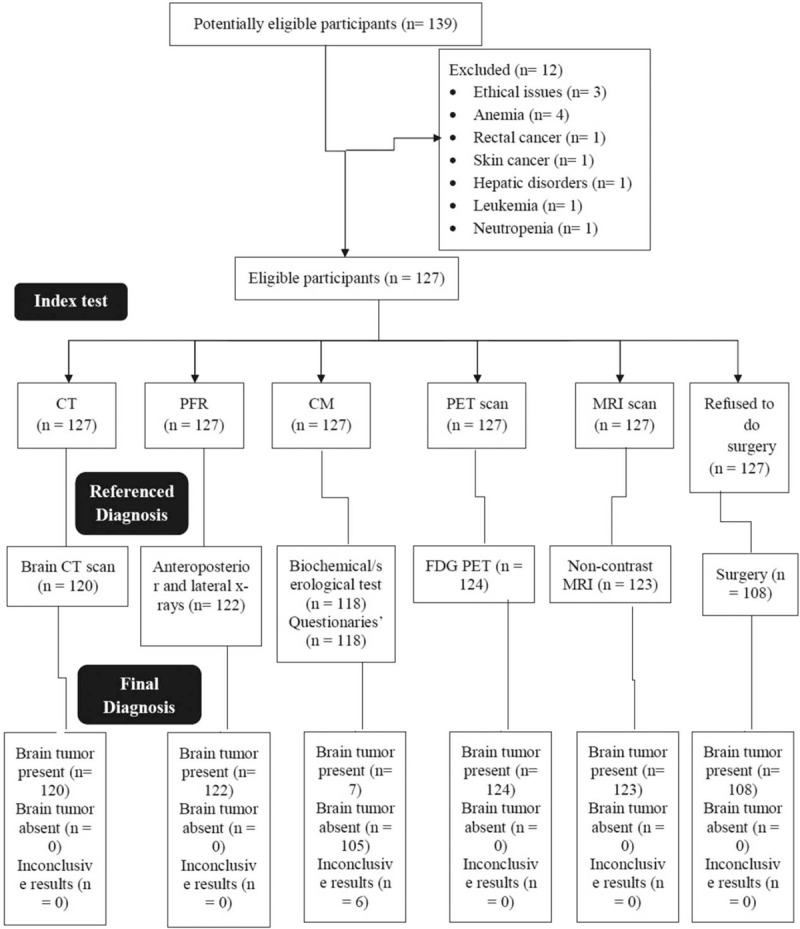
STARD flowchart of nonrandomized, nonexperimental, cross-sectional, diagnosis experimental study for brain tumor patients. CT = computed tomography, PFR = plain-film radiography, CM = clinical manifestation, PET = positron emission tomography, MRI = magnetic resonance imaging. Per Protocol method of analysis was preferred.
2.5. Diagnosis methods
2.5.1. CT scan
Patients were subjected to brain CT scan (SOMATOM Definition AS+, Siemens Healthcare GmbH, Germany). The images were recorded at 0.6 cm slice thickness, 80 kV voltage, 75 mA currents, 20 s/scan, and 360o rotation, and 5 mSv radiation dose. General anesthesia was administered to the patients during CT scan if required.[26] Data related to the brain tumor were accessed using standard quantification guidelines of CT.[27] All images were converted to patients’ DICOM file formats (field of view [DFOV] 51.2 × 61.5 cm).
2.5.2. PET scan
Patients had fasted overnight before scanning. There were 18.51 ± 0.01 MBq/100 g of body weight of FDG injected through a vein. Patients were subjected to brain PET scan (CT Secura, Philips) and PET images were collected at 5 mSv radiation dose. The PET images were reconstructed for decay, quiet time, normalization, photon attenuation, by the algorithm. The reconstructed size was 250 × 250 × 60 cube meter.[6]
2.5.3. MRI
All patients were subjected to MRI (Achieva 3.0T XTX—Diamond, Koninklijke Philips N.V.) at axial fluid-attenuated inversion recovery and sequences visualizing (anatomical protocols). All types of MR images were converted to patients’ DICOM file formats (DFOV 31.3 × 25.0 cm).[6]
2.5.4. PFR
Anteroposterior and lateral views of PFR of patients were carried out using 300 mA high-performance medical X-ray machine (GE Healthcare, UK) at 0.01 mSv radiation dose. Data related to the brain tumor were accessed by visual observations of anteroposterior and lateral views of PFR.[28]
All images were analyzed by authors who had at least 3 years of experience at the time of the study.
2.5.5. CM
CM of enrolled patients as worsening headache, fatigue, weight loss, bone marrow suppression, anemia, neutropenia, infection, lymphopenia, gastrointestinal disorder, anorexia, constipation, nausea, repeated vomiting, liver diseases, seizures, and the serum level of alanine aminotransferase (ALT) and aspartate aminotransferase (AST) were measured. A headache, fatigue, gastrointestinal disorder, anorexia, constipation, nausea, and vomiting were reported by simply asking the question. The biochemical and serological analysis was performed using portable full automatic CE approved automated hematology analyzer (HORIBA Medical Diagnostics Instruments & Systems, Kyoto, Japan).[29]
2.5.6. Postsurgery analysis
The tumor resected after brain surgery was subjected to morphological analysis as volume and diameter by Digital Electronic Carbon Fiber Vernier Caliper (Safeseed Electronic, China).[30]
2.6. Cost of diagnosis
The cost for PFR, CM, PET, MRI, and CT scan for every patient was evaluated.[25]
2.7. Statistical analysis
Statistical analysis between data of surgically resected tumor and that of different methods of diagnosis was carried out using Wilcoxon-matched pair test[31] after Tukey–Kramer multiple comparisons test (considering critical value [q] > 4.03 as the significant level).[32] The Spearmen nonparametric correlation was used to correlate parameters of volume and diameter of the tumor for all diagnostic techniques with that of the surgically resected tumor.[30] InStat (GraphPad, Inc., CA) was used for statistical analysis purposes. The results were considered significant at 99% of confidence level.
3. Results
During the diagnosis, 7 CT scans, 5 plain-film radiographs, 3 PET scans, 4 MRI scans, and 9 patients’ data of serum level of ALT and AST were failed to consider in statistical analysis because of missing information in DICOM files of patients while reporting by nursing staff. There were 19 patients refused to do brain surgery. Therefore, total, 108 patients’ tumor removed morphology data were used in statistical analysis.
CT, PET, and MRI scans were successfully quantified tumor and necrosis of cells. However, CM and PFR were failed to do so (Table 2).
Table 2.
Comparisons of different diagnostic techniques for brain tumor.

Moreover, when the ancillary skull tumor was present, CT and MRI were failed to quantified tumor because CT images are simple tomographic images would not suffice for the diagnosis of pituitary adenoma (Fig. 2) and the white and grey matter of brain interrupted quality of MR images respectively (Fig. 3). In such conditions, PET was reliable for quantification of the tumor.
Figure 2.
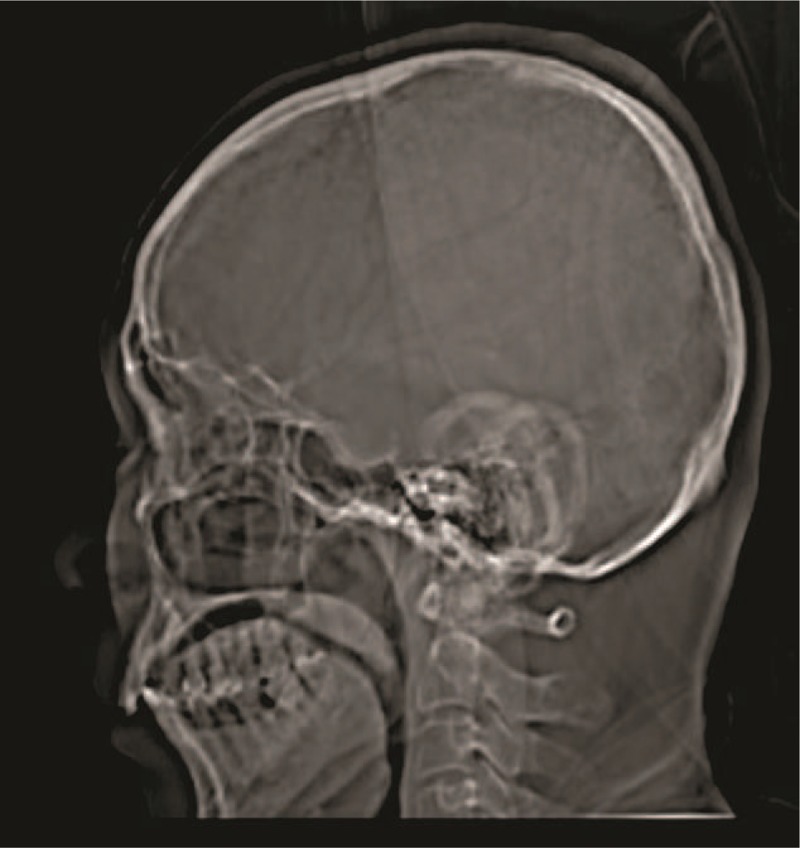
The computed tomographic image of 35 years old patient, who had pituitary adenomas. 0.6 cm slice thickness, 80 kV voltage, 75 μA current, 20 s/scan, and 360o rotation, 5 mSv radiation dose, display field of view: 51.2 × 61.5 cm, and zoom: 144%.
Figure 3.
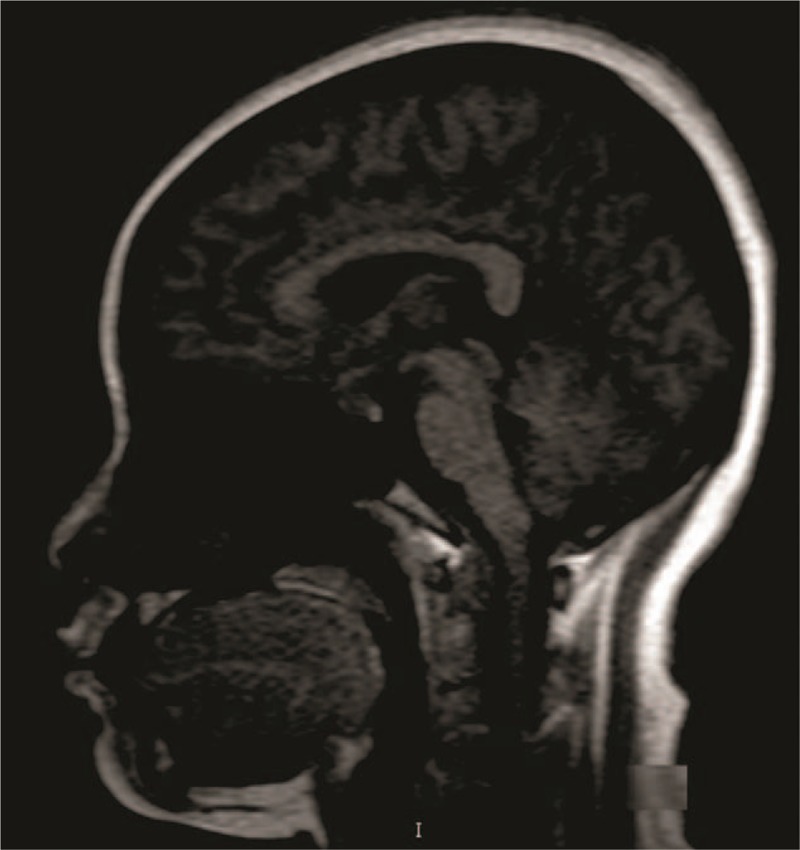
Magnetic resonance imaging of 35 years old patient, who had pituitary adenomas. Display field of view: 31.3 × 25 cm and zoom: 230%.
PET, CT, and MRI scan methods were succeeded in the quantification of tumor diameter and tumor volume. PFR had been shown less sized tumor diameter (P < .0001, q = 17.284) and tumor volume (P < .0001, q = 4.412) or provided approximate measurement than as that quantified by CT scan. However, CM had failed to provide a morphology of the tumor.
The data of diameter and volume for CT (Spearman r = 0.9845 and 0.9706; Fig. 4A and B), PFR (Spearman r = 0.9688 and 0.9194; Fig. 5A and B), and MRI (Spearman r = 0.955 and 0.2378; Fig. 6A and B) were failed to correlate with that of the surgically resected tumor. However, the prediction for diameter and volume by PET (Spearman r = 0.9922 and 0.9921; Fig. 7A and B) were correlated with that of the surgically resected tumor.
Figure 4.
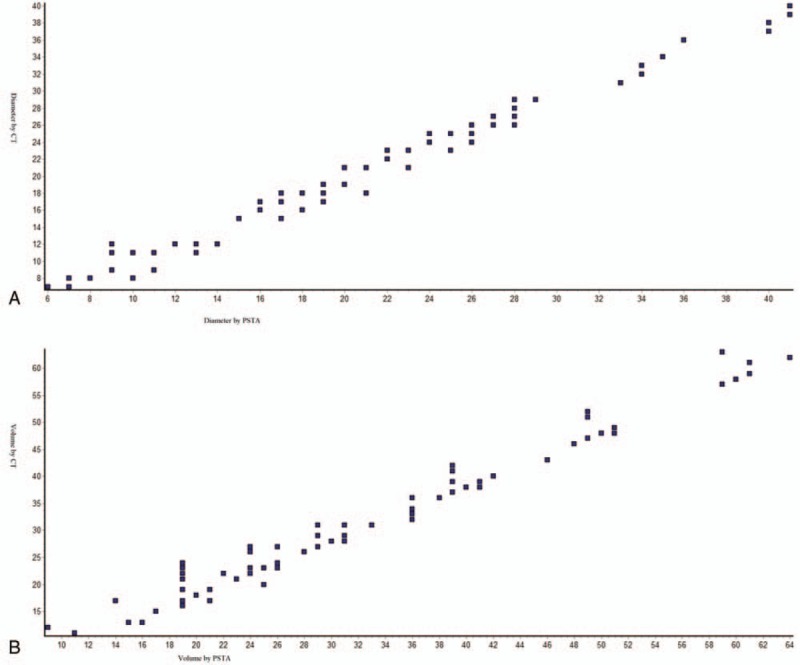
Spearmen nonparametric correlation curve between PSTA and CT scans (A) for tumor diameter, Spearman r = 0.9845 (corrected for ties, 99% confidence interval: 0.9896–0.993); (B) for tumor volume, Spearman r = 0.9706 (corrected for ties, 99% confidence interval: 0.9801–0.9866). Numbers of point = 106, n = 107 for PSTA and n = 106 for CT scan, PSTA = postsurgery tumor analysis, CT = computed tomography. Software generated figures.
Figure 5.
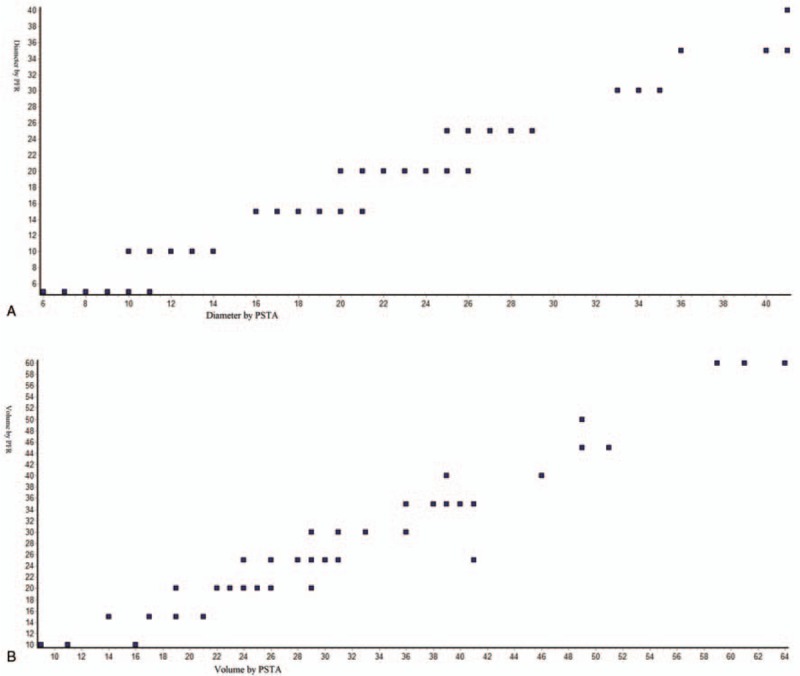
Spearmen nonparametric correlation curve between PSTA and PFR. (A) for tumor diameter, Spearman r = 0.9688 (corrected for ties, 99% confidence interval: 0.98–0.9872); (B) for tumor volume, Spearman r = 0.9194 (corrected for ties, 99% confidence interval: 0.9477–0.9662). Numbers of point = 84, n = 107 for PSTA, and n = 85 for PFR. PSTA = postsurgery tumor analysis, PFR = plainfilm radiography. Software generated figures.
Figure 6.
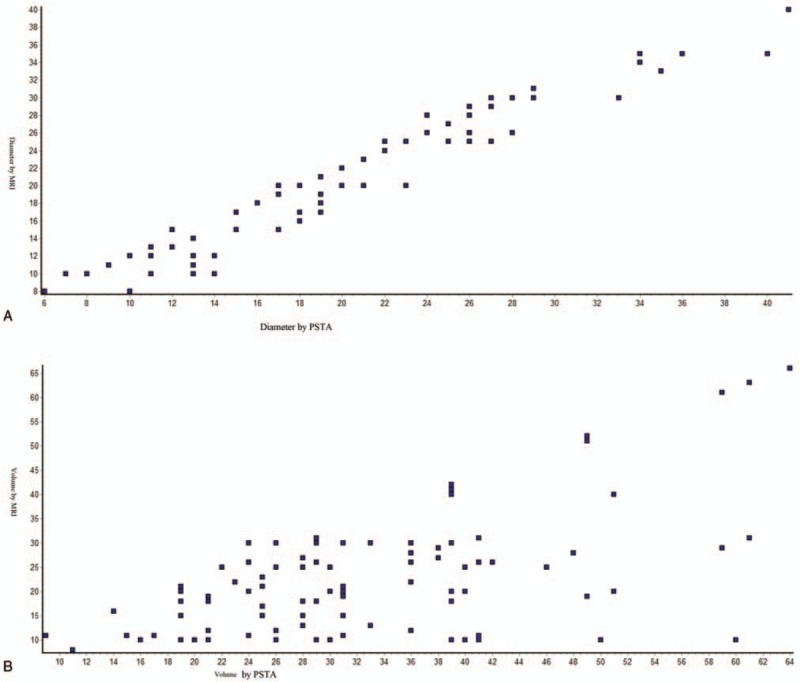
Spearmen nonparametric correlation curve between PSTA and MRI scan (A) for tumor diameter, Spearman r = 0.955 (corrected for ties, 99% confidence interval: 0.9695–0.9794); (B) for tumor volume, Spearman r = 0.2378 (corrected for ties, 99% confidence interval: 0.414–0.5638). Numbers of point = 107. n = 107 for PSTA and n = 109 for MRI scan. PSTA = postsurgery tumor analysis and MRI = magnetic resonance imaging. Software generated figures.
Figure 7.
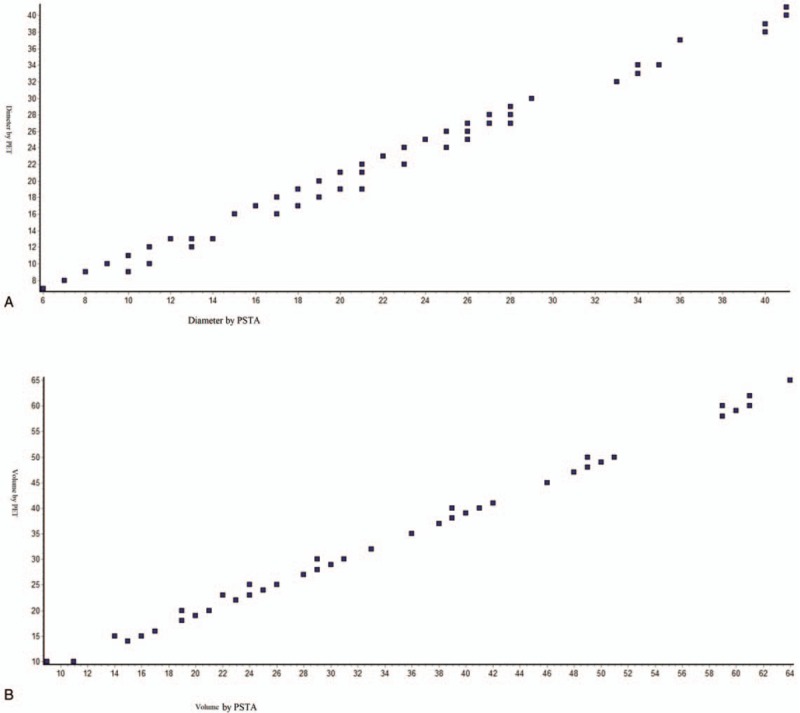
Spearmen nonparametric correlation curve between PSTA and PET scan (A) for tumor diameter, Spearman r = 0.9922 (corrected for ties, 99% confidence interval: 0.9885–0.9948); (B) for tumor volume, Spearman r = 0.9921 (corrected for ties, 99% confidence interval: 0.9882– 0.9947). Numbers of point = 107. n = 107 for PSTA and n = 115 for PET scan. PSTA = postsurgery tumor analysis, PET = positron emission tomography. Software generated figures.
The cost of diagnosis procedure was in the order of PET scan > MRI scan > CT scan > CM > PFR (Fig. 8).
Figure 8.
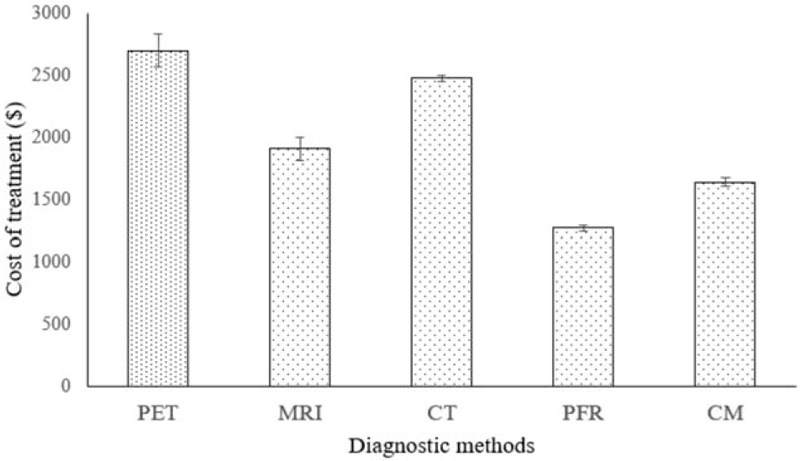
Cost of diagnosis. Data were expressed as mean ± SD, n = 127 for all groups. PET scan had highest cost of diagnosis (P < .0001, q = 31.726) then after MRI scan (P < .0001, q = 12.56). CT scan had excessive cost of diagnosis than PFR (P < .0001, q = 517.09) and CM (P < .0001, q = 357.95). CT = Computed tomography, PFR = Plain-film radiography, CM = clinical manifestation, PET = positron emission tomography, MRI = magnetic resonance imaging. Wilcoxon-matched pair test following Tukey–Kramer multiple comparisons test was used for statistical analysis. P < .01 and q > 4.03 were considered as significant.
4. Discussion
Compared with FDG PET, CT, MRI, and PFR had 0.97, 0.73, and 0.88 sensitivity. However, CM had not sensitive to a brain tumor. Because of complex anatomy and physiology of the brain, the diagnostic method is challenging[2] and required extra features of brain tumors for proper diagnosis process.[3] In respect to the diagnostic procedures performed for a brain tumor, a framework of 6 techniques was provided a competitive state-of-the-art for comparing different diagnostic modalities in brain tumor.
PFR was failed to provide morphology regarding diameter and volume of the tumor. Moreover, CM had not revealed the morphology of the tumor. Only CT, PET, MRI scan is succeeded in the prediction of the morphology of tumor.[30] In consideration of techniques involved, the diagnostic cross-sectional study had demonstrated the choice of method, that is, CT, PET, MRI scan to assist the surgeons regarding surgery for brain tumor.
Considering CT as “gold standard” is a debatable issue. No controlled studies are available regarding sensitivity and specificity of CT scan for a brain tumor.[30] In relation to lack of control, the diagnostic techniques demonstrated in the CT are required to perform with accuracy and precise method. CT images do not fully cover the field of view than MRI and PET scans.[33] In respect to correction with surgically resected tumor data, the study stressed benefits of PET scan and MRI for a brain tumor diagnosis.
PET scan had excessive cost than MRI and CT. However, CT scan is relatively cheap than MRI.[30] PET has increased the burden of radiation[25] but has a high resolution[34] than MRI. Moreover, PFR[7] and CM[15] have not quantified brain tumor morphology. MRI data are not easily be converted into attenuation values.[33] Moreover, when the tumor is situated in the medulla oblongata, MRI is not an accurate method of diagnosis.[25] In respect to the selection of diagnostic method, the study was provided more accurate data at comparatively loss cost to the patients.
In limitations of the study, for example, the study was limited to spatial resolution for depth morphology of the tumor. The study was not used bioluminescence imaging technique for diagnosis of brain tumor. The study was not used for PET/MRI combined diagnostic technique. The study is limited to adult patients only. The large field of view was considered in separate CT, MRI, and PET. Anatomical conditions of patients as blood sugar level, use of steroids is also affected the diagnostic images. These factors were not discussed in the study. In the future work, PET study can be possible with 68Gallium-tagged DOTA-octreotate, which could be more cheap and accurate among all diagnostic modalities in brain tumor.
5. Conclusion
The nonrandomized, nonexperimental, cross-sectional diagnostic study was concluded that PET scan is adequate, reliable, and accurate diagnostic method to assess necrosis of tumor and morphology of tumor than the other diagnostic method in the brain. The surgeon can use positron emission tomography scan as a supplementary diagnostic technique for magnetic resonance imaging for quantification of a brain tumor before surgery.
Acknowledgments
We thank the medical and nonmedical staff of Jining No. 1 People's Hospital, Jining, Shandong, China who make this work enable.
Author contributions
QL had performed conceptualization and data curation. YL had performed formal analysis, funding acquisition, and investigation. LL had performed visualization and written the manuscript for the intellectual content. WD had performed methodology and project administrator.
Conceptualization: Qian Luo.
Data curation: Qian Luo.
Formal analysis: Yongmei Li.
Funding acquisition: Yongmei Li.
Investigation: Yongmei Li.
Methodology: Wanglun Diao.
Project administration: Wanglun Diao.
Visualization: Lan Luo.
Writing – original draft: Lan Luo.
Writing – review and editing: Lan Luo.
Footnotes
Abbreviations: ALT = alanine aminotransferase, AST = aspartate aminotransferase, CM = clinical manifestations, CT = computed tomography, DFOV = field of view, DICOM = Digital Imaging and Communications in Medicine, FDG = 18F-fluorodeoxyglucose, MRI = magnetic resonance imaging, PET = positron emission tomography, PFR = plain-film radiography, q = critical value for Tukey–Kramer multiple comparisons test, STARD = Standards for Reporting of Diagnostic Accuracy Studies, STROCSS = Strengthening the Reporting of Cohort Studies in Surgery.
This study was supported by a grant from the project of science and technology bureau of Jining, China (No. 56-2-4).
The authors have no conflicts of interest to disclose.
References
- [1].Rice T, Lachance DH, Molinaro AM, et al. Understanding inherited genetic risk of adult glioma—a review. Neurooncol Pract 2016;3:10–6. [DOI] [PMC free article] [PubMed] [Google Scholar]
- [2].Weller M, van den Bent M, Tonn JC, et al. European Association for Neuro-Oncology (EANO) guideline on the diagnosis and treatment of adult astrocytic and oligodendroglial gliomas. Lancet Oncol 2017;18:e315–29. [DOI] [PubMed] [Google Scholar]
- [3].Segtnan EA, Hess S, Grupe P, et al. 18F-Fluorodeoxyglucose PET/computed tomography for primary brain tumors. PET Clin 2015;10:59–73. [DOI] [PubMed] [Google Scholar]
- [4].Wu W, Pirbhulal S, Zhang H, et al. Quantitative assessment for self-tracking of acute stress based on triangulation principle in a wearable sensor system. IEEE J Biomed Health 2018;DOI: 10.1109/JBHI.2018.2832069. [DOI] [PubMed] [Google Scholar]
- [5].Al-Okaili RN, Krejza J, Woo JH, et al. Intraaxial brain masses: MR imaging-based diagnostic strategy—initial experience. Radiology 2007;243:539–50. [DOI] [PubMed] [Google Scholar]
- [6].Huang Q, Nie B, Ma C, et al. Stereotaxic 18F-FDG PET and MRI templates with three-dimensional digital atlas for statistical parametric mapping analysis of tree shrew brain. J Neurosci Methods 2018;293:105–16. [DOI] [PubMed] [Google Scholar]
- [7].Vela JH, Wertz CI, Onstott KL, et al. Trauma imaging: a literature review. Radiol Technol 2017;88:263–76. [PubMed] [Google Scholar]
- [8].Bruns JJ, Jr, Jagoda AS. Mild traumatic brain injury. Mt Sinai J Med 2009;76:129–37. [DOI] [PubMed] [Google Scholar]
- [9].Zyluk A, Mazur A, Piotuch B. Analysis of the reliability of clinical examination in predicting traumatic cerebral lesions and skull fractures in patients with mild and moderate head trauma. Pol Przegl Chir 2013;85:699–705. [DOI] [PubMed] [Google Scholar]
- [10].Jagoda AS, Bazarian JJ, Bruns JJ, Jr, et al. Clinical policy: neuroimaging and decisionmaking in adult mild traumatic brain injury in the acute setting. J Emerg Nurs 2009;35:e5–40. [DOI] [PubMed] [Google Scholar]
- [11].Goldberg J, McClaine RJ, Cook B, et al. Use of a mild traumatic brain injury guideline to reduce inpatient hospital imaging and charges. J Pediatr Surg 2011;46:1777–83. [DOI] [PubMed] [Google Scholar]
- [12].Liu X, Gao Z, Xiong H, et al. Three-dimensional hemodynamics analysis of the circle of Willis in the patient-specific nonintegral arterial structures. Biomech Model Mechanobiol 2016;15:1439–56. [DOI] [PubMed] [Google Scholar]
- [13].Gao Z, Li Y, Sun Y, et al. Motion tracking of the carotid artery wall from ultrasound image sequences: a nonlinear state-space approach. IEEE Trans Med Imaging 2018;37:273–83. [DOI] [PubMed] [Google Scholar]
- [14].Zhao S, Gao Z, Zhang H, et al. Robust segmentation of intima-media borders with different morphologies and dynamics during the cardiac cycle. IEEE J Biomed Health 2017;DOI: 10.1109/JBHI.2017.2776246. [DOI] [PubMed] [Google Scholar]
- [15].Gao Z, Xiong H, Liu X, et al. Robust estimation of carotid artery wall motion using the elasticity-based state-space approach. Med Image Anal 2017;1–21. [DOI] [PubMed] [Google Scholar]
- [16].Keogh BP, Henson JW. Clinical manifestations and diagnostic imaging of brain tumors. Hematol Oncol Clin N Am 2012;26:733–55. [DOI] [PubMed] [Google Scholar]
- [17].Broder J, Warshauer DM. Increasing utilization of computed tomography in the adult emergency department. Emerg Radiol 2006;13:25–30. [DOI] [PubMed] [Google Scholar]
- [18].Song PJ, Lu QY, Li MY, et al. Comparison of effects of 18F-FDG PET-CT and MRI in identifying and grading gliomas. J Biol Regul Homeost Agents 2016;30:833–8. [PubMed] [Google Scholar]
- [19].Ma KL, Gao JH, Huang ZQ, et al. Motor function in MPTP-treated tree shrews (Tupaia belangeri chinensis). Neurochem Res 2013;38:1935–40. [DOI] [PubMed] [Google Scholar]
- [20].Keuker JI, Keijser JN, Nyakas C, et al. Aging is accompanied by a subfield-specific reduction of serotonergic fibers in the tree shrew hippocampal formation. J Chem Neuroanat 2005;30:221–9. [DOI] [PubMed] [Google Scholar]
- [21].Atabaki SM, Hoyle JD, Jr, Schunk JE, et al. Comparison of prediction rules and clinician suspicion for identifying children with clinically important brain injuries after blunt head trauma. Acad Emerg Med 2016;23:556–75. [DOI] [PubMed] [Google Scholar]
- [22].El-Serougy L, Abdel Razek AA, Ezzat A, et al. Assessment of diffusion tensor imaging metrics in differentiating low-grade from high-grade gliomas. Neuroradiol J 2016;29:400–7. [DOI] [PMC free article] [PubMed] [Google Scholar]
- [23].Razek AA, El-Serougy L, Abdelsalam M, et al. Differentiation of residual/recurrent gliomas from postradiation necrosis with arterial spin labeling and diffusion tensor magnetic resonance imaging-derived metrics. Neuroradiology 2018;60:169–77. [DOI] [PubMed] [Google Scholar]
- [24].Zhou Y, Wu T, Rastegarnia A, et al. On the robustness of EC-PC spike detection method for online neural recording. J Neurosci Methods 2014;235:316–30. [DOI] [PubMed] [Google Scholar]
- [25].Marner L, Henriksen OM, Lundemann M, et al. Clinical PET/MRI in neuro-oncology: opportunities and challenges from a single-institution perspective. Clin Transl Imaging 2017;5:135–49. [DOI] [PMC free article] [PubMed] [Google Scholar]
- [26].Kirschner S, Murle B, Felix M, et al. Imaging of orthotopic glioblastoma xenografts in mice using a clinical CT scanner: comparison with micro-CT and histology. PLoS One 2016;11:110165994. [DOI] [PMC free article] [PubMed] [Google Scholar]
- [27].Felix MC, Fleckenstein J, Kirschner S, et al. Image-guided radiotherapy using a modified industrial micro-CT for preclinical applications. PLoS One 2015;10: 0126246. [DOI] [PMC free article] [PubMed] [Google Scholar]
- [28].Esposito F, Mamone R, Serafino MD, et al. Diagnostic imaging features of necrotizing enterocolitis: a narrative review. Quant Imaging Med Surg 2017;7:336–44. [DOI] [PMC free article] [PubMed] [Google Scholar]
- [29].Tan YW, Zhou XB, Ye Y, et al. Diagnostic value of FIB-4, aspartate aminotransferase-to-platelet ratio index and liver stiffness measurement in hepatitis B virus-infected patients with persistently normal alanine aminotransferase. World J Gastroenterol 2017;23:5746–54. [DOI] [PMC free article] [PubMed] [Google Scholar]
- [30].Kirschner S, Felix MC, Hartmann L, et al. In vivo micro-CT imaging of untreated and irradiated orthotopic glioblastoma xenografts in mice: capabilities, limitations and a comparison with bioluminescence imaging. J Neurooncol 2015;122:245–54. [DOI] [PubMed] [Google Scholar]
- [31].Su P, Chang Y, Bai X, et al. Prevalence and association of mycoplasma infection in the development of coronary heart disease. Int J Clin Exp Pathol 2017;10:979–87. [Google Scholar]
- [32].Endharti AT, Wulandari A, Listyana A, et al. Dendrophthoe pentandra (L.) Miq extract effectively inhibits inflammation, proliferation and induces p53 expression on colitis-associated colon cancer. BMC Complem Altern M 2016;16. [DOI] [PMC free article] [PubMed] [Google Scholar]
- [33].Ladefoged CN, Law I, Anazodo U, et al. A multi-center evaluation of eleven clinically feasible brain PET/MRI attenuation correction techniques using a large cohort of patients. Neuroimage 2017;147:346–59. [DOI] [PMC free article] [PubMed] [Google Scholar]
- [34].Sun C, Pan Y, Wang H, et al. Assessment of the coronary venous system using 256-slice computed tomography. PLoS One 2014;9: 0104246. [DOI] [PMC free article] [PubMed] [Google Scholar]


