Abstract
Data regarding neonatal brain volumes represent a basis for monitoring early brain development, and large sample of neonatal brain volume data has not been well described. This study was focused on neonatal brain volumes at different postmenstrual ages (PMA) and postnatal age (PNA).
A cohort of 415 neonates with PMA 30 to 43+4 weeks were recruited for the determination of brain volumes. Intracranial cavity (ICC), total brain tissue (TBT), and cerebrospinal fluid (CSF) were evaluated on the basis of T1-weighted sagittal plane magnetic resonance images. Brain magnetic resonance imaging was assessed using maturation scoring system and multiple linear regression analysis was conducted to forecast the effect factors of brain volumes.
TBT volume reached a peak growth at 39 to 40 weeks, ICC volume presented peak growth later at around 43 to 44 weeks, and CSF had a cliff fallen at 37 to 38 weeks PMA at scan. The maturation score increased along with PMA, and the TBT and CSF volumes were significantly different between higher and lower gestational age (GA) groups. The ICC and TBT volumes in higher GA group were larger than lower GA group. Most infants in higher GA group had higher TMS than those in lower GA group. Gender, PMA, PNA, and birth weight were predictors of TBT and ICC volumes.
Our results showed that premature volumes of ICC and TBT enlarged with the increasing PMA, while volumes of CSF decreased at 37 weeks. Premature earlier to leave the uterus can lead to brain mature retard although they had the same GA compared with those later birth neonates.
Keywords: brain development, cerebrospinal fluid, intracranial cavity, MRI, neonate, postmenstrual age
1. Introduction
Cranial capacity is an indirect approach to evaluate the size of the brain.[1–3] Previous studies with limited samples have studied magnetic resonance imaging (MRI) of brain development in premature and term newborns.[4,5] Total brain tissue (TBT) volume accounts for 20% to 40% of the variance in cognitive and educational performance in extremely preterm adolescents as an important marker for neurodevelopmental deficits in preterm children.[6–8] Cross-sectional studies demonstrated that a linear increase of brain volume was observed between 25 and 40 weeks of gestation, with a difference in regional growth rates.[9] Total brain volume increases sharply, and the majority of sulcal and gyral formation takes place in the last 15 weeks of pregnancy.[10] Preterm undergoes a neonatal intensive care environment, in which it might possibly disturb their development.[11] Premature brain volumes at term-equivalent age (TEA) are influenced by various clinical factors, including brain injury, intrauterine growth retardation, chronic lung disease, and the use of corticosteriods.[12,13]
MRI is a noninvasive tool and provides high-resolution images of brain structures without ionizing radiation effects, and it has been used to assess brain volumes directly by means of tissue segmentation.[1,14] However, quantitative MRI examinations were not a practical option in routine clinical settings. Because of the small brain size and developing nature of the tissue, the quality of neonatal images is frequently poor with insufficient spatial resolution, low tissue contrast as a result of shorter scan times, and ambiguous tissue intensity,[15] which will hinder subsequent image processing such as image registration and tissue segmentation. Many studies have suffered from these problems.[16–18] The total brain volumes in newborns can be obtained from T1-weighted sagittal conventional MR images using the Cavalieri principle of stereologic method.[19,20]
The purposes of this study were to calculate the neonatal brain volumes, evaluate the neonatal brain's development, and predict the influencing factors of brain volumes, which will provide important data of neonatal brain volumes for long-term complications and future clinical interventions.
2. Material and methods
2.1. Patients
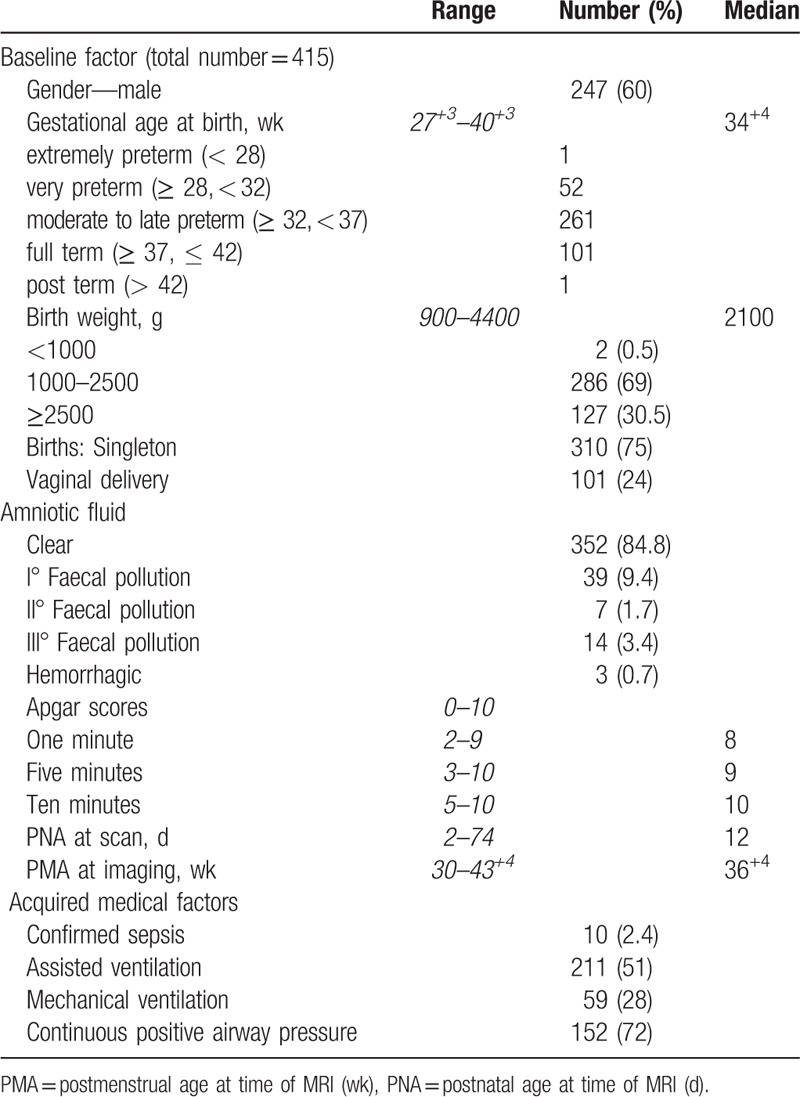
A cohort of 538 Chinese Han neonates from the Neonatal Intensive Care Unit (NICU) at Zhongnan Hospital of Wuhan University was recruited in this study, from October 2012 to November 2015. Ninety-four infants were excluded due to abnormality, cystic periventricular leukomalacia, hemorrhagic parenchymal infarction, pseudocysts, and chromosomal abnormalities. Twenty-seven neonates were further excluded due to anatomical ambiguity (Fig. 1). Four hundred fifteen neonatal brain images were finally included in this study, which were born at median gestational age (GA) of 34+4 (27+3–42+4) weeks. The newborn is categorized based on its GA into preterm, full term, and post-term.[21,22] Apgar scores were recorded at 1, 5, and 10 minutes after delivery.[23] The postmenstrual age (PMA) at imaging was calculated as the GA-at-birth plus the time elapsed since birth and the postnatal age (PNA) at scan was defined as the interval time between birth and scan.[24] The median PMA at imaging was 36+4 (30–43+4) weeks and PNA at scan 12 (2–74) days. The characteristics of the infants are presented in Table 1.
Figure 1.
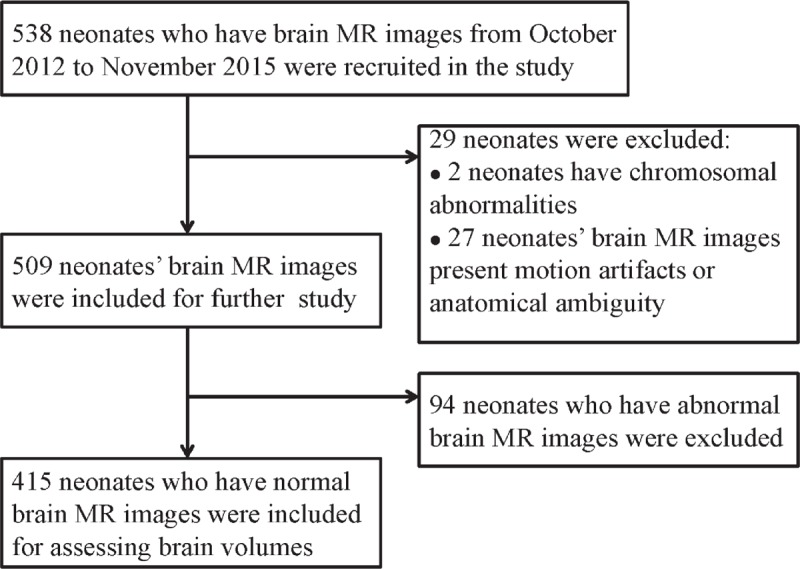
The flow chart of infants’ selection.
Table 1.
Characteristics of 415 neonates.
2.2. Ethics consent
This study was conducted after approval from the Zhongnan Hospital of Wuhan University Ethics Committee (clinical trial registration No. ChiCTR-ORC-16008872). All parents or guardians signed an informed consent form.
2.3. MRI data acquisition
For the MRI examination, infants were unsedated, sleeping naturally after a feed, and wrapped in blankets and a deflated vacuum pillow. Data were acquired using a Siemens Magnetom Trio a Tim 3.0 T scanner (Siemens Medical Systems, Erlangen, Germany) with the following parameters for the calculation of brain volumes. T1-weighted images acquisition parameters were: slice number = 19, slice thickness = 3 mm, gap distance factor 30% interleaved (space between slice = 3.9 mm), field of view (FOV) read/phase = 140 mm/100%, repetition time (TR) = 400 ms, echo time (TE) = 2.7 ms, flip angle = 80°. T2-weighted images -turbo spin-echo acquisition parameters were: slice = 20 thickness mm, gap distance factor 30% interleaved (space between slice = 3.9 mm); FOV read/phase = 140 mm/100%, slice thickness = 3 mm, space between slices = 3.9 mm; TR = 4360 ms, TE = 98 ms, flip angle = 120°.
2.4. Calculation of neonatal brain volumes
Brain volumes were evaluated on the basis of T1-weighted sagittal plane MRI using Cavalier principle.[19,25,26] The slices sectioned the brain as a series of parallel plane with a constant distance of T=3.9 mm. Then an unbiased estimation of brain volume V is obtained by multiplying the area of all sections by the slice interval  , in which “n” is the number of slices and “Ai” denotes the section area of the slice. The area of the section was calculated with the pixel number occupied by the brain in the slice.
Each MRI slice was first preprocessed by a series of morphological operation based on brain shapes, such as removing neck, nose, etc. Then a sequence of intensity-based morphological operation was used to remove skull, scalp, fat, and background noise.[27] Subsequently a histogram of intensity is constructed and modeled with a Gaussian mixture model to obtain the gray levels of total brain tissue and cerebrospinal fluid donated by ITBT and ICSF, then the threshold intensity is obtained by the average value, Ith = (ITBT + ICSF)/2.[28,29] This procedure is repeated for 3 slices closest to the center of brain to obtain the mean of the threshold. Thus the TBT and CSF volumes are calculated from the brain volume in each slice by using the mean threshold.
Image was processed in 3 steps. Loading original MR image (Fig. 2A). The original image was transferred to a matrix (256 ×256 pixels) with pixel spacing = [0.5469, 0.5469]. Extraction of brain (Fig. 2B). Distinguishing cerebral parenchyma and CSF (Fig. 2C and D). Using the mean threshold from histograms, the brain is segmented into 2 parts of CSF and TBT (Fig. 2E).
Figure 2.
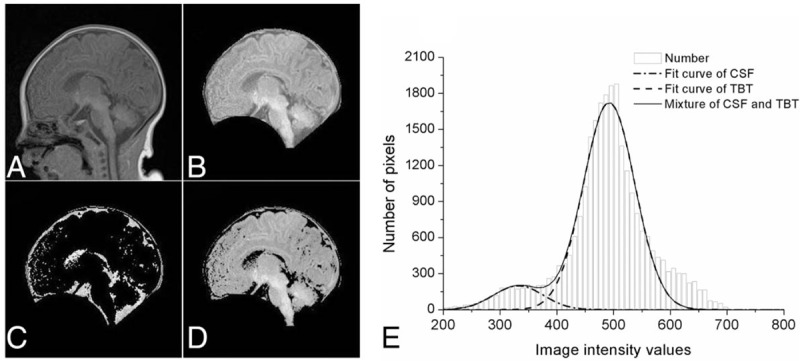
Image processing steps. A, Original T1-weighted brain MR image in sagittal plane. B, Edge of brain removing. C, Panorama of cerebrospinal fluid. D, Panorama of cerebral parenchyma. E, Gaussian mixture model for total brain tissue and cerebrospinal fluid.
2.5. Reliability
Reliability analyses were performed using 40 randomly chosen subjects, ranging from 30 to 43 weeks’ PMA. The intraclass correlation coefficient using a 2-way mixed effects model with absolute agreement on single measures was 0.970 (95% CI 0.771, 0.991; P < .001).
2.6. Maturation scoring system
According to the scoring system to assess cerebral maturation in preterm infants,[30] brain images were assessed using 4 parameters: levels of myelination (M), cortical infolding (C), germinal matrix (GM), and bands of migrating glial cells (B). Myelination leads to an increase in signal intensity on T1-weighted sequences and a decrease in signal intensity on T2-weighted sequences (scores 1–7 points with the appearance of myelination). The cortex is seen as having high signal intensity on T1-weighted images and low signal intensity on T2-weighted images (score 1–6 points with the depth of folding and sulci in frontal and occipital cortex). The germinal matrix shows high signal on T1-weighted images and low signal on T2-weighted images (score 1–4 points with the disappearance of germinal matrix). Bands of migrating glial cells present three bands of alternating signal intensity on T2-weighted sequences (score 1–4 points with the disappearance of migrating glial cells).
2.7. Growth model for neonatal brain
Gompertz functions are sigmoid functions often used to model growth, where growth is initially low, then accelerates to reach peak growth, and then decelerates to low growth again at the end.[31] Gompertz-like function was used to model the relation of brain volumes with age: f(t) = β1 + β2e−e−β3(t−β4), in which β1 is the initial value of f(t) and β1+β2 is the ending value of f(t). β3 and β4 are the parameters that adjust the growth rate and the t value is that f(t) reaches peak growth.[32]
2.8. Statistical analysis
Statistical analysis was performed by SPSS for Windows (version 20.0, IBM Corp, Armonk, NY). To investigate the differences in neonatal brain volume with different GA, 174 infants selected from 415 infants were divided into lower GA and higher GA groups, which have an equal-sized sample and equivalent PMA at scan. Each of group included 87 infants, ranged from 32+3 to 41 weeks PMA at scan. Every paired age at scan matched sample contained a relatively low GA infant and a relatively high GA infant. The lower GA group was defined as PNA < 14 days and the higher GA group was defined as PMA ≥ 14 days (PNA = PMA–GA, days). Independent samples t tests were used to determine the differences between the 2 groups. Multiple linear regression models were used to analyze the relation of perinatal factors and brain volumes. P < .05 was considerate significant difference.
3. Results
3.1. Brain volumes and growth rate of newborns
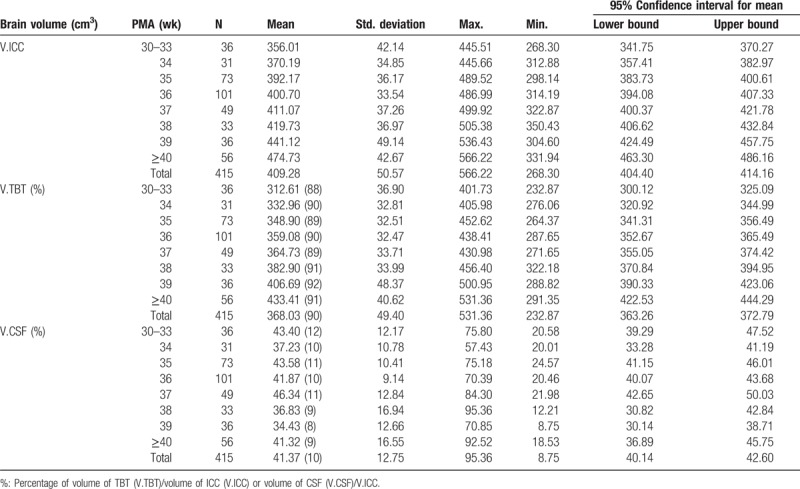
Table 2 shows intracranial cavity (ICC), TBT, and CSF volumes of 415 neonates aged from 30 to 43 weeks’ PMA. The proportion of volume of TBT to volume of ICC gradually increased, while the fluctuating range of ratio of volume of CSF to volume of ICC decreased from 12% to 10% at 33 to 37 weeks’ PMA and its proportion declined dramatically to 9% at 38 weeks’ PMA.
Table 2.
Descriptive statistics of neonatal brain volumes at different PMA.
The Gompertz function was used as the growth model of neonatal brain volumes with different PMA (Fig. 3A–C). Volumes of ICC and TBT enlarged with the increasing PMA, while CSF decreased with increasing PMA. The TBT volume reached a peak growth at around 39 to 40 weeks’ PMA (β4 = 39.8, adjusted R2 = 0.49), while the ICC volume present peak growth later at around 43 to 44weeks’ PMA (β4 = 43.5, adjusted R2 = 0.44). The CSF have a cliff fallen at around 37 to 38 weeks PMA at scan (β4 = 37.7, adjusted R2 = 0.04).
Figure 3.
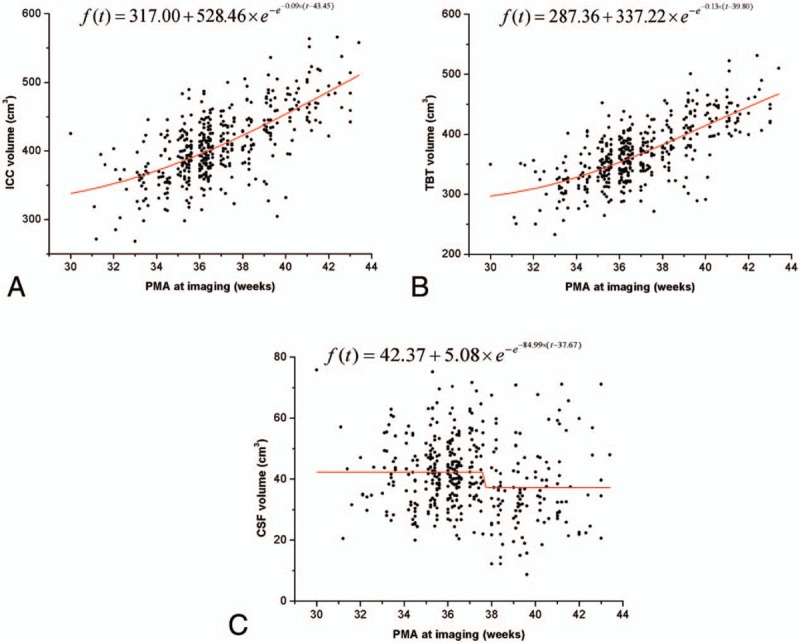
Neonatal brain volumes (ICC, TBT, and CSF) increased with PMA at imaging. The red line represents the fitting curve of the data.
3.2. Maturation determination of neonatal brain at different PMA
Figure 4A and B display a set of axial T1- and T2-weighted neonatal brain images aged from 31 to 43 weeks’ PMA. The maturation score (TMS) increased along with PMA. Myelination can be seen in the posterior limb of the internal capsule from 36 weeks’ PMA (M = 3 or 4) (Fig. 4A), and there was a dramatic increase in cortical folding, which transforms a relatively smooth surface at 41 weeks’ PMA at imaging to a highly folded structure by 43 weeks’ PMA (Fig. 4B). After 39 weeks’ PMA at imaging, the frontal and occipital cortex was more folded and rich in sulci and the insula are completely infolded (C = 5). The distribution of the germinal matrix is not evident after 40 weeks’ PMA (GM = 4). Similarly, bands of migrating glial cells tend to disappear after 39 weeks’ PMA at imaging (B = 4). Previous data have shown that the full TMS is 21 points (GM4, B4, M7, C6) and an infant of 52 weeks’ PMA can get full scores.[33] The TMS at 43 weeks’ PMA was 17 points, which illustrates that the neonatal brain will continue experiencing a long period of development to achieve complete maturation outside of the uterus.
Figure 4.
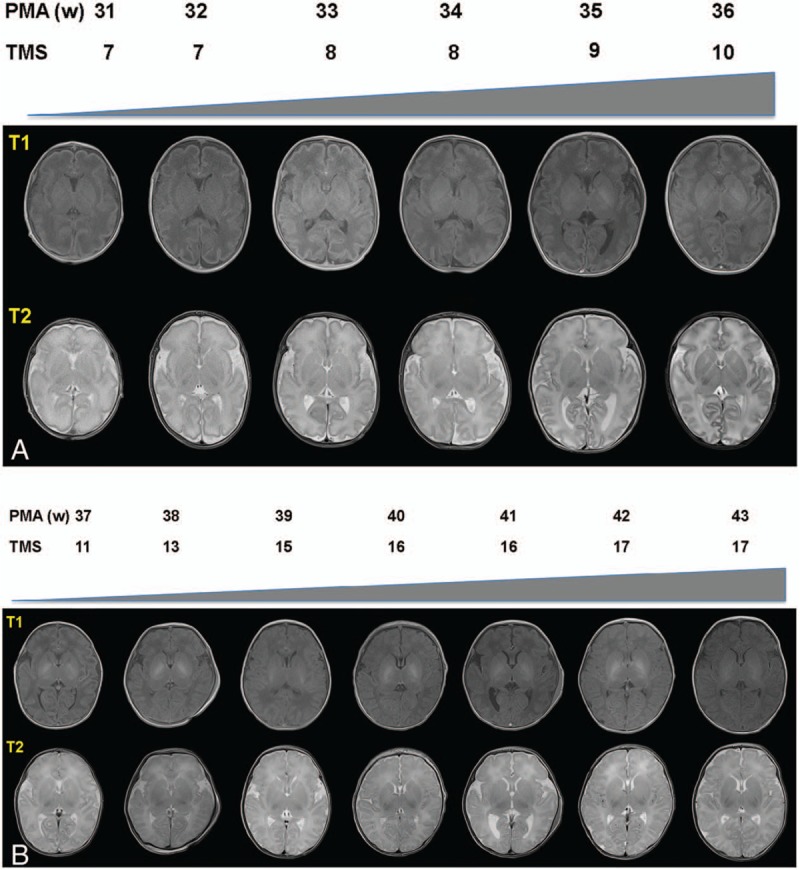
Neonatal brain MR images and total maturation scores with different PMA. A, It displayed T1 and T2-weighted transverse section images of 31 weeks’ to 36 weeks’ PMA. B, It displayed T1 and T2-weighted transverse section images of 37 weeks’ to 43 weeks’ PMA.
3.3. The impact of leaving uterus earlier on premature brain development
To evaluate the effect of different GA and PNA on the neonatal brain development, the growth rate and maturation scores between lower GA group and higher GA group were analyzed. There was no significant difference in ICC between the 2 groups, but significant differences in volume of TBT and CSF. Figure 5A to C shows the growth of brain volumes with increasing PMA for the 2 groups. The ICC and TBT volumes in higher GA group were larger than lower GA group at the equivalent PMA. This phenomenon was obvious between 33 weeks to 44 weeks’ PMA. The ICC and TBT volumes in lower GA group have a trend to catch up with higher GA group at 44 weeks’ PMA. However, the CSF volume in higher GA group dramatically fell at around 37 to 38 weeks’ PMA. And the CSF volume in lower GA group was not well fitted by the Gompertz function curve (adjusted R2 = −0.03).
Figure 5.
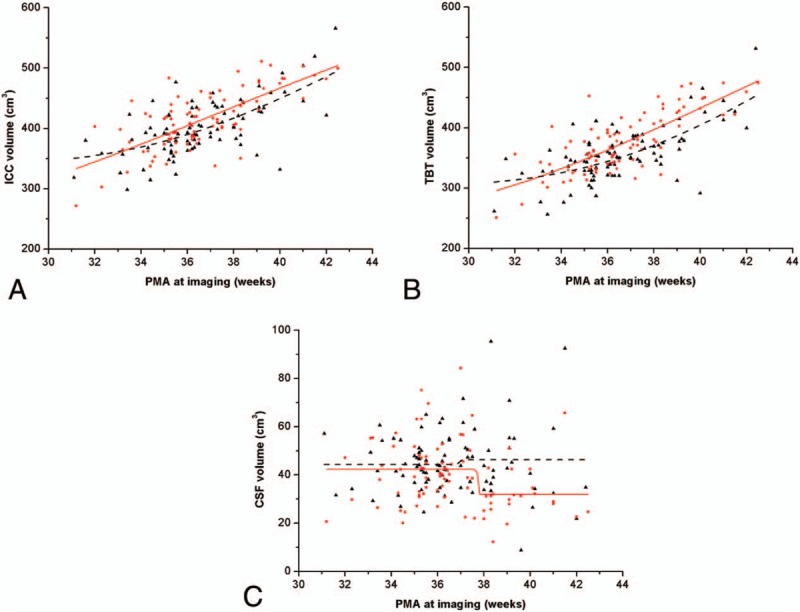
Comparison in brain volumes of lower GA and higher GA groups by Gompertz model. Red dots and solid line represented brain volume and fitting curve of higher GA group, respectively. Black triangle points and dash line represented brain volume and fitting curve of lower GA group, respectively. The fitting functions of ICC, TBT, and CSF for lower GA group were f(t) = 339.65 + 502.61 × e−e−0.10×(t−44.02), f(t) = 301.87 + 659.96 × e−e−0.10×(t−46.41) and f(t) = 44.28 + 1.95 × e−e−21.40×(t−36.91) respectively. The corresponding functions for higher GA group were f(t) = 220.99 + 555.39 × e−e−0.08×(t−37.33), f(t) = 235.87 + 588.71 × e−e−0.08×(t−41.10) and f(t) = 42.25 + 10.22 × e−e−75.97×(t−37.72).
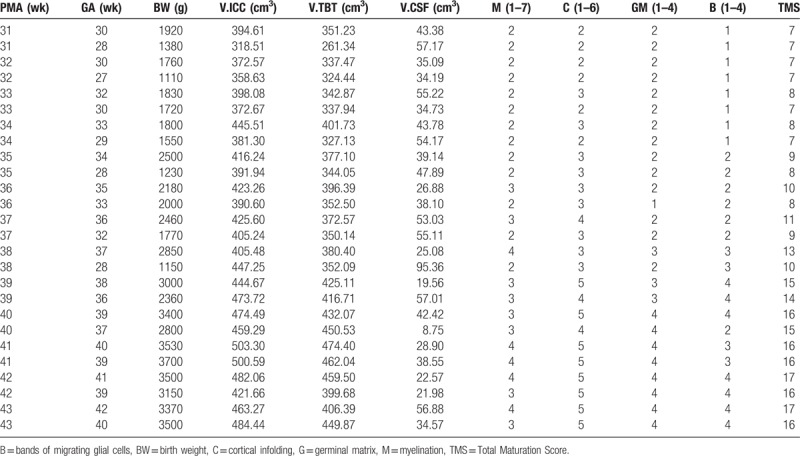
Thirteen pairs of infants were selected from the 87-paired age-matched infants at different PMA at scan. And their brain volumes and total maturation scores were displayed in Table 3. Most of the infants in higher GA group had higher TMS than those in lower GA group, with the exception of infants with 31, 32 weeks’ PMA. In these 4 subgroups, infants with higher GA had the same TMS as those with lower GA. These results imply that premature earlier to leave the uterus can lead to brain mature development retard although they had the same GA compared with those later birth neonates.
Table 3.
The total maturation score of lower and higher GA groups.
3.4. Perinatal factors and neonatal brain volumes
Multiple linear regression analysis was conducted using a stepwise procedure to forecast the factors that affect the brain volume. Regression models were set up for TBT, CSF, and ICC volumes, respectively. And independent variables included PNA, PMA, birth weight, births (singleton or multiple birth), gender, Apgar scores, pattern of assisted ventilation, and GA.
Results of multiple linear regression analysis are shown in Table 4. Gender, PMA, PNA, birth weight, and births were predictors of TBT and ICC volumes. However, PNA and pattern of assisted ventilation were predictors of CSF volume. This showed that the TBT and ICC volumes have a significant correlation of gender, birth weight, births, PNA, and PMA. These predictors have positive correlation of ICC and TBT volumes with the exception of gender. Gender was negatively correlated of ICC and TBT volumes, which indicated that the TBT and ICC volumes of male infants were larger than female infants. The primary predictor of ICC and TBT volumes was PMA (standardized coefficients β = 0.49 and 0.52, respectively). Birth weight was the second vital predictor of ICC and TBT volume (standardized coefficients β = 0.36 and 0.37). PNA was positively related with CSF volume. Pattern of assisted ventilation had significant correlation of CSF volume, which indicated that infants who acquired mechanical ventilation had larger CSF volume.
Table 4.
Predictors of brain volume of neonates.

4. Discussion
To our knowledge, no published, in vivo conventional MR imaging studies of China's Han newborns brain changes in the neonatal life span from premature to term neonates with large sample sizes exist. Brain volumes’ calculation and its growth rate's determination for neonates from 30 weeks to 43 weeks’ PMA would benefit to clinical evaluation and intervention for premature babies.
In the present study, we show that the TBT, and CSF volumes were smaller than those previous reports,[34] and larger in ICC volume than recent published data.[32] The discrepancy in neonatal brain volume may be the reason of different PMA distribution in cohort study sample, method of estimation brain volume, as well as the racial difference. Although real brain volume can be estimated by fluid displacement technique,[35] it showed the living brain volume was larger than that for the postmortem brain.[36] The inferred reason is that the postmortem brain might shrink during fixing, producing a different measurement from that in living brain. Some cohort studies have established the influence of preterm birth on brain tissue volumes [10,37] and its reductions appeared to be most prominent in more immature infants. It was demonstrated that brain tissue volumes of preterm infants at term were reduced primarily in cortical gray matter, subcortical gray matter, myelinated white matter, and cerebellum, with a corresponding increase in CSF compared with healthy term controls.[13] CSF volume will change with regional brain tissue alteration, and regional tissue volumes usually reduce in preterm infants; thus the CSF volume will increase reciprocally. In our study, the TBT volume reached a peak growth at around 39 to 40 weeks’ PMA, while the ICC volume presents peak growth later at 43 to 44 weeks’ PMA. The CSF volume has a cliff fallen at around 37 to 38 weeks PMA at scan. It has been reported that the brain, particularly the microstructure, grows rapidly at near-term age, the brain volumetric growth peaks at 35 weeks and the CSF present peak growth later at around 38 to 39 weeks.[32,38] The difference of findings may be accounted for different range of age.
To explore the influence of GA-at-birth, we compared brain volumes between lower GA and higher GA groups at the same PMA at scan. There was no significant difference in volume of ICC at the equivalent PMA at scan of the 2 groups, but significant differences in volume of TBT and CSF. The ICC and TBT volumes in higher GA group were larger than lower GA group at the equivalent PMA. This implies that GA as an internal impact of immaturity plays a role in brain development.[13] After 44 weeks’ PMA at scan, the ICC and TBT volumes in lower GA group have a trend to catch up with higher GA group in our study. Some brain regions in infants with lower GA may undergo an accelerated growth after birth and some treatments of neonates with lower GA may benefit regional development.[39] Until full-term-equivalent age, premature infants still have reduced cerebral volume, increased CSF volume compared with age-matched term controls.[13,32,40] Even without major central nervous system lesions, some premature infants still have smaller brains at TEA than do full-term controls.[41] And smaller brain volumes at TEA may not only be a direct consequence of prematurity itself, but also correlated with some postnatal complications, such as prolonged oxygen requirement.[42]
Myelination begins at 32 weeks’ PMA, emerges in the posterior limb of the internal capsule (PLIC) at 36 to 38 weeks’ PMA, and achieves full myelination by 46 weeks’ PMA.[43] At the beginning of 36 weeks’ PMA, infants born near term showed evidence of myelination in PLIC, while prematurely born infants did not show myelination in this region in our study. Comparing lower GA and higher GA groups, lower GA infants fell behind in TMS, even in the case of similar brain volumes. This demonstrated that premature left the mother earlier might delay the myelination development. Due to more volume of CSF, infants with lower GA have larger ICC and TBT volumes than those with higher GA at 38 and 39 weeks’ PMA. The infants with lower GA had lower TMS, but larger brain volumes than infants with higher GA at 38, 39, and 43 weeks’ PMA, which indicated that the degree of neonatal brain maturation is not always synchronized with the pace of growth of brain volumes.
Our data show that PMA and PNA rather than GA were positively associated with brain volumes. PNA and pattern of mechanical ventilation were 2 predictors of CSF volume. Intubation, as a basic step in mechanical ventilation, is associated with improper brain development in infants born preterm.[44,45] Furthermore, data suggest that ICC and TBT are larger in male infants than in female infants. It has been found that male infants have an approximately 12% greater ICC than female infants in a sample aged.[46] Premature male infants have greater cortical and white matter volumes, but identical cortical sulcation compared with premature female infants.[47] In preterm infants, there were differences in global and regional cortical sulcation indices between the sexes.[10] These differences between male and female preterm infants persist to the age of 5 years.[48] We acknowledge several limitations of the present study. First, the number of extremely preterm and very early preterm infants (≤30 weeks’ PMA) was few, and had only a Chinese population could be a limitation for the study. Second, considerable growth differences were observed in PMA at imaging because of different GA. This heterogeneity in neonates at different PMA at scan may lead to biases. Finally, deficiency of following up of brain MRI data may lead to an incomplete display of dynamic alteration of brain volumes.
In conclusion, our results showed premature volumes of ICC and TBT enlarged with the increasing PMA, while volumes of CSF decreased. Premature earlier to leave the uterus can lead to brain mature retard although they had the same GA compared to those later birth neonates.
Author contributions
Conceptualization: Dongchi Zhao.
Data curation: Dongchi Zhao, Shouyi Wang, Panpan Fan, Pu Yang, Junwen Zheng.
Formal analysis: Dongchi Zhao, Shouyi Wang, Pu Yang, Junwen Zheng.
Funding acquisition: Dongchi Zhao.
Investigation: Junwen Zheng.
Methodology: Shouyi Wang, Panpan Fan, Dezhi Xiong.
Software: Dezhi Xiong.
Writing – original draft: Dongchi Zhao, Shouyi Wang.
Writing – review & editing: Dongchi Zhao.
Footnotes
Abbreviations: CSF = cerebrospinal fluid, GA = gestational age, GM = germinal matrix, ICC = intracranial cavity, MRI = magnetic resonance imaging, NICU = neonatal intensive care unit, PMA = postmenstrual ages, PNA = postnatal age, TBT = total brain tissue, TEA = term-equivalent age.
This work is supported by National natural scientific fund of China (81170005 and 81670007).
This study was conducted after approval from the Zhongnan Hospital of Wuhan University Ethics Committee (Scientific Ethics 2015019. clinical trial registration No. ChiCTR-ORC-16008872).
Informed consent: All parents or guardians signed an informed consent form.
The authors have no conflicts of interest to disclose.
References
- [1].Ramenghi LA, Mosca F, Counsell S, et al. Magnetic resonance imaging of the brain in preterm infants, in Pediatric Neuroradiology, ed. P Tortori-Donati and A Rossi. Springer-Verlag Berlin Heidelberg Press; 2005:199–234. [Google Scholar]
- [2].Manjunath KY. Estimation of cranial volume: an overview of methodologies. J Anat Soc India 2002;51:85–91. [Google Scholar]
- [3].Acer N, Sahin B, Ekinci N, et al. Relation between intracranial volume and the surface area of the foramen magnum. J Craniofac Surg 2006;17:326–30. [DOI] [PubMed] [Google Scholar]
- [4].Manjunath KY. Estimation of cranial volume in dissecting room cadavers. J Anat Soc India 2002;51:168–72. [Google Scholar]
- [5].Hüppi PS, Warfield S, Kikinis R, et al. Quantitative magnetic resonance imaging of brain development in premature and mature newborns. Ann Neurol 1998;43:224. [DOI] [PubMed] [Google Scholar]
- [6].Cheong JL, Anderson PJ, Roberts G, et al. Contribution of brain size to IQ and educational underperformance in extremely preterm adolescents. PLoS One 2013;8:e77475. [DOI] [PMC free article] [PubMed] [Google Scholar]
- [7].Cheong JLY, Thompson DK, Spittle AJ, et al. Brain volumes at term-equivalent age are associated with 2-year neurodevelopment in moderate and late preterm children. J Pediatr 2016;174:91–7. [DOI] [PubMed] [Google Scholar]
- [8].Keunen K, Išgum I, van Kooij BJ, et al. Brain volumes at term-equivalent age in preterm infants: imaging biomarkers for neurodevelopmental outcome through early school age. J Pediatr 2016;172:88–95. [DOI] [PubMed] [Google Scholar]
- [9].Nishida M, Makris N, Kennedy DN, et al. Detailed semiautomated MRI based morphometry of the neonatal brain: preliminary results. Neuroimage 2006;32:1041–9. [DOI] [PubMed] [Google Scholar]
- [10].Dubois J, Benders M, Cachia A, et al. Mapping the early cortical folding process in the preterm newborn brain. Cereb Cortex 2008;18:1444. [DOI] [PubMed] [Google Scholar]
- [11].Volpe JJ. Brain injury in premature infants: a complex amalgam of destructive and developmental disturbances. Lancet Neurol 2009;8:110. [DOI] [PMC free article] [PubMed] [Google Scholar]
- [12].Keunen K, Kersbergen KJ, Groenendaal F, et al. Brain tissue volumes in preterm infants: prematurity, perinatal risk factors and neurodevelopmental outcome: a systematic review. J Matern Fetal Neonatal Med 2012;25(suppl 1):89–100. [DOI] [PubMed] [Google Scholar]
- [13].Thompson DK, Warfield SK, Carlin JB, et al. Perinatal risk factors altering regional brain structure in the preterm infant. Brain 2007;130:667–77. [DOI] [PubMed] [Google Scholar]
- [14].Kolk AGVD, Hendrikse J, Zwanenburg JJM, et al. Clinical applications of 7 T MRI in the brain. Eur J Radiol 2013;82:708–18. [DOI] [PubMed] [Google Scholar]
- [15].Yu X, Zhang Y, Lasky RE, et al. Comprehensive brain MRI segmentation in high risk preterm newborns. PLoS One 2012;5:e13874. [DOI] [PMC free article] [PubMed] [Google Scholar]
- [16].Prastawa M, Gilmore JH, Lin W, et al. Automatic segmentation of MR images of the developing newborn brain. Med Image Anal 2005;9:457–66. [DOI] [PubMed] [Google Scholar]
- [17].Xue H, Srinivasan LS, Rutherford M, et al. Automatic segmentation and reconstruction of the cortex from neonatal MRI. Neuroimage 2007;38:461–77. [DOI] [PubMed] [Google Scholar]
- [18].Kazemi K, Moghaddam HA, Grebe R, et al. A neonatal atlas template for spatial normalization of whole-brain magnetic resonance images of newborns: preliminary results. Neuroimage 2007;37:463–73. [DOI] [PubMed] [Google Scholar]
- [19].Ertekin T, Acer N, Icer S, et al. Estimation of the total brain volume using semi-automatic segmentation and stereology of the newborns’ brain MRI. Neuroquantology 2013;11:181–8. [Google Scholar]
- [20].Roberts N, Puddephat MJ, Mcnulty V. The benefit of stereology for quantitative radiology. Br J Radiol 2000;73:679–97. [DOI] [PubMed] [Google Scholar]
- [21].Premature infant, Medline Plus. 2017. Available at: http://www.nlm.nih.gov/medlineplus/ency/article/001562.htm. Accessed April 20, 2017. [Google Scholar]
- [22].Preterm birth, World Health Organization. 2017. Available at: http://www.who.int/mediacentre/fact sheets/fs363/en/. Accessed April 19, 2017. [Google Scholar]
- [23].Laptook AR. Neonatal and infant death: the apgar score reassessed. Lancet 2014;384:1727–8. [DOI] [PubMed] [Google Scholar]
- [24].Engle WA. Age terminology during the perinatal period. Pediatrics 2004;114:1362–4. [DOI] [PubMed] [Google Scholar]
- [25].Iwasaki N, Hamano K, Okada Y, et al. Volumetric quantification of brain development using MRI. Neuroradiology 1997;39:841–6. [DOI] [PubMed] [Google Scholar]
- [26].Nisari M, Ertekin T, Ozçelik O, et al. Stereological evaluation of the volume and volume fraction of newborns’ brain compartment and brain in magnetic resonance images. Surg Radiol Anat 2012;34:825–32. [DOI] [PubMed] [Google Scholar]
- [27].Brummer ME, Mersereau RM, Eisner RL, et al. Automatic detection of brain contours in MRI data sets. IEEE Trans Med Imaging 1993;12:153–66. [DOI] [PubMed] [Google Scholar]
- [28].Scott MLJ, Bromiley PA, Thacker NA, et al. A fast, model-independent method for cerebral cortical thickness estimation using MRI. Med Image Anal 2008;13:269–85. [DOI] [PubMed] [Google Scholar]
- [29].Despotovic I, Vansteenkiste E, Philips W. Brain volume segmentation in newborn infants using multi-modal MRI with a low inter-slice resolution. Int Conf Proc IEEE Eng Med Biol Soc 2010;2010:5038–41. [DOI] [PubMed] [Google Scholar]
- [30].Childs AM, Ramenghi LA, Cornette L, et al. Cerebral maturation in premature infants: quantitative assessment using MR imaging. AJNR Am J Neuroradiol 2001;22:1577–82. [PMC free article] [PubMed] [Google Scholar]
- [31].Wright R, Kyriakopoulou V, Ledig C, et al. Automatic quantification of normal cortical folding patterns from fetal brain MRI. NeuroImage 2014;91:21–32. [DOI] [PubMed] [Google Scholar]
- [32].Makropoulos A, Aljabar P, Wright R, et al. Regional growth and atlasing of the developing human brain. Neuroimage 2016;125:456–78. [DOI] [PMC free article] [PubMed] [Google Scholar]
- [33].Shah DK, Anderson PJ, Carlin JB, et al. Reduction in cerebellar volumes in preterm infants: relationship to white matter injury and neurodevelopment at two years of age. Pediatr Res 2006;60:97–102. [DOI] [PubMed] [Google Scholar]
- [34].Mewes AU, Zöllei L, Hüppi PS, et al. Displacement of brain regions in preterm infants with non-synostotic dolichocephaly investigated by MRI. NeuroImage 2007;36:1074–85. [DOI] [PMC free article] [PubMed] [Google Scholar]
- [35].Howard CV and Reed MG. Unbiased Stereology: Three Dimensional Measurement in Microscopy. 2nd ed. Oxford, UK: Liverpool Bios; 2005. [Google Scholar]
- [36].Levene MI, Whitelaw A, Dubowitz V, et al. Nuclear magnetic resonance imaging of the brain in children. Br Med J 1982;285:774–6. [DOI] [PMC free article] [PubMed] [Google Scholar]
- [37].Thompson DK, Wood SJ, Doyle LW, et al. MR-determined hippocampal asymmetry in full-term and preterm neonates. Hippocampus 2009;19:118–23. [DOI] [PMC free article] [PubMed] [Google Scholar]
- [38].Nossin-Manor R, Card D, Morris D, et al. Quantitative MRI in the very preterm brain: assessing tissue organization and myelination using magnetization transfer, diffusion tensor and T1 imaging. Neuroimage 2013;64:505–16. [DOI] [PubMed] [Google Scholar]
- [39].Rose J, Vassar R, Cahillrowley K, et al. Brain microstructural development at near-term age in very-low-birth-weight preterm infants: an atlas-based diffusion imaging study. Neuroimage 2014;86:244–56. [DOI] [PMC free article] [PubMed] [Google Scholar]
- [40].Ball G, Boardman JP, Rueckert D, et al. The effect of preterm birth on thalamic and cortical development. Cereb Cortex 2012;22:1016–24. [DOI] [PMC free article] [PubMed] [Google Scholar]
- [41].Nosarti C, Walshe M, Rushe TM, et al. Neonatal ultrasound results following very preterm birth predict adolescent behavioral and cognitive outcome. Dev Neuropsychol 2011;36:118–35. [DOI] [PubMed] [Google Scholar]
- [42].Kaukola T, Kapellou O, Laroche S, et al. Severity of perinatal illness and cerebral cortical growth in preterm infants. Acta Paediatr 2009;98:990–5. [DOI] [PubMed] [Google Scholar]
- [43].Cowan FM, de Vries LS. The internal capsule in neonatal imaging. Semin Fetal Neonatal Med 2005;10:461–74. [DOI] [PubMed] [Google Scholar]
- [44].Slater R, Fabrizi L, Worley A, et al. Premature infants display increased noxious-evoked neuronal activity in the brain compared to healthy age-matched term-born infants. Neuroimage 2010;52:583–9. [DOI] [PubMed] [Google Scholar]
- [45].Brummelte S, Grunau RE, Chau V, et al. Procedural pain and brain development in premature newborns. Ann Neurol 2012;71:385–96. [DOI] [PMC free article] [PubMed] [Google Scholar]
- [46].Whitwell JL, Crum WR, Watt HC, et al. Normalization of cerebral volumes by use of intracranial volume: implications for longitudinal quantitative MR imaging. AJNR Am J Neuroradiol 2001;22:1483–9. [PMC free article] [PubMed] [Google Scholar]
- [47].Vasileiadis GT, Thompson RT, Han VK, et al. Females follow a more “compact” early human brain development model than males. a case-control study of preterm neonates. Pediatr Res 2009;66:551–5. [DOI] [PubMed] [Google Scholar]
- [48].Rogers CE, Anderson PJ, Thompson DK, et al. Regional cerebral development at term relates to school-age social-emotional development in very preterm children. J Am Acad Child Adolesc Psychiatry 2012;51:181–91. [DOI] [PMC free article] [PubMed] [Google Scholar]


