Abstract
Neuromodulators and neurotransmitters play important roles in neural network development. The quantitative changes of these signaling molecules often reflect their regulatory roles in physiological processes. Currently, several commercial tags (e.g., iTRAQ and TMT) have been widely used in proteomics. With reduced cost and higher labeling efficiency, we employed a set of custom-developed N,N-dimethyl leucine (DiLeu) 4-plex isobaric tandem mass tags as an attractive alternative for the relative quantitation of neuropeptides in brain tissue of American lobster Homarus americanus at multiple developmental stages. A general workflow for isobaric labeling of neuropeptides followed by LC-MS/MS analysis has been developed, including optimized sample handling procedures. Overall, we were able to quantify 18 trace-amount neuropeptides from 6 different families using a single adult brain as a control. The quantitation results indicated that the expressions of different neuropeptide families had significant changes over distinct developmental stages. Additionally, our data revealed intriguing elevated expression of neuropeptides in the early juvenile development stage. The methodology presented here advanced the workflow of DiLeu as an alternative labeling approach and the application of DiLeu-based quantitative peptidomics, which can be extended to areas beyond neuroscience.
Keywords: N,N-Dimethyl leucine; quantitation; neuropeptides; crustacean development; ESI-QTOF
Graphical abstract
INTRODUCTION
Decapod crustaceans, including the American lobster Homarus americanus, serve as a classic model for neurobiology studies due to their simple and well-characterized neurological systems.1–3 The stomatogastric nervous system (STNS) and central nervous system (CNS) are two major neurological systems in the American lobster that contain several important neural organs. Many behaviors such as swallowing, chewing, circadian rhythms, and feeding are controlled by these two systems.4,5 In particular, the brain plays very important role in neuromodulation. For example, sensory input to the brain of decapod crustaceans is provided by compound eyes mediating vision or an array of specialized sensilla located at antennules mediating all other sensory modalities.6 The brain is also connected with the STNS by projection through the commissural ganglia (CoG) or directly into the stomatogastric ganglion (STG) to regulate the motor patterns in the stomach.7,8 Considering this critical location and interweaving nerve connections, the identification of signaling molecules in this highly complex neuronal structure needs to be addressed first, which could provide molecular clues on the relationship between certain neurotransmitters/hormones and behaviors.
However, the dynamic changes of these signaling molecules throughout development have not been well studied. Neurogenesis can occur at any time in any developmental stage.9 In H. americanus, it takes about 7 years and over 20 molts for a lobster to become an adult. During this process, chemosensory receptors are continuously added in the antennules, and the new sensory axons grow into the primary chemosensory processing areas in the brain.10 Another study showed that the brain size as well as deutocerebral organization changes as the development proceeds.11 Therefore, a developmental study would be important to elucidate the changes of neurotransmitters complements that are occurring in the brain, in particular neuropeptides, which are known to be heavily involved in proper development.12 This information can offer clues on the regulation of neuropeptides and other neurotransmitters on growth and development.
Initially, immunocytochemistry and physiological studies have been employed to characterize the complement and acquisition of neuropeptides and their receptors.8,13–20 A study performed on fruit fly Drosophila compared the neuropeptide complements and distributions in the CNS of larvae and adult and showed distinctions between these two developmental stages.13 There are also reports on the CNS of the crustacean and other arthropods that describe the immunochemical reactivity of some neuropeptides like FMRFamide.14–17 Specifically, in H. americanus, it has been shown that the synthesis of neuropeptides in the STNS of the American lobster occurs sequentially, and some neuropeptides are not present until larval stages.8,18–20 Researchers now ask about the global neuropeptidomic changes in the brain, specifically if they are the same at each stage of development. If they are the same, we can ask if several neuropeptide families show distinct abundance differences and finally if these abundances can be compared to the brain size at each developmental stage.
To answer the above quantitative questions, mass spectrometry (MS) has been commonly utilized. MS was proven to be a sensitive and accurate tool for characterizing neuropeptides and other neurotransmitters, especially in crustaceans.1,2,21,22 Many of the previous immunocytochemical results have been confirmed and expanded by MS since the latter can be more specific to neuropeptide isoforms.23–28 A combination of online liquid chromatography (LC) tandem MS (MS/MS) and matrix-assisted laser desorption/ionization (MALDI)-MS methodology has been utilized enabling hundreds of neuropeptides to be characterized from brain and other organs of adult American lobster, mainly due to the fast speed, high sensitivity, and other capabilities of MS technology.5,29
A common approach for relative quantitation is through mass-difference based labeling to measure relative peak areas of MS spectra.5,30–33 This approach detects peptide levels in two different samples by labeling the peptides with either light or heavy stable isotopes, mixing them equally, and analysis by MS. Nevertheless, this classically binary (2-plex) set of reagents suffers from the limitations of quantitation of only 2–3 samples at a time and the increase of complexity of the spectra, although several recent instrument developments have made multiplexing more accessible.34–37 With the advent of isobaric tags for relative and absolute quantitation (iTRAQ) and tandem mass tag (TMT) reagents, the comparisons of more than 2–3 samples could be done simultaneously at the MS/MS level.35,37 In this method, relative quantitation can be performed by comparing the intensities of reporter ions produced by collision-induced dissociation (CID), although this means quantitation can only be done on molecules selected for MS/MS. Our group has developed a custom isobaric tag set entitled N,N-dimethyl leucine (DiLeu), which allows for the comparison of up to 12 samples.34,38 This labeling approach produces low mass immonium a1 ions (m/z 115–118) at the MS/MS level and has proven to be comparable with iTRAQ for quantitation but with much lower experimental cost.34,38
Herein, we utilized 4-plex DiLeu as isobaric tags to optimize sample handling and reaction conditions for neuropeptidomic studies. The optimized methods (Scheme 1) were applied to four different developmental stages of the American lobster brains to compare the neuropeptide contents and abundances in brain tissues using electrospray ionization-quadrupole time-of-flight (ESI-QTOF) MS. This manuscript represents the first application of DiLeu reagents for large-scale crustacean neuro-peptide expression analysis, offering an alternative strategy for multiplexed quantitative peptidomics.
Scheme 1.
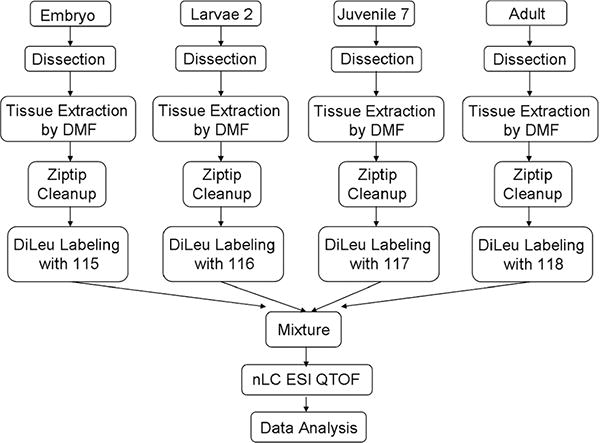
General Workflow Indicating the Major Steps Involved in Sample Preparation, Sample Processing, and Mass Spectrometric Analysis of the Lobster Brain Samples
RESULTS AND DISCUSSION
DiLeu Labeling as a Quantitative Methodology
The basic principles and synthesis of the DiLeu isobaric tagging reagent have been introduced elsewhere.34,38 Briefly, each tag contains a reporter, a balance, and amine reactive group. The final group is a triazine ester, which targets the N-terminus and exposed lysine groups of peptides (Supporting Information Scheme 1). Successful labeling results in a mass shift of 145.1 Da per amine group, which is the addition of the balance and reporter groups. As shown in Figure 1a and b, almost complete labeling with a DiLeu tag is observed for a standard peptide (m/z 1060.57 RPPGFSPFR). When four differentially labeled samples are combined and subjected to ESI-QTOF MS/MS analysis, distinctive fragmentation patterns can be easily obtained, including intense a1 ions (m/z 115.1, 116.1, 117.1, and 118.1) serving as quantitative reporters for the four distinct samples. The relative heights of these peaks correspond with the proportions of the labeled peptides in each sample, allowing relative quantitation between those four samples (Figure 1c and d).
Figure 1.
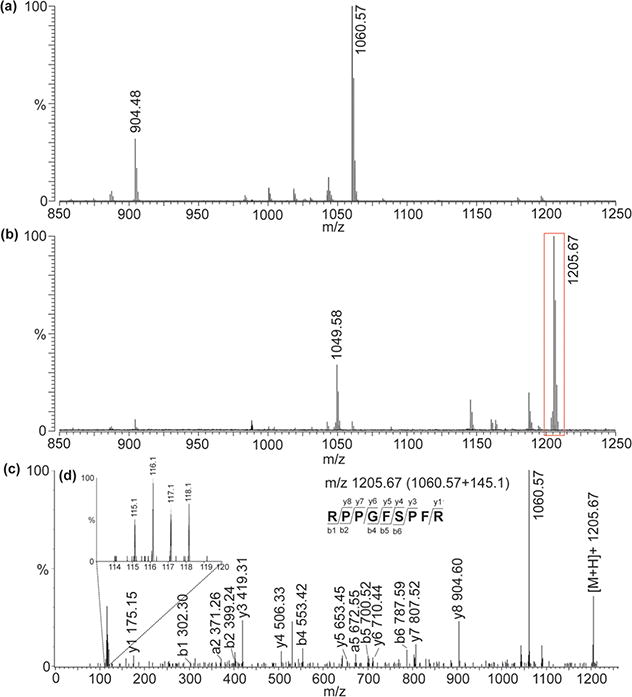
Spectral illustrations of the application of DiLeu isobaric tandem mass tags for quantitation. (a) Neuropeptide standard (m/z 1060.57 RPPGFSPFR) and degraded product (m/z 904.48) detected by MALDI-FTMS. (b) After DiLeu labeling, a mass shift of 145.1 Da is produced for each peak. (c) The labeled peak m/z 1205.67 could be selected for tandem MS on ESI-QTOF to generate sequence information. (d) The reporter ions ranging from 115.1 to 118.1 Da could represent the abundance of the peptides labeled.
Standard samples were tested to establish the robustness and reproducibility of DiLeu quantitation on neuropeptides for this study. Figure 2a shows the reporter ions for labeling four aliquots of a neuropeptide standard SGKWSNLRGAWamide (m/z 1260.66) that were mixed in equal amounts. Quantitative 1:1:1:1 confirms the reliability of DiLeu for neuropeptide study. A 10:5:2:1 mixing ratio was also investigated, proving that DiLeu is capable of accurate quantitation of neuropeptides of a wide dynamic range (Figure 2b).
Figure 2.
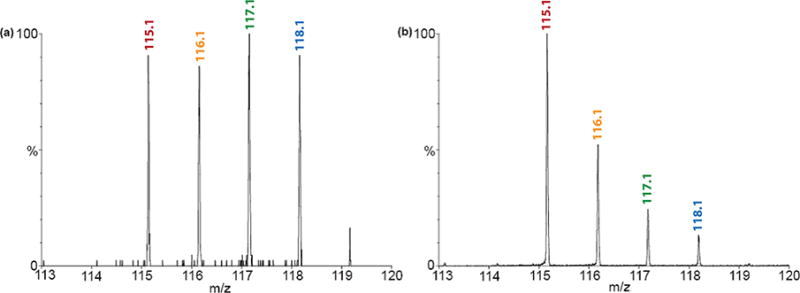
Validation of DiLeu labels for neuropeptidomic studies. Quantitation of reporter ions for (a) peptide standard SGKWSNLRGAWamide (m/z 1260.66) prepared at ratio 1:1:1:1 followed by DiLeu labeling and subjected to tandem MS fragmentation and (b) peptide standard RPKPQQFFGLMamide (m/z 1347.74) prepared at ratio 10:5:2:1 followed by DiLeu labeling and subjected to tandem MS.
General Workflow
The isobaric labeling workflow to analyze the protein/peptides in plasma and cells are well documented.35,37,39,40 However, to our knowledge, there is no literature detailing the isobaric labeling steps for neuropeptides. This is likely due to the fact that the detection of neuropeptides, which are inherently present in low abundance, is often masked by other highly concentrated molecules, including salts, lipids, and proteins, in complex tissue samples.41 It should be noted that a similarly structured tag, isotopic DiLeu (iDiLeu), has been used to label neuropeptides, although only clean, standard solutions were used.42 Here, in order to analyze developmental changes, a simple and reliable workflow was developed to analyze neuropeptides using DiLeu isobaric tagging strategies (Scheme 1). Briefly, animals of four developmental stages were dissected and the brains were pooled respectively for tissue extraction. The homogenate was centrifuged, and the supernatant for each stage was dried down. After reconstitution in aqueous 0.1% formic acid, a desalting step was needed before labeling reaction to allow efficient and reproducible coupling to the labeling reagents. The labeled samples were then combined and ready for LC separation and MS analysis.
As mentioned before, sample cleanup is necessary before labeling to improve the reaction efficiency. In order to improve this aspect of our study, we optimized the desalting process of C18 ZipTips from the manufacturer’s protocol and compared it to a magnetic beads clean up method. First, the dried down samples were reconstituted in maximum tip volume (10 μL) to reduce the chance of a possible blockage. Second, the reconstitution was followed by a short, high speed centrifugation to remove any lipids left which could also block the Ziptip. Finally, the volume of the elution step was increased 100 μL instead of ∼3 μL to ensure maximum peptide elution and recovery. Overall, the optimized Ziptip method out-performed the magnetic beads (Figure 3a–d) and improved the reproducibility (Figure 5). In a recent paper, Ziptips and magnetic beads were also compared for human serum peptide profiling, and it was determined that Ziptips were a better desalting method in spectral quality, reproducibility, and time consumption.43
Figure 3.
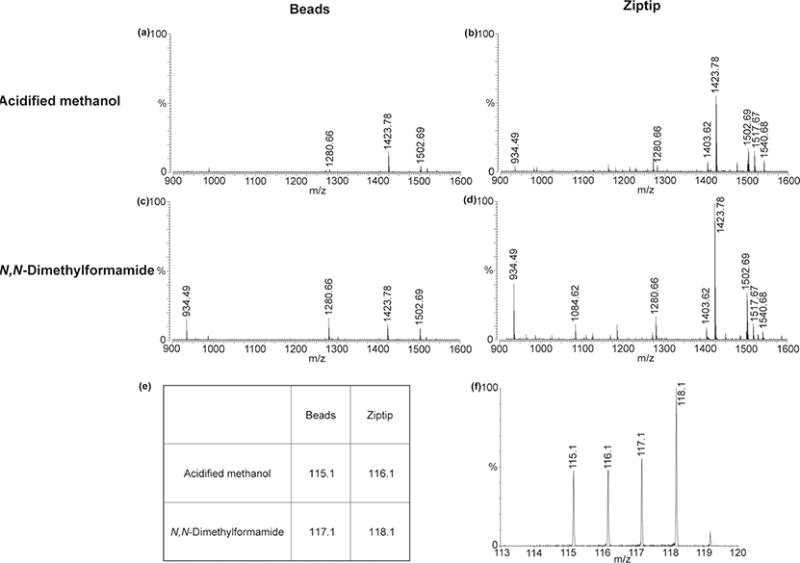
Comparison of two neuropeptide extraction methods followed by the two purification methods by MALDI-FTMS as well as by DiLeu. Four lobster brains of similar sizes are processed in the order of solvent extraction (acidified methanol or DMF) and desalting (Beads or Ziptip). Profiling of neuropeptides extracted by (a-b) acidified methanol and (c-d) DMF. The desalting methods are magnetic beads for (a) and (c) and Ziptip for (b) and (d), respectively. The above four spectra have been adjusted to the same intensity scale. (e) The cleaned samples were labeled by DiLeu as shown. (f) Quantitation of reporter ions for one peptide VYGPRDIANLY (m/z 1280.66) comparing the above four methods in combination.
Figure 5.
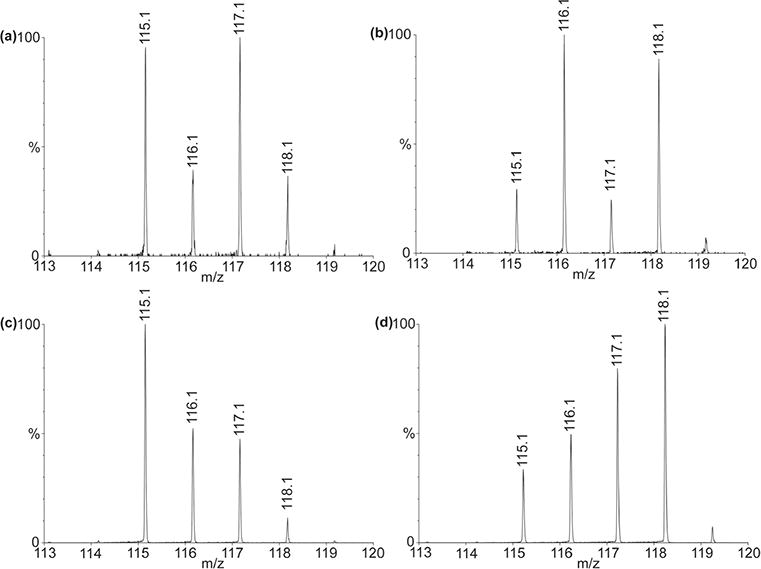
Quantitation of reporter ions for peptide (a, b) GDRNFLRFamide (m/z 1023.55) and (c, d) APSGFLGM(O)Ramide (m/z 950.49). Signature ions represent neuropeptide abundances in brains. In panels (a) and (c): m/z 115 for 1 adult brain; m/z 116 for 4 juvenile 7th brains; m/z 117 for 90 larvae 2nd brains; m/z 118 for 90 embryonic brains. Panels (b) and (d) are reversed labeling of panels (a) and (c), respectively. In panels (b) and (d): m/z 115 for 45 embryonic brains; m/z 116 for 45 larvae second brains; m/z 117 for 2 juvenile seventh brains; m/z 118 for 0.5 adult brain.
In label-free and isotopic labeling of neuropeptides, acidified methanol and other acidified organic solvents have been widely used in extracting neuropeptides.41 Nonetheless, caution needs to be given while using this solvent with DiLeu since the labeling reaction that follows extraction requires basic conditions.38 Previously dimethylformamide (DMF) has been utilized to extract neuropeptides before DiLeu labeling due to their compatibility.34,38,44 For this study, the extraction capability of acidified methanol (Figure 3a, b) and DMF (Figure 3c, d) was compared, and it was determined that DMF was better based on the number and intensity of the neuropeptide peaks, especially in conjunction with the optimized Ziptip desalting method.
To confirm our results, DiLeu tags were employed to label brain extracts obtained from the above extraction and purification methods to directly compare all the possible combinations. The labels corresponding to each of the conditions are shown in Figure 3e. Interestingly, the m/z 117.1 peak is higher than m/z 116.1 (Figure 3f), even though the spectral features (Figure 3c) corresponding to m/z 117.1 was lower. This further confirmed the compatibility of labeling with DMF over acidified methanol as an extraction solvent. Overall, m/z 118.1, corresponding to DMF extraction with Ziptip desalting, which was the preferred method individually, showed the highest intensity. The final workflow for DiLeu analysis of neuropeptide is shown in Scheme 1.
DiLeu Labeling of Multiple Developmental Stages of Lobster Brain for Relative Quantitation of Neuropeptides
It is known that neuropeptides are acquired sequentially in the STG of the lobster, with some neuropeptides not appearing until larval stages.20 It would be interesting to explore whether similar trends occur in the brain. To assess neuropeptide expression during development, animals of embryo, larvae, juvenile, and adult stages were utilized.
Tandem MS spectra of labeled peptide m/z 1084. 63 + 290.2 (HI/LASLYKPR) and FMRF peptide m/z 1337.69 + 145.1 (FSHDRNFLRFamide) are highlighted in Figure 4. Previously, DiLeu labeling was shown to improve MS/MS fragmentation in de novo sequencing, allowing us to obtain highly confident identifications even with low resolution instrumentation.38 In de novo sequencing of m/z 1084.63, we noticed there was a fragment mass matching lysine, suggesting two labels, 145.1*2, were added to the original peptide. Due to the isobaric masses of leucine and isoleucine, the exact amino acid for the second residue has not yet been confirmed. For peptide m/z 1337.69, it was determined to belong to the FMRFamide family. One common feature of this family is that there is an almost complete y ion series observed. This may be because of the presence of highly basic arginine residue at the C-terminus, which would suppress the formation of b ions. With the aid of DiLeu tags, reliable fragmentation patterns were obtained and used for high confidence neuropeptide identifications. Overall, there were 18 neuropeptides from 6 different families identified and quantified (Supporting Information Table 1). Low level of incomplete labeling was observed for SIFamide peptide VYRKPPFNGSI-Famide (m/z 1423.78) and HI/LASLYKPR (m/z 1084.62) in which lysine residue competed with N terminal residue for labeling. The overall labeling efficiency was ∼90% and only fully labeled peptide sequences were used for quantitation.
Figure 4.
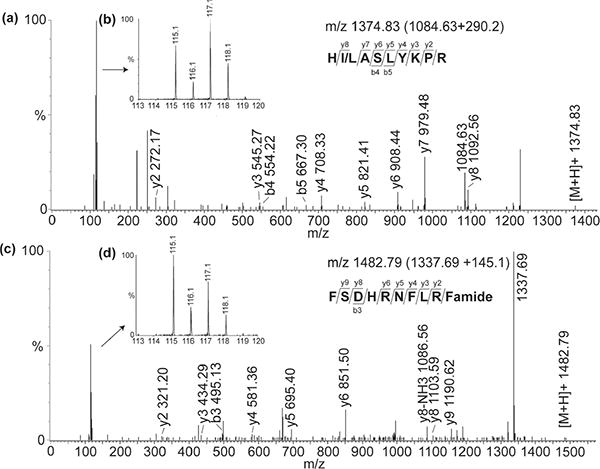
CID spectra of labeled neuropeptides from the brain of the lobster H. americanus by ESI-QTOF. (a) Peptide HI/LASLYKPR (m/z 1084.63 + 290.2) and (c) FMRFamide peptide FSDHRNFLRFamide (m/z 1337.69 + 145.1). All precursor ions are singly charged. Insets (b) and (d) show zoom-in regions highlighting the reporter ion regions that allow quantitation using signature ions representing neuropeptide abundances in four stages, with m/z115 labeled for adult brain; m/z 116 for 4 juvenile seventh brains; m/z 117 for 90 larvae second brains; and m/z 118 for 90 embryonic brains.
As representative data, Figure 5a and c illustrate the reporter ions of labeled FMRFamide peptide GDRNFLRFamide (m/z 1023.55) and tachykinin peptide APSGFLGM(O)Ramide (m/z 950.49), showing the significant abundance differences among multiple stages as well as distinctive patterns among the selected peptides. Reversed labeling experiments have also been performed in order to eliminate any bias generated by labeling procedure (Figure 5b and d). Considering the huge differences in tissue size among multiple developmental stages and possibly wide dynamic range in neuropeptide abundance, it should be noted that we use more animals in early stages for comparative analyses. The total neuropeptide abundances from pooled animals have been converted to neuropeptide abundance in each individual animal, and the ratio of peak intensity between animal of each stage to adult stage is shown in Figure 6 and detailed in Supporting Information Table 1.
Figure 6.
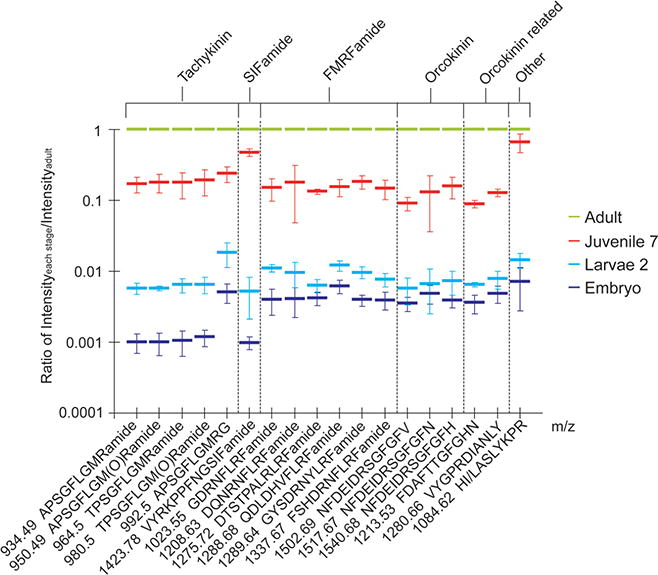
Neuropeptide quantitation using DiLeu labeling. The X-axis represents different neuropeptides (bottom bar) belonging to six families (top bar) listed by masses. The Y-axis illustrates the ratio of peptide amount of each stage divided by peptide amount of adult stage.
Several trends have been identified including: (1) Neuro-peptides are gradually acquired in the maturation process. All neuropeptides exhibit higher abundances as the lobster matures to later stages and the differences between developmental stages are significant (p value < 0.01, Figure 6 and Supporting Information Table 1). This is consistent with the continuous addition of receptors into the antennules11 and the increase in the number of neurons from previous immuno staining experiments.;13,45 (2) The abundances for different neuro-peptide families are distinct, with individual familial isoforms sharing similarities. This might suggest that the peptides in one family were expressed and processed simultaneously from the neuropeptide gene, and their release and actions also occur concurrently in the development and maturation of a neural network. However, two exceptions are noted, including tachykinin APSGFLGMRG (m/z 992.5) and RFamide QDL-DHVFLRFamide (m/z 1288.68). These two neuropeptides show higher abundances in embryonic and larvae 2 stages as compared to other neuropeptide family isoforms, although these differences are less obvious in juvenile stage. In general, neuropeptides originate from large, inactive preprohormones which undergo a series of enzymatic processing steps and proteolytic cleavages and modifications, with the last step being amidation at the C-terminus of glycine-ended sequences.46 If the glycine-ended form is converted to the amidated form as the development proceeds, that may contribute to the sharp increase in m/z 934.49 in later stages, which is the amidation product of m/z 992.5. Unfortunately, we were unable to quantify m/z 1271.68 due to detection limit of the instrument. (3) Different neuropeptide families exhibit distinct differences in abundances as a function of development. For example, tachykinin peptides exhibit about 1000-fold differences in abundance when transitioning from the embryonic stage to adult stage. Other peptides such as m/z 1084.63 display only about 100 times difference in relative abundance, even though the size difference of the lobster between these two stages is about 500 times. This might be due to the different roles of distinct neuropeptide families.
Validation of DiLeu Labeling and MS Peptidomics Data Using Previous Literature
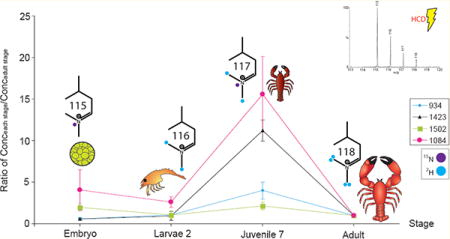
To better understand the relationship of neuropeptide amount with the brain, we further calculated the peptide concentration by considering the size of the brain. Notably, the neuropeptides are not evenly distributed in the brain.47,48 The conversion here is just an approximation to facilitate neurobiologists’ understanding of relationship of total neuropeptide abundance as a function of lobster developmental stage. The calculated results for four selected peptides are illustrated in Figure 7. It was noted that the neuropeptide concentrations of these four representative neuropeptides were consistently highest in the juvenile seventh stage. Previous studies that measured the area of olfactory lobe (OL) and accessory lobe (AL) indicated that, in early juvenile stage, the volume of olfactory OL and AL took up the largest portion of the brain (Supporting Information Figure S1).11 By comparing the trend observed in our study, which describes the concentration change of neuropeptides, to the one measuring the volume of chemosensory processing areas (OL and AL), we observed very similar pattern. This suggested that the OL and AL regions may contain neurons involved in the synthesis and release of neuropeptides. It has been known that increase in number and diameter of the neural processes account for the growth of OL and AL, and an increase in the bulk of cortical glial tissue might contribute to the increase in bulk of the brain.11 Therefore, at around seventh juvenile stages, more new sensory axons are projected into glomeruli, which may suggest that this period is a fast growing or function acquiring period. More in-depth investigation is needed to further explore this speculation.
Figure 7.
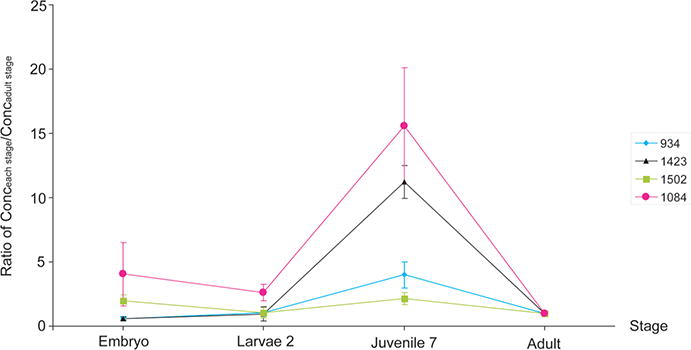
Trends of neuropeptide concentration changes of four individual peptides from different families. The X-axis illustrates multiple developmental stages. The Y-axis illustrates the ratio of peptide concentration of each stage divided by peptide concentration of adult stage. It is evident that, in juvenile seventh stage, neuropeptide concentrations are the highest.
Neuropeptide Trends over Development and Function
The trend for m/z 934.49 is shown in blue trace (Figure 7). Tachykinin related peptides (TRPs) are a family of neuropeptides which usually exist at high amounts in the adult lobster. The neuromodulation of tackykinin in the CNS may depend on the specific circuit and transmitters with tachykinin colocalized with TRPs.49,50 They are also involved in the modulation of photoreceptor sensitivity, olfactory sensory processing, and higher motor control.51,52 Our study shows that expression of this family is in very low concentration in the embryonic stage, but increases dramatically during the maturation process to the adult stage (Figure 6). Similarly, in a study of TRPs expression in different developmental stages of fruit fly Drosophila, the number of TRP-expressing neuronal cell bodies in the brain and ventral nerve cord increases during larval development and significantly increases after later pupal development to adult.45 In two other reports comparing the amplitude of neuropeptides in the STNS, the abundance of neuropeptides in this family showed significant increase from Larvae 1 to Juvenile 7 stages, which is consistent with our observation that tackykinin family was acquired quickly in the brain after the embryonic hatch.23,53 Further physiological experiments are needed to establish the precise role of this peptide family in development.
Val1-SIFamide also exhibits significant differential expression between early and later developmental stages. In contrast to tachykinin, the peak abundance of Val1-SIFamide of juvenile stage is close to that of an adult (Figure 6), indicating that this neuropeptide level changes dramatically between larvae and juvenile stage. This peptide has been identified in the STNS and the CNS of the American lobster with high abundance previously.27,29,54 In the STNS, the amplitude of this neuro-peptide family exhibits relatively stable expression levels throughout developmental stages, which differentiates the expression in the brain. It can activate several components of the pyloric motor pattern and the peptide exerts neuro-modulatory function on the STG via local release instead of hormonal regulation.54 The highly conserved sequences among several crustacean species and high abundance of this peptide suggest important function of this peptide.3 Previous studies have shown that SIFamide neuropeptides are involved in modulating sexual behavior, aggression, as well as visual, tactile, and olfactory stimuli.55 Mass spectral imaging data revealed that tachykinin and SIFamide were expressed in the OL and AL areas,10 which further confirms that the synthesis and release of neuropeptides might be related to OL and AL.
FMRFamide, orcokinin, and orcokinin related peptides are three large peptide families in the lobster brain. They can also be detected in many other organs of the American lobster.48 These three families display similar patterns in Figure 6, and the representative trend of orcokinin at m/z 1502.69 is shown in green trace in Figure 7. Previous reports indicated that FMRFamide and orcokinins appeared in the STNS as early as midembryonic stage (E50).8,56 A majority of the neuropeptides reported here can be found in the predicted preprohormones from a gene.29,57 In our study, we observed that neuropeptides in these three families share similar intensity patterns, and there was about a 250 times increase in the amount from embryonic to adult stage (Figure 6). The similar trends of individual isoforms within the same family might indicate that peptides are expressed and processed concurrently. The concentration calculation (described above) revealed a slight decrease from embryonic stage to larval second stage. This decrease might be caused by the morphological change in the brain, as we noticed that the expression of neuropeptides of these three families was concentrated on regions other than OL and AL (48 and unpublished data). However, consistent with other neuro-modulators, these peptides still exhibited the highest abundance in juvenile seventh stage (Figure 7).
The peptide at m/z 1084.63 is highly abundant in early stages but shows a remarkably lower abundance compared to other neuropeptides at later developmental stages (Figure 4). In this quantitative study (Figure 6), the intensity of this peptide in the juvenile stage is very similar to that of the adult, suggesting an early acquisition of this peptide during development. In Figure 7, this peptide exhibits its highest concentration in juvenile seventh stage. To our knowledge, there is no physiological study on this peptide yet, and it would be interesting to determine its potential relationship with development.
CONCLUSIONS
In summary, we demonstrated successful application of the recently developed DiLeu labeling tags to a neuropeptide quantitation study. The DiLeu labeling technique was optimized for neuropeptide detection in brain tissue, which lays the foundation for future application of this quantitative methodology for other tissues and other -omics studies. Relative quantitation of neuropeptides across multiple developmental stages was investigated to quantify 18 neuropeptides, showing that isoforms from the same family displayed similar trends of increase as lobster matures. A majority of neuropeptides displayed the highest concentration in juvenile seventh stage, suggesting potential important morphological and functional developments at this stage. Overall, our study systematically made use of the custom 4-plex DiLeu isobaric labeling technique for MS quantitation to study the neuropeptide changes during development, which will enable better characterization of the roles of neuropeptides play in maturation process.
METHODS
Animals and Dissection
Early stage lobsters were obtained from New England Aquarium (Boston, MA), and adult lobsters were ordered from Maine Lobster Direct Web site (https://www.mainelobsterdirect. com/). Ages of the lobster were estimated using an eye index scale for embryos58 or carapace length in the lobster growth chart for hatched animals. Embryos used in this study were in a stage of 85%–100% embryonic development (E85–E100). The dissection of lobsters was described previously.8,23,59 Four developmental stages were investigated, including adult, juvenile seventh, larvae second, and embryo.
Brain Size Measurement
In order to calculate the concentrations of neuropeptides across the whole brain, the sizes of brains of different developmental stages were measured under a microscope. The brains were assumed as cuboid for easy measurement and calculation for volume. Five animals of each stage were measured, and no significant differences were observed among individuals. The averaged values were compared with the previous studies on lobster brain volume as a function of developmental stage11 and the differences observed were less than 10%. Therefore, we used the averaged values from our measurements as brain sizes, which were 0.035 mm3 for the brain of embryo, 0.11 mm3 for larvae second stage, 0.85 mm3 for juvenile seventh stage, and 20 mm3 for adult.
Tissue Extraction
Lobster brains were dissected out from animals in chilled saline and then transferred to 20 μL of cold DMF. Brains at each stage (1 brain for adult, 4 for juvenile seventh, 90 for larvae second, and 90 for embryo in each replicate) were pooled after dissection and homogenized using 60 μL of DMF in a 0.1 mL tissue grinder (Wheaton Inc., Millville, NJ). The homogenate was transferred to 0.6 mL microtube and centrifuged at 16,100g for 10 min in an Eppendorf 5415 D microcentrifuge (Brinkmann Instruments Inc., Westbury, NY). The resulting supernatant was saved, and the pellet was re-extracted twice using the same method. Supernatants from three extractions were combined and then dried down in a Savant SC 110 SpeedVac concentrator (Thermo Electron Corporation, West Palm Beach, FL). Subsequently, the brain extract was resuspended in 10 μL of aqueous 0.1% formic acid (v/v) and then desalted by ZipTipC18 Pipette Tip (Millipore Corporation, Billerica, MA) or magnetic Dynabeads (Invitrogen, Carlsbad, CA). Tissue extractions and desalting were performed for three different replicates. In order to reduce errors generated by extraction, in the next two replicates experiment, we used different number of animals to compensate for differences in brain size at various developmental stages. We used 0.5 brain for adult, 2 for juvenile seventh, 45 for larvae second, and 45 for embryo extracts for pooling. The ratio of animals throughout development was kept the same for easy comparison.
Labeling of Peptide Standards and Neuropeptide Extracts
Four DiLeu labels were activated into their triazine ester form. Half a milligram of DiLeu in 25 μL of DMF was combined with 0.93 mg of DMTMM and 0.37 μL NMM. Mixing was performed at room temperature for 1 h and used immediately. The general labeling strategy is shown in Supporting Information Scheme 1. The standards or real samples were then labeled with 10 μL of one of the four DiLeu mass tags with the presence of 5 μL ethanol. Samples were then labeled at room temperature for 1.5 h and then quenched for 30 min by adding 100 μL of water. Quenched solutions were dried under Speedvac. Finally, the sample was resuspended in 20 μL of aqueous 0.1% formic acid (v/v).
MALDI-Fourier Transform-Ion Cyclotron Resonance (FT-ICR) MS
Varian/IonSpec FTMS (Lake Forest, CA) was equipped with a 7.0 T actively shielded superconducting magnet. The FTMS instrument consisted of an external high-pressure MALDI source. A 355 nm Nd:YAG laser (Laser Science, Franklin, MA) was used to create ions followed by accumulation in the external hexapole storage trap before being transferred through a quadrupole ion guide to the ICR cell. All data were collected in positive ion mode. The ions were excited prior to detection with a radio frequency sweep beginning at 7050 ms with a width of 4 ms and amplitude of 150 V base to peak. Detection was performed in broadband mode from m/z 108.00 to 2500.00.
Reversed Phase NanoLC-ESI-MS/MS
Labeled samples were combined and then analyzed using Waters nanoAcquity UPLC system online coupled to Waters Micromass QTOF mass spectrometer (Waters Corp., Milford, MA). An aliquot of 6 μL of solution was injected and trapped onto a C18 trap column (Zorbax 300SB-C18 Nano trapping column, Agilent Technologies, Santa Clara, CA) for 10 min, and eluted onto a homemade C18 column (75 μm × 150 mm, 3 μm, 100 Å) using a linear gradient (0.3 μL/min) from 5% buffer B [0.1% formic acid in acetonitrile (Fisher Scientific, Pittsburgh, PA)] to 50% buffer B over 60 min. Buffer A was 0.1% formic acid. The nanoflow ESI source conditions were set as follows: capillary voltage 3200 V, sample cone voltage 35 V, extraction cone voltage 15 V, source temperature 120 °C, and cone gas (N2) 10 l/h. MS survey scan range was from m/z 400–1800, and the MS/MS scan was from m/z 50–1800.
Data Analysis and Quantitation
The MS/MS de novo sequencing was performed by manual sequencing and automatic sequencing by Waters Masslynx peptide sequencing software (PepSeq) (Waters Corp., Milford, MA). DiLeu labeled neuropeptides were then identified with PepSeq N-terminal labeling, lysine labeling, C-terminal amidation, and methionine oxidation selected for modifications. The precursor error tolerance was set to be <100 ppm. Identified, labeled peptide spectra were quantified by comparing the intensities of the MS/MS reporter ions 115.1, 116.1, 117.1, and 118.1. Quantitative values were calculated by dividing each reporter ion peak height by the number of animals used for each stage followed by normalization to the abundance of adult brain. The experiments were performed in three biological replicates, and the mean and standard deviation were reported. One way ANOVA was used to determine the difference among four developmental stages. For concentration comparisons, the quantitative values obtained above were further divided by the sizes of brain of each stage.
Supplementary Material
Acknowledgments
The authors would like to thank Anita Metzler and Michael Tlusty from the Lobster Research and Rearing Facility at the New England Aquarium for providing the embryonic and juvenile lobsters. We thank Dr. Kristina Rehm from Eve Marder’s lab at Brandeis University for teaching the Li Lab lobster dissection. Massachusetts Division of Marine Fisheries is thanked for complementary shipment of juvenile lobsters.
Funding
This work was supported in part by the National Institutes of Health through grants 1R01DK071801 and P41GM108538, and the Wisconsin Alumni Research Foundation. A.R.B. would like to acknowledge an NIH General Medical Science NRSA Fellowship (F31GM119365) for funding support.
ABBREVIATIONS
- STNS
stomatogastric nervous system
- CNS
central nervous system
- CoG
commissural ganglia
- STG
stomatogastric ganglion
- MS
mass spectrometry
- MALDI
matrix-assisted laser desorption/ionization
- LC
liquid chromatography
- TMT
tandem mass tags
- iTRAQ
isobaric tag for relative and absolute quantitation
- CID
collision-induced dissociation
- DiLeu
N,N-dimethyl leucine
- MS/MS
tandem MS
- ESI
electrospray ionization
- QTOF
quadrupole time-of-flight
- DMF
dimethylformamide
- OL
olfactory lobe
- AL
accessory lobe
Footnotes
Supporting Information
The Supporting Information is available free of charge on the ACS Publications website at DOI: 10.1021/acschemneuro.7b00521.
Percentage of brain volume occupied by the OL and AL and the ratio of the OL’s and AL’s volumes at different developmental stage in Homarus americanus; morphology of the brain of freshwater crayfish; DiLeu structures and labeling reactions; summary of neuropeptide quantitation and statistical analysis results (PDF)
ORCID
Xiaoyue Jiang: 0000-0002-8939-8531
Lingjun Li: 0000-0003-0056-3869
Author Contributions
X.J. and L.L. designed the experiments. X.J., F.X., and C.J. performed experiments. X.J. analyzed the data. X.J., A.R.B., and L.L. wrote the manuscript.
Notes
The authors declare no competing financial interest.
References
- 1.Hui LM, Xiang F, Zhang YZ, Li LJ. Mass spectrometric elucidation of the neuropeptidome of a crustacean neuroendocrine organ. Peptides. 2012;36(2):230–239. doi: 10.1016/j.peptides.2012.05.007. [DOI] [PMC free article] [PubMed] [Google Scholar]
- 2.OuYang CZ, Liang ZD, Li LJ. Mass spectrometric analysis of spatio-temporal dynamics of crustacean neuropeptides. Biochim Biophys Acta, Proteins Proteomics. 2015;1854(7):798–811. doi: 10.1016/j.bbapap.2014.10.023. [DOI] [PMC free article] [PubMed] [Google Scholar]
- 3.Christie AE, Stemmler EA, Dickinson PS. Crustacean neuropeptides. Cell Mol Life Sci. 2010;67(24):4135–69. doi: 10.1007/s00018-010-0482-8. [DOI] [PMC free article] [PubMed] [Google Scholar]
- 4.Strauss J, Dircksen H. Circadian clocks in crustaceans: identified neuronal and cellular systems. Front Biosci, Landmark Ed. 2010;15:1040–1074. doi: 10.2741/3661. [DOI] [PubMed] [Google Scholar]
- 5.Chen RB, Hui LM, Cape SS, Wang JH, Li LJ. Comparative Neuropeptidomic Analysis of Food Intake via a Multi-faceted Mass Spectrometric Approach. ACS Chem Neurosci. 2010;1(3):204–214. doi: 10.1021/cn900028s. [DOI] [PMC free article] [PubMed] [Google Scholar]
- 6.Schmidt M. The olfactory pathway of decapod crustaceans-An invertebrate model for life-long neurogenesis. Chem Senses. 2007;32(4):365–384. doi: 10.1093/chemse/bjm008. [DOI] [PubMed] [Google Scholar]
- 7.Kirby MS, Nusbaum MP. Central nervous system projections to and from the commissural ganglion of the crab Cancer borealis. Cell Tissue Res. 2007;328(3):625–37. doi: 10.1007/s00441-007-0398-2. [DOI] [PubMed] [Google Scholar]
- 8.Li L, Pulver SR, Kelley WP, Thirumalai V, Sweedler JV, Marder E. Orcokinin peptides in developing and adult crustacean stomatogastric nervous systems and pericardial organs. J Comp Neurol. 2002;444(3):227–44. doi: 10.1002/cne.10139. [DOI] [PubMed] [Google Scholar]
- 9.Urban N, Guillemot F. Neurogenesis in the embryonic and adult brain: same regulators, different roles. Front Cell Neurosci. 2014;8:19. doi: 10.3389/fncel.2014.00396. [DOI] [PMC free article] [PubMed] [Google Scholar]
- 10.Helluy SM, Benton JL, Langworthy KA, Ruchhoeft ML, Beltz BS. Glomerular organization in developing olfactory and accessory lobes of American lobsters: stabilization of numbers and increase in size after metamorphosis. J Neurobiol. 1996;29(4):459–72. doi: 10.1002/(SICI)1097-4695(199604)29:4<459::AID-NEU4>3.0.CO;2-7. [DOI] [PubMed] [Google Scholar]
- 11.Helluy SM, Ruchhoeft ML, Beltz BS. Development of the olfactory and accessory lobes in the American lobster: an allometric analysis and its implications for the deutocerebral structure of decapods. J Comp Neurol. 1995;357(3):433–45. doi: 10.1002/cne.903570308. [DOI] [PubMed] [Google Scholar]
- 12.Cameron HA, Hazel TG, McKay RDG. Regulation of neurogenesis by growth factors and neurotransmitters. J Neurobiol. 1998;36(2):287–306. [PubMed] [Google Scholar]
- 13.Nassel DR, Winther AM. Drosophila neuropeptides in regulation of physiology and behavior. Prog Neurobiol. 2010;92(1):42–104. doi: 10.1016/j.pneurobio.2010.04.010. [DOI] [PubMed] [Google Scholar]
- 14.Sousa GL, Lenz PH, Hartline DK, Christie AE. Distribution of pigment dispersing hormone- and tachykinin-related peptides in the central nervous system of the copepod crustacean Calanus finmarchicus. Gen Comp Endocrinol. 2008;156(3):454–9. doi: 10.1016/j.ygcen.2008.03.008. [DOI] [PubMed] [Google Scholar]
- 15.Wilson CH, Christie AE. Distribution of C-type allatostatin (C-AST)-like immunoreactivity in the central nervous system of the copepod Calanus finmarchicus. Gen Comp Endocrinol. 2010;167(2):252–60. doi: 10.1016/j.ygcen.2010.03.012. [DOI] [PMC free article] [PubMed] [Google Scholar]
- 16.Schmidt M, Ache BW. Descending neurons with dopamine-like or with substance P/FMRFamide-like immunoreactivity target the somata of olfactory interneurons in the brain of the spiny lobster, Panulirus argus. Cell Tissue Res. 1994;278(2):337–52. doi: 10.1007/BF00414177. [DOI] [PubMed] [Google Scholar]
- 17.Nassel DR. Functional roles of neuropeptides in the insect central nervous system. Naturwissenschaften. 2000;87(10):439–49. doi: 10.1007/s001140050756. [DOI] [PubMed] [Google Scholar]
- 18.Pulver SR, Thirumalai V, Richards KS, Marder E. Dopamine and histamine in the developing stomatogastric system of the lobster Homarus americanus. J Comp Neurol. 2003;462(4):400–14. doi: 10.1002/cne.10767. [DOI] [PubMed] [Google Scholar]
- 19.Kilman V, Fenelon VS, Richards KS, Thirumalai V, Meyrand P, Marder E. Sequential developmental acquisition of cotransmitters in identified sensory neurons of the stomatogastric nervous system of the lobsters, Homarus americanus and Homarus gammarus. J Comp Neurol. 1999;408(3):318–34. doi: 10.1002/(sici)1096-9861(19990607)408:3<318::aid-cne2>3.0.co;2-s. [DOI] [PubMed] [Google Scholar]
- 20.Fenelon VS, Kilman V, Meyrand P, Marder E. Sequential developmental acquisition of neuromodulatory inputs to a central pattern-generating network. J Comp Neurol. 1999;408(3):335–51. doi: 10.1002/(sici)1096-9861(19990607)408:3<335::aid-cne3>3.0.co;2-w. [DOI] [PubMed] [Google Scholar]
- 21.Behrens HL, Chen RB, Li LJ. Combining microdialysis, nanoLC-MS, and MALDI-TOF/TOF to detect neuro-peptides secreted in the crab, Cancer borealis. Anal Chem. 2008;80(18):6949–6958. doi: 10.1021/ac800798h. [DOI] [PMC free article] [PubMed] [Google Scholar]
- 22.Jia CX, Hui LM, Cao WF, Lietz CB, Jiang XY, Chen RB, Catherman AD, Thomas PM, Ge Y, Kelleher NL, Li LJ. High-definition De Novo Sequencing of Crustacean Hyper-glycemic Hormone (CHH)-family Neuropeptides. Mol Cell Proteomics. 2012;11(12):1951–1964. doi: 10.1074/mcp.M112.020537. [DOI] [PMC free article] [PubMed] [Google Scholar]
- 23.Cape SS, Rehm KJ, Ma M, Marder E, Li L. Mass spectral comparison of the neuropeptide complement of the stomatogastric ganglion and brain in the adult and embryonic lobster, Homarus americanus. J Neurochem. 2008;105(3):690–702. doi: 10.1111/j.1471-4159.2007.05154.x. [DOI] [PubMed] [Google Scholar]
- 24.Christie AE, Cashman CR, Stevens JS, Smith CM, Beale KM, Stemmler EA, Greenwood SJ, Towle DW, Dickinson PS. Identification and cardiotropic actions of brain/gut-derived tachykinin-related peptides (TRPs) from the American lobster Homarus americanus. Peptides. 2008;29(11):1909–18. doi: 10.1016/j.peptides.2008.07.010. [DOI] [PubMed] [Google Scholar]
- 25.Bulau P, Meisen I, Schmitz T, Keller R, Peter-Katalinic J. Identification of neuropeptides from the sinus gland of the crayfish Orconectes limosus using nanoscale on-line liquid chromatography tandem mass spectrometry. Mol Cell Proteomics. 2004;3(6):558–64. doi: 10.1074/mcp.M300076-MCP200. [DOI] [PubMed] [Google Scholar]
- 26.Christie AE, Lundquist CT, Nassel DR, Nusbaum MP. Two novel tachykinin-related peptides from the nervous system of the crab Cancer borealis. J Exp Biol. 1997;200(Pt 17):2279–94. doi: 10.1242/jeb.200.17.2279. [DOI] [PubMed] [Google Scholar]
- 27.Christie AE, Stemmler EA, Peguero B, Messinger DI, Provencher HL, Scheerlinck P, Hsu YWA, Guiney ME, de la Iglesia HO, Dickinson PS. Identification, physiological actions, and distribution of VYRKPPFNGSIFamide (Val(1)-SIFamide) in the stomatogastric nervous system of the American lobster Homarus americanus. J Comp Neurol. 2006;496(3):406–421. doi: 10.1002/cne.20932. [DOI] [PubMed] [Google Scholar]
- 28.Li L, Kelley WP, Billimoria CP, Christie AE, Pulver SR, Sweedler JV, Marder E. Mass spectrometric investigation of the neuropeptide complement and release in the pericardial organs of the crab, Cancer borealis. J Neurochem. 2003;87(3):642–56. doi: 10.1046/j.1471-4159.2003.02031.x. [DOI] [PubMed] [Google Scholar]
- 29.Ma M, Chen R, Sousa GL, Bors EK, Kwiatkowski MA, Goiney CC, Goy MF, Christie AE, Li L. Mass spectral characterization of peptide transmitters/hormones in the nervous system and neuroendocrine organs of the American lobster Homarus americanus. Gen Comp Endocrinol. 2008;156(2):395–409. doi: 10.1016/j.ygcen.2008.01.009. [DOI] [PMC free article] [PubMed] [Google Scholar]
- 30.Gygi SP, Rist B, Gerber SA, Turecek F, Gelb MH, Aebersold R. Quantitative analysis of complex protein mixtures using isotope-coded affinity tags. Nat Biotechnol. 1999;17(10):994–9. doi: 10.1038/13690. [DOI] [PubMed] [Google Scholar]
- 31.Chen RB, Xiao MM, Buchberger A, Li LJ. Quantitative Neuropeptidomics Study of the Effects of Temperature Change in the Crab Cancer borealis. J Proteome Res. 2014;13(12):5767–5776. doi: 10.1021/pr500742q. [DOI] [PMC free article] [PubMed] [Google Scholar]
- 32.Wang JH, Zhang YZ, Xiang F, Zhang ZC, Li LJ. Combining capillary electrophoresis matrix-assisted laser desorption/ionization mass spectrometry and stable isotopic labeling techniques for comparative crustacean peptidomics. Journal of Chromatography A. 2010;1217(26):4463–4470. doi: 10.1016/j.chroma.2010.02.084. [DOI] [PMC free article] [PubMed] [Google Scholar]
- 33.Boersema PJ, Aye TT, van Veen TAB, Heck AJR, Mohammed S. Triplex protein quantification based on stable isotope labeling by peptide dimethylation applied to cell and tissue lysates. Proteomics. 2008;8(22):4624–4632. doi: 10.1002/pmic.200800297. [DOI] [PubMed] [Google Scholar]
- 34.Frost DC, Greer T, Li L. High-Resolution Enabled 12-Plex DiLeu Isobaric Tags for Quantitative Proteomics. Anal Chem. 2015;87(3):1646–54. doi: 10.1021/ac503276z. [DOI] [PMC free article] [PubMed] [Google Scholar]
- 35.Ross PL, Huang YLN, Marchese JN, Williamson B, Parker K, Hattan S, Khainovski N, Pillai S, Dey S, Daniels S, Purkayastha S, Juhasz P, Martin S, Bartlet-Jones M, He F, Jacobson A, Pappin DJ. Multiplexed protein quantitation in Saccharomyces cerevisiae using amine-reactive isobaric tagging reagents. Mol Cell Proteomics. 2004;3(12):1154–1169. doi: 10.1074/mcp.M400129-MCP200. [DOI] [PubMed] [Google Scholar]
- 36.Hebert AS, Merrill AE, Stefely JA, Bailey DJ, Wenger CD, Westphall MS, Pagliarini DJ, Coon JJ. Amine-reactive Neutron-encoded Labels for Highly Plexed Proteomic Quantitation. Mol Cell Proteomics. 2013;12(11):3360–3369. doi: 10.1074/mcp.M113.032011. [DOI] [PMC free article] [PubMed] [Google Scholar]
- 37.Choe L, D’Ascenzo M, Relkin NR, Pappin D, Ross P, Williamson B, Guertin S, Pribil P, Lee KH. 8-plex quantitation of changes in cerebrospinal fluid protein expression in subjects undergoing intravenous immunoglobulin treatment for Alzheimer’s disease. Proteomics. 2007;7(20):3651–60. doi: 10.1002/pmic.200700316. [DOI] [PMC free article] [PubMed] [Google Scholar]
- 38.Xiang F, Ye H, Chen R, Fu Q, Li L. N,N-dimethyl leucines as novel isobaric tandem mass tags for quantitative proteomics and peptidomics. Anal Chem. 2010;82(7):2817–25. doi: 10.1021/ac902778d. [DOI] [PMC free article] [PubMed] [Google Scholar]
- 39.Greer T, Hao L, Nechyporenko A, Lee S, Vezina CM, Ricke WA, Marker PC, Bjorling DE, Bushman W, Li LJ. Custom 4-Plex DiLeu Isobaric Labels Enable Relative Quantification of Urinary Proteins in Men with Lower Urinary Tract Symptoms (LUTS) PLoS One. 2015;10(8):e0135415. doi: 10.1371/journal.pone.0135415. [DOI] [PMC free article] [PubMed] [Google Scholar]
- 40.Yu Q, Shi XD, Greer T, Lietz CB, Kent KC, Li LJ. Evaluation and Application of Dimethylated Amino Acids as Isobaric Tags for Quantitative Proteomics of the TGF-beta/Smad3 Signaling Pathway. J Proteome Res. 2016;15(9):3420–3431. doi: 10.1021/acs.jproteome.6b00641. [DOI] [PMC free article] [PubMed] [Google Scholar]
- 41.Buchberger A, Yu Q, Li L. Advances in Mass Spectrometric Tools for Probing Neuropeptides. Annu Rev Anal Chem. 2015;8(1):485–509. doi: 10.1146/annurev-anchem-071114-040210. [DOI] [PMC free article] [PubMed] [Google Scholar]
- 42.Greer T, Lietz CB, Xiang F, Li LJ. Novel isotopic N,N-Dimethyl Leucine (iDiLeu) Reagents Enable Absolute Quantification of Peptides and Proteins Using a Standard Curve Approach. J Am Soc Mass Spectrom. 2015;26(1):107–119. doi: 10.1007/s13361-014-1012-y. [DOI] [PMC free article] [PubMed] [Google Scholar]
- 43.Timms JF, Cramer R, Camuzeaux S, Tiss A, Smith C, Burford B, Nouretdinov I, Devetyarov D, Gentry-Maharaj A, Ford J, Luo Z, Gammerman A, Menon U, Jacobs I. Peptides generated ex vivo from serum proteins by tumor-specific exopeptidases are not useful biomarkers in ovarian cancer. Clin Chem. 2010;56(2):262–71. doi: 10.1373/clinchem.2009.133363. [DOI] [PubMed] [Google Scholar]
- 44.Sturm RM, Greer T, Woodards N, Gemperline E, Li LJ. Mass Spectrometric Evaluation of Neuropeptidomic Profiles upon Heat Stabilization Treatment of Neuroendocrine Tissues in Crustaceans. J Proteome Res. 2013;12(2):743–752. doi: 10.1021/pr300805f. [DOI] [PMC free article] [PubMed] [Google Scholar]
- 45.Winther AM, Siviter RJ, Isaac RE, Predel R, Nassel DR. Neuronal expression of tachykinin-related peptides and gene transcript during postembryonic development of Drosophila. J Comp Neurol. 2003;464(2):180–96. doi: 10.1002/cne.10790. [DOI] [PubMed] [Google Scholar]
- 46.Fricker LD, Lim J, Pan H, Che FY. Peptidomics: identification and quantification of endogenous peptides in neuro-endocrine tissues. Mass Spectrom Rev. 2006;25(2):327–44. doi: 10.1002/mas.20079. [DOI] [PubMed] [Google Scholar]
- 47.Chen R, Hui L, Sturm RM, Li L. Three dimensional mapping of neuropeptides and lipids in crustacean brain by mass spectral imaging. J Am Soc Mass Spectrom. 2009;20(6):1068–77. doi: 10.1016/j.jasms.2009.01.017. [DOI] [PMC free article] [PubMed] [Google Scholar]
- 48.Chen R, Jiang X, Prieto Conaway MC, Mohtashemi I, Hui L, Viner R, Li L. Mass spectral analysis of neuropeptide expression and distribution in the nervous system of the lobster Homarus americanus. J Proteome Res. 2010;9(2):818–32. doi: 10.1021/pr900736t. [DOI] [PMC free article] [PubMed] [Google Scholar]
- 49.Satake H, Kawada T, Nomoto K, Minakata H. Insight into tachykinin-related peptides, their receptors, and inverte-brate tachykinins: a review. Zool Sci. 2003;20(5):533–49. doi: 10.2108/zsj.20.533. [DOI] [PubMed] [Google Scholar]
- 50.Nassel DR. Tachykinin-related peptides in invertebrates: a review. Peptides. 1999;20(1):141–158. doi: 10.1016/s0196-9781(98)00142-9. [DOI] [PubMed] [Google Scholar]
- 51.Glantz RM, Miller CS, Nassel DR. Tachykinin-related peptide and GABA-mediated presynaptic inhibition of crayfish photoreceptors. J Neurosci. 2000;20(5):1780–90. doi: 10.1523/JNEUROSCI.20-05-01780.2000. [DOI] [PMC free article] [PubMed] [Google Scholar]
- 52.Nässel DR, Lundquist CT, Muren JE, Winther ÅE. An insect peptide family in search of functions: the tachykinin related peptides. In: Coast GM, Webster SG, editors. Recent advances in arthropod endocrinology. Cambridge University Press; Cambridge, NJ: 1998. p. 248. [Google Scholar]
- 53.Jiang X, Chen R, Wang J, Metzler A, Tlusty M, Li L. Mass spectral charting of neuropeptidomic expression in the stomatogastric ganglion at multiple developmental stages of the lobster Homarus americanus. ACS Chem Neurosci. 2012;3(6):439–50. doi: 10.1021/cn200107v. [DOI] [PMC free article] [PubMed] [Google Scholar]
- 54.Rehm KJ, Deeg KE, Marder E. Developmental regulation of neuromodulator function in the stomatogastric ganglion of the lobster, Homarus americanus. J Neurosci. 2008;28(39):9828–39. doi: 10.1523/JNEUROSCI.2328-08.2008. [DOI] [PMC free article] [PubMed] [Google Scholar]
- 55.Vazquez-Acevedo N, Rivera NM, Torres-Gonzalez AM, Rullan-Matheu Y, Ruiz-Rodriguez EA, Sosa MA. GYRKPPFNGSIFamide (Gly-SIFamide) modulates aggression in the freshwater prawn Macrobrachium rosenbergii. Biol Bull. 2009;217(3):313–26. doi: 10.1086/BBLv217n3p313. [DOI] [PMC free article] [PubMed] [Google Scholar]
- 56.Zajac JM, Mollereau C. RFamide peptides. Introduction Peptides. 2006;27(5):941–2. doi: 10.1016/j.peptides.2005.12.005. [DOI] [PubMed] [Google Scholar]
- 57.Dickinson PS, Stemmler EA, Barton EE, Cashman CR, Gardner NP, Rus S, Brennan HR, McClintock TS, Christie AE. Molecular, mass spectral, and physiological analyses of orcokinins and orcokinin precursor-related peptides in the lobster Homarus americanus and the crayfish Procambarus clarkii. Peptides. 2009;30(2):297–317. doi: 10.1016/j.peptides.2008.10.009. [DOI] [PMC free article] [PubMed] [Google Scholar]
- 58.Helluy SM, Beltz BS. Embryonic-Development of the American Lobster (Homarus americanus) – Quantitative Staging and Characterization of an Embryonic Molt Cycle. Biol Bull. 1991;180(3):355–371. doi: 10.2307/1542337. [DOI] [PubMed] [Google Scholar]
- 59.Thirumalai V, Marder E. Colocalized neuropeptides activate a central pattern generator by acting on different circuit targets. J Neurosci. 2002;22(5):1874–82. doi: 10.1523/JNEUROSCI.22-05-01874.2002. [DOI] [PMC free article] [PubMed] [Google Scholar]
Associated Data
This section collects any data citations, data availability statements, or supplementary materials included in this article.


