

Abstract
We have examined the dynamics of positional gene expression in mouse liver using the carbohydrate induction of lipogenic genes as a model. Using a protocol of fasting and refeeding a highcarbohydrate, no-fat diet to obtain maximal induction, we investigated the temporal expression and localization of malic enzyme (ME) and fatty acid synthase (FAS). In situ hybridization showed that both ME and FAS were expressed at low basal levels in all hepatocytes in livers of mice fed a control diet. Furthermore, dietary induction of ME and FAS mRNA occurred in periportal cells within 6 hours. After 12 hours, the portal cells were maximal; and after 24–36 hours, all cells showed high levels of message. This was coincident with expression of ME and FAS mRNAs, which appeared to be maximal between 24 and 36 hours. Both steady-state mRNA levels and pericentral localization then declined, until only periportal hepatocytes showed strong expression of ME and FAS. Nuclear transcription rates measured by run-on assay demonstrated that maximal transcription rates preceded maximum mRNA levels by peaking at 12 hours. Furthermore, run-on assays showed that the periportal induction by carbohydrates is primarily a transcriptional response for FAS, and both transcriptional and posttranscriptional for ME. These results indicate that lipogenic gene expression is a temporal response induced by carbohydrate feeding and is regulated by both positional and transcriptional mechanisms.
The major lipogenic enzymes—malic enzyme (ME) and glucose-6-phosphate dehydrogenase (G6PDH), the donors of the NADPH required for de novo fatty acid synthesis, as well as fatty acid synthase (FAS)—are regulated by nutritional conditions (Morikawa et al., 1984; Laux and Schweizer, 1990; Ma et al., 1990). Induction of these lipogenic enzymes by carbohydrates is controlled by varying concentrations of mRNA (Paulauskis and Sul, 1988; Tomlinson et al., 1988; Prostko et al., 1989; Laux and Schweizer, 1990; Ma et al., 1990). Regulation of ME mRNA levels has both transcriptional and posttranscriptional components, while FAS has been shown to be regulated at the level of transcription (Laux and Schweizer, 1990; Fukada and Iritani, 1992). In mammals, for example, high-carbohydrate, fat-free diets are thought to elevate ME mRNA by a posttranscriptional mechanism (Dozin et al., 1986). However, several studies have shown that dietary fatty acids down regulate both mRNA levels and transcription rates of lipogenic genes and that, in particular, polyunsaturated fatty acids are responsible for this down regulation (Nace et al., 1979; Salati et al., 1988; Tomlinson et al., 1988; Blake and Clarke, 1990; Clarke and Hembree, 1990; Wilson et al., 1990). Thyroid hormone (T3), a major modulator of metabolism, transcriptionally stimulates both ME and FAS (Dozin et al., 1986; Clarke and Hembree, 1990; Stapleton et al., 1990; Salati et al., 1991). Interestingly, the down regulation of FAS by fats is dominant over the induction by T3 (Clarke and Hembree, 1990).
Several metabolic processes carried out by the liver have been shown to be distributed in a heterogeneous pattern within the liver lobule, such that enzymes of a particular metabolic system are grouped together. This compartmentalization of enzymatic activity in different domains of the liver, called metabolic zonation, is thought to be an effective means of preventing futile cycles and regulating metabolic homeostasis. For example, the important enzymes of gluconeogenesis, glucose-6-phosphatase and phosphoenolpyruvate, are localized in the hepatocytes surrounding the portal vein/hepatic artery or periportal region (Katz et al., 1977; Fischer et al., 1982; Teutsch, 1988; McGrane et al., 1990). Conversely, the key enzymes of glycolysis are localized in the hepatocytes surrounding the central vein or pericentral region (Fischer et al., 1982; Zierz et al., 1983; Pilkis et al., 1988).
Regulation of nitrogen homeostasis is another example of metabolic zonation. Carbamoyl phosphate synthetase, the rate-limiting enzyme in the urea cycle that converts blood ammonia to urea, is localized exclusively in periportal hepatocytes (Moorman et al., 1988; Lamers et al., 1989). Conversely, glutamine synthase, the enzyme that converts ammonia to glutamine, is found only in pericentral hepatocytes (Bennett et al., 1987; Janzen et al., 1987; Gebhardt et al., 1988; Kuo et al., 1988; Lamers et al., 1989).
Thus, the localization of these specific metabolic systems within the liver acinus appears to depend on the proximity of hepatocytes to either a portal vein/hepatic artery or a central vein. Although it is known that the liver is the major site of lipogenesis in mammals and birds, the specific region within this heterogenous organ where lipogenesis occurs has not been fully elucidated. Fat metabolism is probably regulated like other metabolic systems, by restriction to specific compartments or hepatocytes in the liver.
To define the dynamics of metabolic pathways within the liver acinus, we studied nutritional regulation of lipogenic gene expression. We analyzed the in vivo temporal regulation of lipogenic gene zonation patterns in mouse liver and their response to carbohydrates using in situ hybridization. In this study, we report that the lipogenic genes, ME and FAS, are expressed in all hepatocytes at low levels in livers of mice fed a control diet. We also show that the effect of fasting, then refeeding a high-carbohydrate, no-fat diet induced both ME and FAS expression in periportal hepatocytes, but even more importantly, that expression occurred in all hepatocytes at the peak of carbohydrate induction. This is the first time such a temporal response has been reported for lipogenic gene expression. Furthermore, based on mRNA levels and transcription rate analysis, we show that the regulation for this position-specific effect is mostly at the transcriptional level.
Materials and methods
Animals and diets
Young adult (approximately 12-week-old) male CD-I mice were randomly divided into three groups: (1) mice fed a control diet; (2) those fed a control diet and fasted for 24 hours (0 hours refed); and (3) those fed a control diet, fasted, then refed a high-carbohydrate, low-fat diet for 6, 12, 24, 36, 48, or 72 hours, or for 8 days. The carbohydrate-feeding protocol is a modification of that used in experiments previously published by Dozin et al. (1986). Water was available ad libitum. All groups were maintained on the control diet for at least 7 days prior to the onset of the experiment. Mice were sacrificed at the timepoints stated above. Livers were either perfused, removed for RNA isolation, or used for preparation of nuclei.
The diets were modifications of the 1977 AIN-76A diet (American Institute of Nutrition, 1977). The control and high-carbohydrate, no-fat diets were isocaloric. Composition of the control diet was as follows: casein, 200 g/kg; DL-methionine, 3 g/kg; cornstarch, 145 g/kg; sucrose, 484 g/kg; cellulose, 70 g/kg; safflower oil, 50 g/kg; AIN salt mix, 35 g/kg; AIN vitamin mix, 10 g/kg; choline bitartrate, 2 g/kg. The composition of the high-carbohydrate, no-fat diet was modified from the control diet as follows: cornstarch, 173 g/kg; sucrose, 577 g/kg; safflower oil, 0 g/kg; and cellulose, 0 g/kg.
RNA analysis
Total RNA was prepared from tissue using a guanidinium thiocyanate and β-mercaptoethanol extraction (Sambrook et al., 1989), and poly(A)+ mRNA was prepared using the Polytract System 1000 (Promega). After isolation, mRNA purity was assessed by spectrophotometric measurement at 260/280 nm, and its integrity was assessed by electrophoresis in an agarose gel.
Isolated poly(A)+ RNA was applied to nitrocellulose niters using a Schliecher & Schuell slot-blot apparatus (2 μg per slot) as previously described (Powell et al., 1984) in order to analyze steady-state RNA levels. Prehybridization, hybridization, and washing conditions were as previously described (Kuo et al., 1988; Sambrook et al., 1989). Mouse cDNA clones for ME and FAS were used to make the 32P-labeled probes for hybridization (Sambrook et al., 1989). A mouse cDNA probe for actin (D. Grayson and J. E. Darnell, Jr., unpublished results) was used as a control, since it did not vary with dietary alterations. The nitrocellulose filters were washed, autoradiographed, and quantitated using a Molecular Dynamics Phosphorimager.
Nuclear run-on transcription assay
Nuclei were isolated from liver tissue, and 32P-labeled nuclear RNA was prepared as described by Powell et al. (1984). In vitro elongated, nuclear RNA was hybridized to cDNA that was prefixed on nitrocellulose filters with a slot filter apparatus. After washing and RNase treatment, filters were autoradiographed. cDNA for ME and FAS was used on the filters, as were a control for invariant transcription rate (mouse actin), tissue-specific controls (C/EBPα, albumin), and a negative control (pBR 322). Quantitation was determined with a Molecular Dynamics Phosphorimager. The mouse cDNA for actin was used to standardize data, since it did not vary with dietary alterations. The rates of transcription were presented as a fold change relative to mice fed the control diet.
In situ hybridization
Liver tissue was prepared for cryostat sectioning by perfusion with 4% paraformaldehyde, followed by immersion overnight in 4% paraformaldehyde. Tissues were cryoprotected by immersion in 30% sucrose overnight, as described previously (Kuo et al., 1988; Paulson et al., 1990). Sections (7 μm) were prepared on a cryostat and hybridized with 35S-labeled anti-sense RNA probes for ME and FAS, as described previously (Kuo et al., 1988; Paulson et al., 1990). Tissue sections were also hybridized with a negative control, the sense strand of ME and FAS. The sections were then washed and immersed briefly in Kodak NTB-2 emulsion. Slides were exposed, developed, and stained with standard hematoxylin-eosin stain. Sections were examined by bright- and dark-field microscopy.
Results
Positional and temporal expression of ME and FAS mRNA analyzed by in situ hybridization
We investigated the metabolic zonation pattern of lipogenic genes by determining the distribution of ME and FAS mRNA in mouse liver in response to carbohydrate induction. Anti-sense probes to ME and FAS were used to carry out in situ hybridization on fixed liver sections from mice that had been fed a control diet or fasted and refed a high-carbohydrate, no-fat diet for different lengths of time in order to stimulate lipogenesis. As a control for background hybridization, liver tissue sections were also hybridized with a sense probe for both ME and FAS (Fig. 1).
Figure 1.
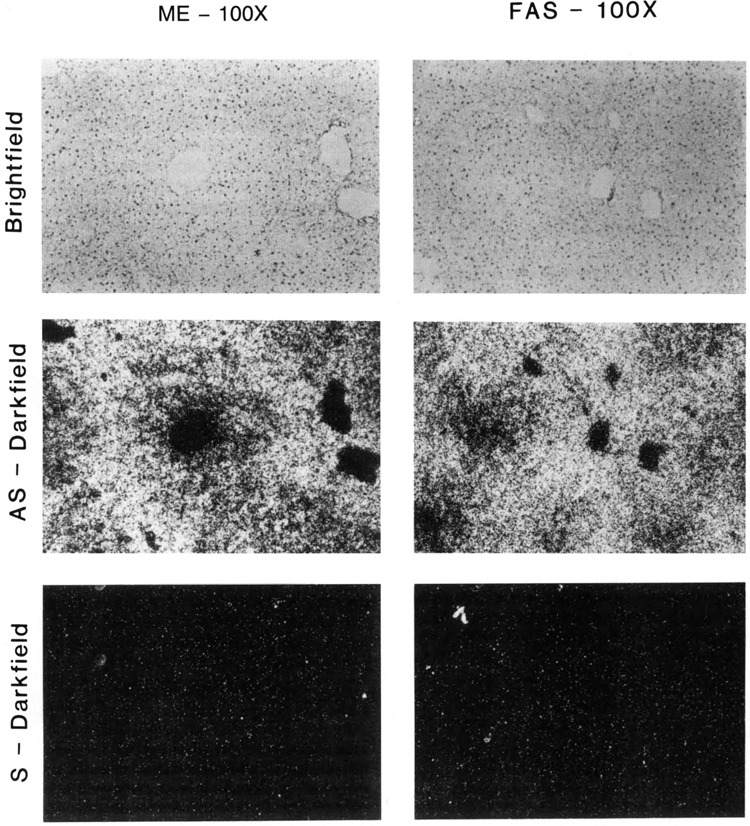
In situ analysis of nonspecific background hybridization of malic enzyme (ME) and fatty acid synthase (FAS) sense-strand probes in livers of carbohydrate-induced adult male CD-I mice. Liver sections from mice that were fasted and refed a no-fat, high-carbohydrate diet for 24 hours were hybridized with 35S-labeled ME (dark-field, as indicated) and FAS (dark-field, as indicated) cDNA sense (S) and antisense (AS) probes to demonstrate nonspecific background hybridization Corresponding bright-fields are shown for ME and FAS, respectively. Magnification (×100) and exposures were identical for all sections. Fasted: 36 hours no food. Refed: fasted, then fed a high-carbohydrate, no-fat diet.
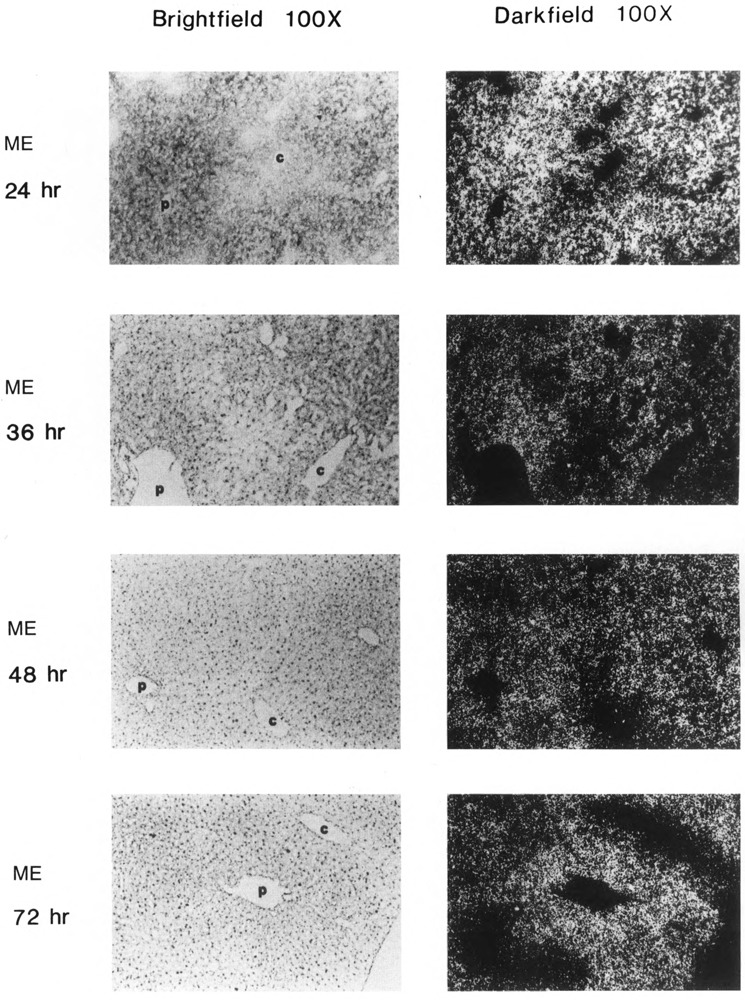
Both lipogenic enzymes, ME (Fig. 2) and FAS (Fig. 3), were expressed at low basal levels in all hepatocytes of mice fed a control diet. When mice were fasted only (0 hours refed), the level of expression in all hepatocytes of both enzymes decreased to a level that was barely detectable. After only 6 hours of refeeding mice the high-carbohydrate, no-fat diet, ME and FAS genes were induced significantly in periportal hepatocytes. Periportal expression of ME and FAS mRNA continued to increase further, through at least 12 hours of refeeding. Between 24 and 36 hours after refeeding, the level of expression of both genes was maximal and appeared to be more uniform throughout the liver, so that even pericentral hepatocytes were induced. After 72 hours, expression of ME and FAS had declined, especially in pericentral areas, so that expression once again appeared to be greater in portal cells. These results indicate that the temporal response of hepatocytes to a carbohydrate stimulus depends on the responding cells’ proximity to portal or central veins.
Figure 2.
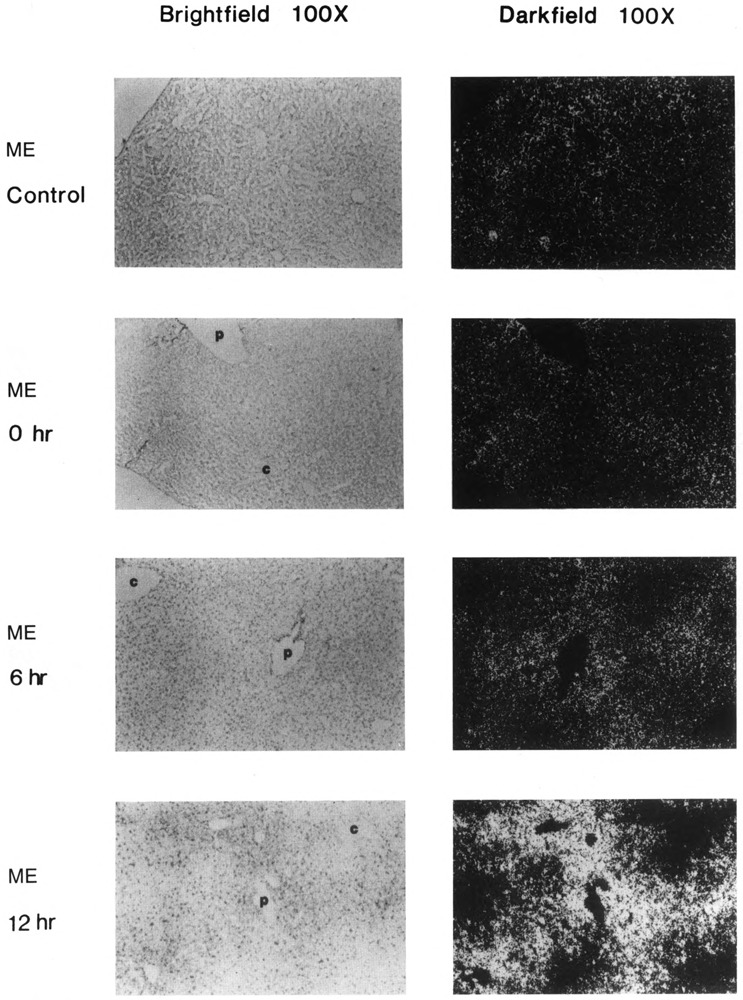
In situ analysis of malic enzyme (ME) mRNA localization in livers of control, fasted, and carbohydrate-induced adult male CD-I mice. Control (bright-field and dark-field, as indicated), fasted (bright-field and dark-field, as indicated), and fasted and refed a no-fat, high-carbohydrate diet for 6 hours, 12 hours, 24 hours, 36 hours, 48 hours, and 72 hours (bright-field and dark-field, as indicated), c: central vein; p: portal vein. Magnification ×l00. Fasted: 36 hours no food. Representative sections from two experiments, each carried out with two mice, are shown. In situ and photographic exposures are identical.
Figure 3.
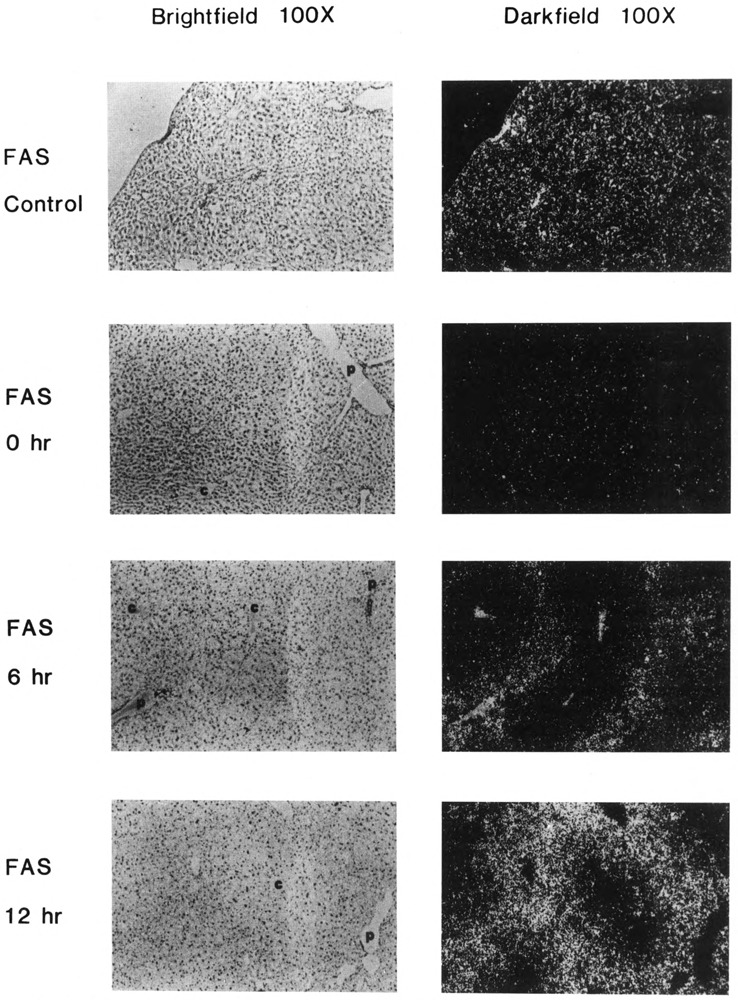

In situ analysis of fatty acid synthase (FAS) mRNA localization in livers of carbohydrate-induced adult male CD-I mice. Control (bright-field and dark-field as indicated), fasted (bright-field and dark-field as indicated), and refed a no-fat, high-carbohydrate diet for 6, 12, 24, 36, 48, and 72 hours (bright-field and dark-field as indicated). c: central vein; p: portal vein. Magnification ×100. Fasted: 36 hours no food. Refed: fasted, then fed a high-carbohydrate, no-fat diet. Representative sections from two experiments, each carried out with two mice, are shown. In situ and photographic exposures are identical.
The patterns of expression and temporal induction by carbohydrates were similar for both ME and FAS, as shown in Figures 2 and 3. These data confirm results from an earlier experiment carried out in our laboratory. To determine whether the lipogenic genes were co-regulated with respect to hepatocyte position, we analyzed adjacent liver sections from a mouse that had been fasted and refed for 12 hours. In situ hybridization with ME and FAS probes (Fig. 4) demonstrated that the same periportal regions exhibit co-induced expression of ME and FAS. Interestingly, it also appears that the periportal induction is not an all-or-none response, but is instead a gradient of expression.
Figure 4.
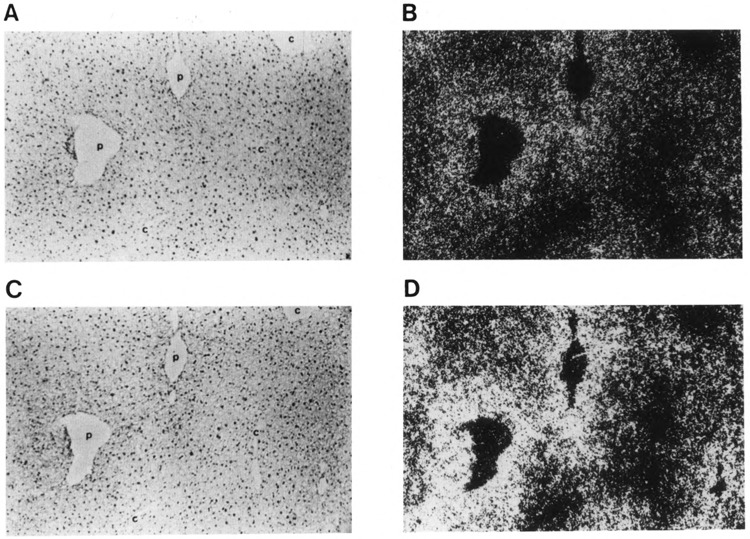
In situ analysis of malic enzyme (ME) and fatty acid synthase (FAS) mRNA co-localization in livers of carbohydrate-induced adult male CD-I mice. Adjacent liver sections from mice refed for 12 hours were hybridized with 35S-labeled ME cDNA probe, bright-field (A) and dark-field (B); or 35S-labeled FAS cDNA probe, bright-field (C) and dark-field (D). c, central vein; p, portal vein. Magnification ×100.
Temporal analysis of steady-state ME and FAS mRNA
The stimulatory effect of carbohydrates on lipogenic gene expression, analyzed by in situ hybridization, suggested an increased concentration of mRNA in mouse liver. Such an increase has been observed previously for ME (Ma et al., 1990), FAS (Paulauskis and Sul, 1988), and G6PDH (Prostko et al., 1989) mRNA. To verify the qualitative temporal response demonstrated by the in situ hybridization data, we determined when mRNA levels were maximal and when levels returned to normal. We used 32P-labeled cDNA probes that were complementary to ME or FAS to determine the levels of total ME and FAS mRNA in control mice, fasted mice, and mice that were fasted and refed a high-carbohydrate, no-fat diet. The mRNAs of these lipogenic enzymes were normalized to actin mRNA, since its level remained constant during dietary changes. The relative mRNA levels for ME and FAS are graphed in Figure 5. ME mRNA expression demonstrates a pattern similar to that of FAS mRNA, but with lower overall induction. The steady-state mRNA levels of ME and FAS were very low in livers of mice fed a control diet and decreased to below ad libitum fed levels when mice were fasted. Parallel to the in situ data, carbohydrate induction of expression was observed as early as 6 hours after refeeding a high-carbohydrate, no-fat diet. Between 6 and 24 hours, ME mRNA increased approximately 3-fold—significantly less than the simultaneous 12-fold increase in FAS mRNA levels. The greater stimulation of FAS correlated with the in situ results, since FAS periportal expression was more intense than ME under identical conditions (Fig. 4). Levels of mRNA then declined until 8 days, when ME returned almost to basal level—though FAS was still elevated (approximately 3-fold). Thus, the overall temporal pattern of steady-state ME and FAS mRNA levels correlated well with parallel changes in ME and FAS expression during in situ hybridization.
Figure 5.
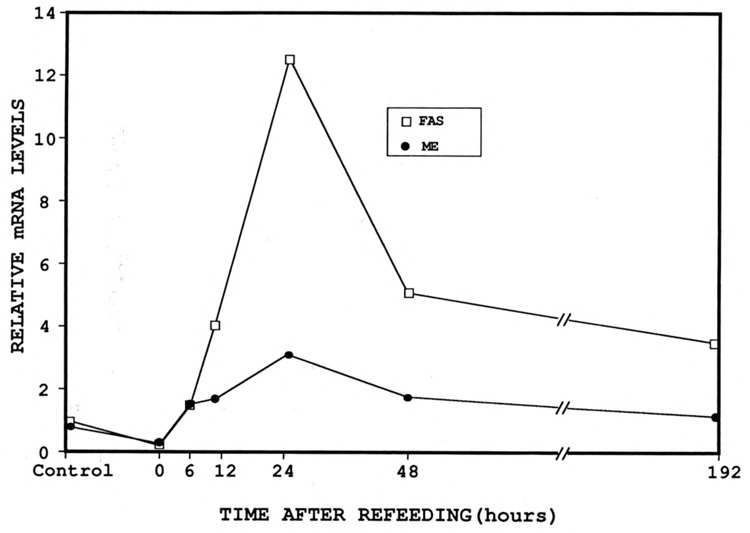
The mRNA levels of malic enzyme (ME) and fatty acid synthase (FAS) were analyzed in livers from mice that were fasted, then refed a high-carbohydrate, low-fat diet for 0, 6, 12, 24, 48, and 72 hours or 8 days. Poly(A)+ RNA (2 μg) was attached to nitrocellulose using a slot-blot apparatus, as described in Materials and Methods. RNA was hybridized with 32P-labeled DNA probes for ME, FAS, and actin as a control. The mRNA levels of ME and FAS are plotted relative to actin. In situ and photographic exposures are identical.
Temporal analysis of ME and FAS gene transcription rates
The analysis of RNA levels by slot-blot and in situ hybridization suggested possible transcriptional controls on the mouse ME and FAS genes. FAS mRNA was previously shown to increase after refeeding a high-carbohydrate diet, and its regulation appears to be transcriptional (Back et al., 1986; Laux and Schweizer, 1990). However, ME gene expression has been reported to have both transcriptional and posttranscriptional regulatory components (Schwartz and Abraham, 1983; Dozin et al., 1986). To determine whether the changes in expression of ME and FAS mRNA observed in this study were due to altered transcription rates, we used a nuclear run-on transcription assay. Figure 6 shows the relative transcription rates of the ME and FAS genes, which were normalized to actin. The transcription of the ME and FAS genes were low in livers of control mice. Transcription rates of both genes dropped even further when mice were fasted, but began to increase significantly as early as 6 hours after refeeding a high-carbohydrate, no-fat diet. After 12 hours of refeeding, transcription rates increased 12-fold for ME and 13-fold for FAS. These maximum transcription rates preceded the maximal mRNA levels by 12 hours, which suggests that regulation is at least partly transcriptional. The relative transcription rate of ME was consistently lower than the rate of the FAS gene for all time points. After 72 hours of refeeding, the rate of transcription of both genes had decreased dramatically, but FAS remained significantly higher than control levels. Thus, the nuclear run-on assays showed that the periportal induction of FAS by carbohydrates is regulated at the level of transcription. However, the increase in transcription rate for ME was not commensurate with the increase in mRNA, which indicates that there is a posttranscriptional as well as a transcriptional component to ME regulation.
Figure 6.
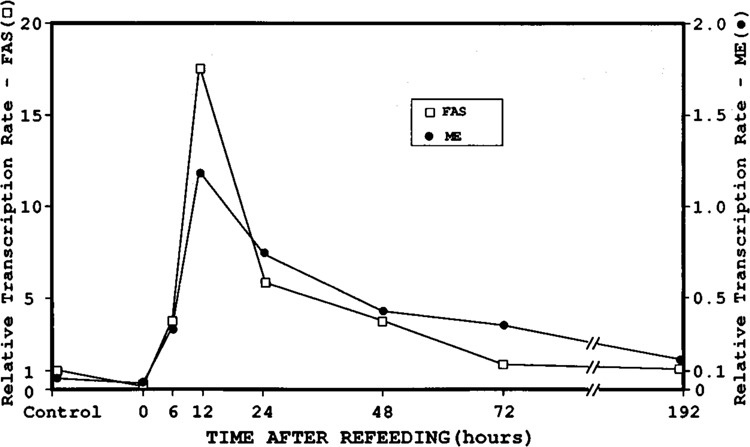
Transcriptional analysis of the malic enzyme (ME) and fatty acid synthase (FAS) genes in livers from mice which were fasted, then refed a high-carbohydrate, low-fat diet for 0, 6, 12, 24, 48, and 72 hours or 8 days. Nuclei were isolated from treated animals, and nascent transcripts labeled with 32p-UTP. cDNA (4 μg) for ME, FAS, and actin was attached to nitrocellulose with a slot-blot apparatus, as described in Materials and Methods. Labeled nuclear RNA (1 × 10⁷ cpm) from each sample was used for hybridization. The mouse cDNA for actin was used to standardize data, since it did not vary with dietary alterations. The rates of transcription were presented as a fold change relative to mice fed a control diet. In situ and photographic exposures are identical.
Discussion
In this study we demonstrated that expression of the lipogenic genes, ME and FAS, had an unexpected positional and temporal response when fasted mice were refed a high-carbohydrate, no-fat diet. Initially, there was a dramatic induction of expression of both genes in periportal hepatocytes that was maximal at approximately 12 hours. This was followed by a further increase, to which all hepatocytes, including pericentral hepatocytes, responded by 24 to 36 hours. There have been no previous reports of such a pattern of induction in the liver. Since the steady-state message levels of both enzymes follow a transient pattern similar to that observed by in situ analyses, and since transcription rates peaked about 12 hours earlier than mRNA levels, we propose that transcriptional regulation accounts for the changes observed in hepatic expression of ME and FAS during carbohydrate induction.
There is a high correlation between the activity of ME and the rate of fatty acid synthesis (Wise and Ball, 1964; Goodridge, 1968; Smith et al., 1969). The correlation between FAS and ME, which provide NADPH for de novo fatty acid synthesis (Bartley et al., 1966), suggests that ME regulation by dietary fats might be similar to that observed for FAS (Schwartz and Abraham, 1982). Fatty acid synthase, a principal enzyme of fatty acid synthesis, is stimulated in vivo after refeeding, and its regulation is transcriptional (Back et al., 1986). It was reported recently that nutritional regulation of the level of ME mRNA in chickens is transcriptional (Ma et al., 1990). However, several investigators have reported no correlation between the rate of transcription and the amount of mRNA for ME in rats (Schwartz and Abraham, 1983; Dozin et al., 1986). In these studies, the increase in ME mRNA was attributed primarily to posttranscriptional events, such as message stabilization. Increases in enzyme activity have been shown to correlate with the amount of mRNA for both ME (Katsurada et al., 1982; Fukada et al., 1990) and FAS (Fukada and Iritani, 1992). G6PDH, another major contributor of NADPH to fatty acid synthesis, also demonstrates increased mRNA levels and enzyme activity after refeeding a high-carbohydrate diet to a fasted rat (Sun and Hoiten, 1978). Prostko et al. (1989) reported that increased transcription and a posttranscriptional mechanism such as mRNA stability are each partly responsible for regulation of G6PDH by diet. In this study, we have shown that although the periportal induction of ME by carbohydrates is primarily a transcriptional response, there is a posttranscriptional component as well. However, we found that regulation of FAS appears to be solely transcriptional.
Several lipogenic enzymes, including the three major enzymatic sources of NADPH for fatty acid biosynthesis—ME, G6PDH, and 6-phosphogluconate dehydrogenase (6PGDH)—have been localized in the intermediate and possibly the pericentral hepatocytes (Rieder, 1981; Jungermann, 1986; Pilkis et al., 1988; Jonges and Van Noorden, 1989). These results are contrary to our observation of periportal-specific induction of ME and FAS mRNA in in situ hybridization. We would expect G6PDH to be localized in regions similar to ME and FAS and also be induced in periportal hepatocytes (Rieder, 1981; Jonges and Van Noorden, 1989), although previous histochemical analysis gave inconsistent results. Our analysis of distribution of mRNA by in situ hybridization is much more accurate than previous histochemical techniques; prior reports may have been inconsistent because the positional response is also a temporal response. Thus, the variability of previous results may have been due to different isolated timepoints chosen for analysis.
Genes that are positionally regulated in the liver can be grouped into two classes. The first class is distinct because it has both constitutive and all-or-none expression. This is exemplified by major urinary protein (MUP), which is localized exclusively in pericentral hepatocytes (Bennett et al., 1987). A second example is glutamine synthetase (GS), which is expressed only in the single layer of cells surrounding the central vein (Kuo et al., 1988). The second class consists of genes that are expressed in all hepatocytes at low levels, but may be induced dramatically in specific regions in response to metabolites. This pattern of induction-specific expression has been reported for several enzymes, including PEPCK (McGrane et al., 1990) and glutathione-S-transferase (GST; Paulson et al., 1990). Induction-specific positional expression was also demonstrated by ME and FAS in this study. However, the pattern of expression is unique in that it transiently broadens from the periportal region into pericentral regions before returning to the periportal region.
Although a position-specific transcriptional response for both ME and FAS does appear to be strongly indicated upon carbohydrate induction, the mechanisms of positional regulation are not well understood. It seems unlikely that hepatic positional expression is due to gradients of metabolites, as was previously proposed (Jungermann, 1986), since several experiments have shown that positional expression is independent of the special environment of the liver. For example, co-localization of pericentral markers has been observed in cultures of differentiating fetal hepatocytes in which no gradients of soluble metabolites exist (Bennett et al., 1987). Furthermore, liver cells explanted to the spleen demonstrated that pericentral-specific cells persisted for months adjacent to non-pericentral cells (Maganto et al., 1990).
Other signals, possibly extracellular cell surface contacts, are probably responsible for positional regulation of gene expression. Kuo et al. (1988) hypothesized that the pericentral regulation of glutamine synthetase is controlled by the underlying composition of the hepatic sinus as the source of cues directing transcription. This argument was later strengthened by an analysis of regenerating liver in which pericentral markers were lost by the destruction of pericentral hepatocytes. Only when regenerating hepatocytes resumed contact with pericentral veins was marker expression restored (Kuo and Darnell, 1991).
Finally, recent evidence has shown that there are differences in the matrix chemistry in the acinus between the portal triads to the central vein, suggesting that the varying matrix may control expression by specifying protein-matrix contacts in portal and central areas (Martinez-Hernandez and Amenta, 1992). Thus, noncirculating environmental factors may play a role in the fine differentiation of hepatocytes, resulting in metabolic zonation.
Acknowledgments
We thank Dr. Charles Rubin (Albert Einstein College of Medicine) for providing the mouse malic enzyme cDNA and Dr. Hei Sook Sul (Harvard University) for the mouse fatty acid synthase cDNA.
This project was funded by the Digestive Disease Center, National Institutes of Health (grant P30 DK34928 to K. E. Paulson) and in part by the U.S. Department of Agriculture, Agricultural Research Service, under contract 53-3K06-0-1 (K. E. Paulson). The contents of this publication do not necessarily reflect the views or policies of the U.S. Department of Agriculture.
The costs of publishing this article were defrayed in part by the payment of page charges. This article must therefore be hereby marked “advertisement” in accordance with 18 USC Section 1734 solely to indicate this fact.
References
- American Institute of Nutrition Ad Hoc Committee on Standards for Nutritional Studies (1977), J Nutr 107, 1340–1348. [DOI] [PubMed] [Google Scholar]
- Back B. W., Goldman M. J., Fisch J. E., Ochs R. S., and Goodridge A. G. (1986), J Biol Chem 261, 4190–4197. [PubMed] [Google Scholar]
- Bartley J. C., Abraham S., and Chaikoff I. L. (1966), Proc Soc Exp Biol Med 123, 670–675. [DOI] [PubMed] [Google Scholar]
- Bennett A. L., Paulson K. E., Miller R. E., and Darnell J. E. Jr. (1987), J Cell Biol 105, 1073–1085. [DOI] [PMC free article] [PubMed] [Google Scholar]
- Blake W. L. and Clarke S. D. (1990), J Nutr 120, 1727–1729. [DOI] [PubMed] [Google Scholar]
- Chirgwin J. M., Przybla A. E., MacDonald R. J., and Rutter W. J. (1979), Biochemistry 18, 5294–5299. [DOI] [PubMed] [Google Scholar]
- Clarke S. D. and Hembree J. (1990), J Nutr 120, 625–630. [DOI] [PubMed] [Google Scholar]
- Dozin B., Rall J. E., and Nikodem V. M. (1986), Proc Natl Acad Sci USA 83, 4705–4709. [DOI] [PMC free article] [PubMed] [Google Scholar]
- Dozin B., Magnuson M. A., and Nikodem V. M. (1986), J Biol Chem 261, 10290–10292. [PubMed] [Google Scholar]
- Fischer W., Ick M., and Katz N. (1982), Hoppe-Seyler’s Z Physiol Chem 363, 375–380. [DOI] [PubMed] [Google Scholar]
- Fukuda H. and Iritani N. (1992), J Biochem 112, 277–280. [DOI] [PubMed] [Google Scholar]
- Fukada H., Katsurada A., and Iritani N. (1990), Eur J Biochem 188, 517–522. [DOI] [PubMed] [Google Scholar]
- Gaasbeek Janzen J. W., Gebhardt R., Ten Voorde G. H. J., Lamers W. H., Charles R., and Moorman A. F. M. (1987), J Histochem Cytochem 35, 49–54. [DOI] [PubMed] [Google Scholar]
- Gebhardt R., Burger H.-J., Heini H., Schreiber K.-L., and Mecke D. (1988), Hepatology 8, 822–830. [DOI] [PubMed] [Google Scholar]
- Goodridge A. G. (1968), Biochem J 108, 663–666. [DOI] [PMC free article] [PubMed] [Google Scholar]
- Jonges G. N. and Van Noorden C. J. F. (1989), Histochem J 21, 585–594. [DOI] [PubMed] [Google Scholar]
- Jungermann K. (1986), in Regulation of Hepatic Metabolism (Thuman R. G., Kauffman F. C., and Jungermann K., eds.), Plenum Publishing Corp., New York, pp. 445–472. [Google Scholar]
- Katsurada A., Iritani N., Fukada H., Noguchi T., and Tanaka T. (1982), Biochem Biophys Res Comm 109, 250–256. [DOI] [PubMed] [Google Scholar]
- Katz N., Teutsch H. F., Sasse D., and Jungermann K. (1977), FEBS Lett 76, 226–230. [DOI] [PubMed] [Google Scholar]
- Kuo C. F. and Darnell J. E. Jr. (1991), Mol Cell Biol 11, 6050–6058. [DOI] [PMC free article] [PubMed] [Google Scholar]
- Kuo C. F., Paulson K. E., and Darnell J. E. Jr. (1988), Mol Cell Biol 8, 4966–4971. [DOI] [PMC free article] [PubMed] [Google Scholar]
- Lamers W. H., Hilberts A., Furt E., Smith J., Jonges G. N., Van Noorden C. J. F., Gaasbeek Janzen J. W., Charles R., and Moorman A. F. M. (1989), Hepatology 10, 72–76. [DOI] [PubMed] [Google Scholar]
- Laux T. and Schweizer M. (1990), Biochem J 266, 793–797. [PMC free article] [PubMed] [Google Scholar]
- Ma X.-J., Salati L. M., Ash S. E., Mitchell D. A., Klautky S. A., Fantozzi D. A., and Goodridge A. G. (1990), J Biol Chem 265, 18435–18441. [PubMed] [Google Scholar]
- Maganto P., Traber P. G., Rusnell C., Dobbins W. O., Keren D., and Gumucio J. J. (1990), Hepatology 11, 585–592. [DOI] [PubMed] [Google Scholar]
- Martinez-Hernandez A. and Amenta P. S. (1992), in Extracellular Matrix: Chemistry, Biology, Pathology (Zern M., and Reid L., eds.), Marcel Dekker, NY. [Google Scholar]
- McGrane M. M., Yun J. S., Moorman A. F. M., Lamers W. H., Hendrick G. K., Arafah B. M., Park E. A., Wagner T. E., and Hanson R. W. (1990), J Biol Chem 265, 22371–22379. [PubMed] [Google Scholar]
- Moorman A. F. M., De Boer P. A. J., Geerts W. J. C., Zande L. V. D., Lamers W. H., and Charles R. (1988), J Histochem Cytochem 36, 751–755. [DOI] [PubMed] [Google Scholar]
- Morikawa N., Nakayama R., and Holten D. (1984), Biochem Biophys Res Commun 120, 1022–1029. [DOI] [PubMed] [Google Scholar]
- Nace C. S., Szepesi B., and Michaelis O. E. (1979), J Nutr 109, 1094–1102. [DOI] [PubMed] [Google Scholar]
- Paulauskis J. D. and Sul H. S. (1988), J Biol Chem 263, 7049–7054. [PubMed] [Google Scholar]
- Paulson K. E., Darnell J. E. Jr., Rushmore T., and Pickett C. B. (1990), Mol Cell Biol 10, 1841–1852. [DOI] [PMC free article] [PubMed] [Google Scholar]
- Pilkis S. J., El-Maghrabi M. R., and Claus T. H. (1988), Annu Rev Biochem 57, 755–783. [DOI] [PubMed] [Google Scholar]
- Poliard A. M., Bernuau D., Tournier I., Legres L. G., Schoevaert D., Feldmann G., and Sala-Trepat J. M. (1986), J Cell Biol 103, 777–786. [DOI] [PMC free article] [PubMed] [Google Scholar]
- Powell D. J., Friedman J. M., Oulette A. J., Krauter K. S., and Darnell J. E. Jr. (1984), J Mol Biol 179, 21–35. [DOI] [PubMed] [Google Scholar]
- Prostko C. R., Fritz R. S., and Kleitzien R. F. (1989), Biochem J 258, 295–299. [DOI] [PMC free article] [PubMed] [Google Scholar]
- Rieder H. (1981), Histochemistry 72, 579–615. [DOI] [PubMed] [Google Scholar]
- Salati L. M., Adkins-Fink B., and Clarke S. D. (1988), Lipids 23, 36–41. [DOI] [PubMed] [Google Scholar]
- Salati L. M., Ma X.-J., McCormick C. C., Stapleton S. R., and Goodridge A. G. (1991), J Biol Chem 266, 4010–4016. [PubMed] [Google Scholar]
- Sambrook J., Fritsch E. F., and Maniatis T. (1989), Molecular Cloning: A Laboratory Manual, 2nd ed., Cold Spring Harbor Laboratory Press, Cold Spring Harbor, NY. [Google Scholar]
- Schwartz R. S. and Abraham S. (1982), Biochim Biophys Acta 711, 316–326. [DOI] [PubMed] [Google Scholar]
- Schwartz R. S. and Abraham S. (1983), Arch Biochem Biophys 221, 206–215. [DOI] [PubMed] [Google Scholar]
- Smith S., Gagne H. T., Pitelka D. R., and Abraham S. (1969), Biochem J 115, 807–815. [DOI] [PMC free article] [PubMed] [Google Scholar]
- Stapleton S. R., Mitchell D. A., Salati L. M., and Goodridge A. G. (1990), J Biol Chem 265, 18442–18446. [PubMed] [Google Scholar]
- Sun J. D. and Holten D. (1978), J Biol Chem 253, 6832–6836. [PubMed] [Google Scholar]
- Teutsch H. F. (1988), Hepatology 8, 311–317. [DOI] [PubMed] [Google Scholar]
- Tomlinson J. E., Nakayama R., and Holten D. (1988), J Nutr 118, 408–415. [DOI] [PubMed] [Google Scholar]
- Wilson M. D., Blake W. L., Salati L. M., and Clarke S. D. (1990), J Nutr 120, 544–552. [DOI] [PubMed] [Google Scholar]
- Wise E. M. and Ball E. G. (1964), Proc Natl Acad Sci USA 52, 1255–1263. [DOI] [PMC free article] [PubMed] [Google Scholar]
- Zierz S., Katz N., and Jungermann K. (1983), Hoppe-Seyler’s Z Physiol Chem 364, 1447–1453. [DOI] [PubMed] [Google Scholar]