

Abstract
In cells latently infected with Epstein-Barr virus (EBV), the expression of two viral transactivators, EB1 and R, is responsible for the switch from latency to a productive cycle. R contains a DNA-binding/dimerization domain localized at the N-terminus. The domain required for transcriptional activation is localized at the C-terminus and contains two regions of very different amino acid composition. The first is very rich in prolines, whereas the second is rich in acidic residues and contains two potential a-helices. We investigated the activation potential of these subregions when linked to the heterologous Gal4 DNA-binding domain. We found that the acidic region—more precisely, the second putative α-helix—is an activating domain. In contrast, the proline-rich region is insufficient by itself for activation but collaborates with the acidic region in a cell-specific manner to make transactivation more efficient. We demonstrated that R interacts in vitro with the basal transcription factors TBP and TFIIB, and that the acidic domain of R mediates these interactions.
Epstein-Barr virus (EBV) is a human herpes-virus that establishes latent infections in B lymphocytes. Induction of the lytic cycle by certain chemical agents or differentiation is thought to be due to an early step involving the expression of two EBV transcription factors, EB1 (Z, Zta, or ZEBRA) and R (Rta). Indeed, transient expression of EB1 in latently infected B lymphocytes can induce the EBV genes required for progression to the lytic cycle (Miller et al., 1984; Countryman and Miller, 1985; Countryman et al., 1986; Chevallier-Greco et al., 1986; Rooney et al., 1989). These genes include those required for the function of the origins of replication during the lytic cycle (oriLyts; Hammerschmidt and Sugden, 1988; Fixman et al., 1992), and those coding for the transcription factors R (Hardwick et al., 1988) and BFLF4 (Marschall et al., 1991). EB1 is essential for the induction of the lytic cycle because it transactivates the oriLyts, probably by binding to specific DNA sequences proximal to the oriLyts (Hammerschmidt and Sugden, 1988). However, R expressed alone in latently infected B lymphocytes activates as many early genes as EB1, and there are R-responsive elements in several EBV early promoters (Buisson et al., 1989; Chevallier-Greco et al., 1989; Kenney et al., 1989; Cox et al., 1990; Holley-Guthrie et al., 1990). It is therefore probable that R is essential for the induction of the lytic cycle.
R activates transcription by interacting directly with specific DNA sequences called RREs (R-responsive elements). Each binding site covers about 18 bp, wherein R simultaneously contacts two core sequences separated by 5 to 7 base pairs (Gruffat et al., 1990; Gruffat etal., 1992). R binds in vitro as a homodimer to an RRE, but such homodimers can form and are stable in the absence of a DNA-binding site. R is a protein of 605 amino acids and can be functionally divided into a DNA-binding/dimeriza-tion domain contained in the 280 N-terminal amino acids and an activation domain located in the C-terminal part of the protein (Manet et al., 1991; Hardwick et al., 1992).
Transcription factors are thought to increase specific initiation by interacting directly or indirectly with general components of the basal transcriptional machinery. This interaction is likely to be mediated by amino acids in their activation domain (for a review see Ptashne, 1988; Mitchell and Tjian, 1989; Ptashne and Gann, 1990). At least three main classes of activation domain have been identified so far, according to their distinctive amino acid composition: acidic negatively charged domains, glutamine-rich domains, and proline-rich domains (Mitchell and Tjian, 1989). However, the activation domains of many transcription factors do not fall into any of these classes. A question central to understanding how transcription factors increase specifically initiated transcripts, is what the target(s) for their activation domains are. There is recent indirect evidence that co-activators or adaptors, specific for classes of activation domains, form bridges between the transactivators and components of the preinitiation complex (Berger et al., 1990; Pugh and Tjian, 1990; Dynlacht et al., 1991; Flanagan et al., 1991; Meisterernst and Roeder, 1991; Prywes and Zhu, 1992; Tanese et al., 1991; White et al., 1991; Zhu and Prywes, 1992). However, direct interactions between the activation domains of VP16, E1A, or Zta (EB1) and the general transcription factors TBP and/or TFIIB have been demonstrated in vitro (Stringer et al., 1990; Horikoshi et al., 1991; Ingles et al., 1991; Lee et al., 1991; Lieberman and Berk, 1991; Lin and Green, 1991; Lin et al., 1991).
We present here a detailed analysis of the R protein designed to evaluate the contribution to the transcriptional activation of different regions in the C-terminal part of the protein. Our results underline the central role of a region at the C-terminus of the protein that is 57 amino acids long and rich in acidic residues (region A). Activation of the acidic region is potentialized in a cell-specific manner by a contiguous region rich in prolines (region Pro), which is inactive when alone. We also show the capacity of R to interact in vitro with both TBP and TFIIB through its acidic region.
Materials and methods
Recombinant plasmids
All reporter plasmids used in this study are derivatives of pG1 or pG2 vectors (Jalinot and Kedinger, 1986). pβGR has been previously described (Giot et al., 1991). Briefly, the β-globin promoter of pG was deleted, its TATA box replaced by the EBV DR/DL TATA box and linked through a polylinker to the DR/DL enhancer. pβGG4 was constructed as follows: pβGR was first deleted from the DR/DL TATA box (by excision of a Sal I–Pvu II fragment). This fragment was replaced by a Sal I–Pvu II fragment containing the TATA box of the promoter for the EBV BMLF1 gene (Buisson et al., 1989). This fragment was generated by hybridization of two complementary oligonucleotides (TCGAGGTC GACCAGAATCATAAATAGGGCTGAGGCTG CAG and CTGCAGCCTCAGCCCTATTTATGAT TCTGGTCGACC). Secondly, a Gal4 binding site was introduced into the Sal I restriction site, by inserting a double-stranded DNA fragment obtained by hybridization of two oligonucleotides: TCGAGCGGAGTACTGTCCTCCGC and TCG AGCGGAGGACAGTACTCCGC. Third, the DR/ DL enhancer was deleted, using the Xho I and EcoR I restriction sites to excise the corresponding fragment.
The transcriptional activator R was expressed under the control of the SV40 early promoter from plasmid pSVR (Manet et al., 1989).
The other expression vectors are all derivatives of plasmid pG4MpolyII (Webster et al., 1989; gift from Dr. C. Kedinger), which contains the 147 N-terminal amino acids of Gal4 placed under the control of the SV40 promoter. pGal4-R was made by inserting a Sac I-Bgl II R fragment (the Bgl II site was previously created by directed mutagenesis in the R fragment, 55 bp downstream from the termination codon of R) in the polylinker of PG4MpolyII, cut by Sac I and Bgl II. pGal4-A was made by cloning a BamH I C-terminal fragment of R from plasmid pSPTR (Manet et al., 1991) into the BamH I site of pG4MpolyII. pGal4-Al was constructed by sub-cloning a BamH I-Bal I internal R fragment into the polylinker of pG4MpolyII cut by BamH I and Sac I (blunted). pGal4-A2 was derived from pGal4-A, by subcloning a Bal I-Bgl II fragment in pG4MpolyII cut by BamH I (blunted) and Bgl II. The proline region of R was cloned into The Kpn I-Sac I sites of the polylinker of pG4M-polyll following generation by PCR amplification using the two following oligonucleotides: GCCGGTACCCCAAAGTCGCGCC and GGG GGGAGCTCGGGGGTTACTGCGG In the same way, we obtained plasmid pGal4-VP16 by sub-cloning a PCR-amplified fragment from plasmid pMCl (Ace et al., 1988) containing the whole VP16 sequence. The two oligonucleotides CTCGGATCCTACCCACCGTACTCG and GAT TCCTCGAGCCCCCCCGACCGATG were used for the amplification.
Two plasmids were used as an internal control: pSV2β and pCMVβ. Plasmid pSV2β has been described elsewhere (Gruffat et al., 1990). pCMVβ was constructed by cloning the rabbit β-globin gene downstream of the promoter of the CMV major immediate early gene (Thomsen et al., 1984) in pBluescript KSII+ (Strata-gene). Specific RNAs transcribed from this plasmid were detected by SI mapping using the following 5’ labeled oligonucleotide:
GCCCGGGGGATCCACTAGTTCTAGAGATCTGACGGTTCACTAAACGAGC.
Plasmid pGEXhIIB was constructed by sub-cloning human TFIIB from plasmid phIIB (Ha et al., 1991; gift from Dr. J. Greenblatt) into pGEX-3X (Pharmacia). pET8cHisIID, which contains the ORF for human TBP plus an additional N-terminal histidine tag (Parvin et al., 1992), was a gift from Dr. H. Th. M. Timmers.
DNA transfections
All the transfections were performed with HeLa or HepG2 cells. Cells were grown in DMEM (Gibco) supplemented with 10% (v/v) fetal calf serum. The plasmids used for transfection were prepared by the alkaline lysis method and purified through two CsCl gradients. HeLa cells were seeded at 106 cells per 100 mm Petri dish 8 hours prior to transfection. Transfections were performed using the calcium precipitate method (Graham and Van Der Eb, 1973). Cells were mixed with the appropriate DNAs, which were in the same topological state as assayed by agarose gel electrophoresis. Typically, a total of 15 μg of DNA was used per 100 mm dish, including pSV2β or pCMVp as internal control plus pUC18 to complete the 15 μg.
RNA extraction and S1 nuclease mapping
The transfected cells were lysed using NP40, as described elsewhere (Jalinot and Kedinger, 1986). Nuclei were pelleted and the RNA phenol-extracted from the cytoplasmic fraction. Ten to forty μg of total cytoplasmic RNA was hybridized overnight at 30°C in 50% formamide, 0.3 M NaCl, 0.01 M Tris-HCl, pH 7.4, to 5′- 32P-labeled single-stranded DNA probes. The hybrids were digested for 2 hours at 20°C with 25 U of S1 nuclease per 10 μg of RNA. The size of the S1-protected DNA fragments was analyzed on 8% (w/v) acrylamide/8.3 M urea gels. Quantification was made by cutting the specific S1-protected bands from the gel and counting the radioactivity.
In vitro transcription and translation
All cRNA synthesis was performed according to standard in vitro transcription methodology. The plasmids pSPTR, pSPTRt515, PSPTRt356, and pSPTRd357-492 have been previously described (Manet et al., 1991). They were transcribed using the SP6 RNA polymerase. pSPTRd2-277 was constructed by inserting a Sac I-Bgl II fragment from pGal4-R into the corresponding sites of the pSPT18 plasmid polylinker and then transcribed using the T7 RNA polymerase. 35S-labeled proteins were synthesized according to the standard in vitro translation protocol (Pro-mega) by incubating cRNA with rabbit reticulocyte lysate in the presence of [35S]methionine.
hTFIIB affinity column chromatography
Overnight cultures of E. coli SCS1 transformed with pGEX-2T or pGEXhIIB were diluted 1:10 in fresh LB medium and grown for 2 hours at 37°C before induction with 0.1 mM IPTG. Two hours after induction, cells were pelleted and resuspended in 1/50 culture volume of MTPBS buffer (150 mM NaCl, 16 mM NA2HPO4, 4 mM NaH2P04, 100 mM EDTA, 1% Triton X-100, 1 mM PMSF, pH 7.3), then lysed by ultrasonication. Cell debris was removed by centrifugation at 10,000 × g for 15 minutes. Pre-swollen glutathione-agarose beads (Sigma; 1 ml per liter of culture) were added to the supernatant and incubated with light agitation for 10 minutes at 4°C. The beads were collected by centrifugation, then washed 3–4 times in MTPBS buffer. The concentration of the immobilized proteins was determined by a Bradford assay, then adjusted to a concentration of 4 mg/ml by adding fresh beads.
Minicolumns containing 80 μl of GST-glutathione-agarose beads or GSThIIB-glutathione-agarose beads were prepared and equilibrated with buffer III (20 mM Hepes, pH 7.9, 5 mM MgC12, 200 mM KC1, 1 mM EDTA, 0.5 mM DTT, 0.1 mM PMSF, 20% glycerol), then saturated with 0.5 ml of BSA at 1 mg/ml in buffer III. Ten μ1 of R or R-mutant proteins translated in vitro were diluted in 200 μl of buffer III, then loaded onto the columns and recycled several times. Columns were then washed with buffer III plus 0.5% Triton X-100. The R- or R mutant-GST complexes and R- or R-mutant-GSThllB complexes were eluted from the column by a solution of 50 mM reduced glutathione (Sigma) in 100 mM Tris, pH 8, then denatured and loaded onto SDS-PAGE. The gels were first stained with Coomassie blue to visualize the amount of GST and GSThllB eluted, then dried and autoradiographed.
hTBP affinity column chromatography
hTBP containing 6 additional N-terminal his-tidines was expressed in E. coli B121 (DE3), from plasmid pET8cHisIID. The protein was produced as described above. Cells were lysed by ultrasonication in the following lysis buffer: 20 mM Tris pH8, 500 mM NaCl, 5 mM DTT, 0.1% Triton X-100, 20% glycerol, and 1 mM PMSF. Cell debris was eliminated by centrifugation. The supernatant was loaded onto minicolumns of 80 μl Ni-NTA-agarose beads (Qiagen) previously equilibrated with the lysis buffer. Columns were washed with BC100 buffer (20 mM Tris pH 8, 20% glycerol, 100 mM KC1, 5 mM DTT, 0.5 mM PMSF, and 20 mM imidazole HC1, pH 8).
Ten μl of R and R variants were diluted in 200 μl buffer III and loaded onto columns of Ni-NTA-agarose beads on which HisIID proteins were immobilized. The columns were then washed with buffer III plus 0.5% Triton X-100. The R- or R-mutant-HisIID complexes were eluted using 100 mM imidazole in buffer BC100, then denatured and analyzed on SDS-PAGE. As before, the amount of protein HisIID eluted was visualized by Coomassie blue staining. Similar amounts of GSThllB and HisIID were eluted from the columns in two parallel experiments. The gels were then dried and autoradiographed.
Results
The C-terminal half of R linked to the Gal4 heterologous DNA-binding domain is transcriptionally active
The primary structure of the activation domain of R is characterized by a C-terminal region of 90 amino acids that is particularly acidic and hydrophobic and can potentially form two α-helices, called Al and A2, and a second region, situated between amino acids 352 and 500, that is particularly rich in proline residues (Fig. 1A).
Figure 1.
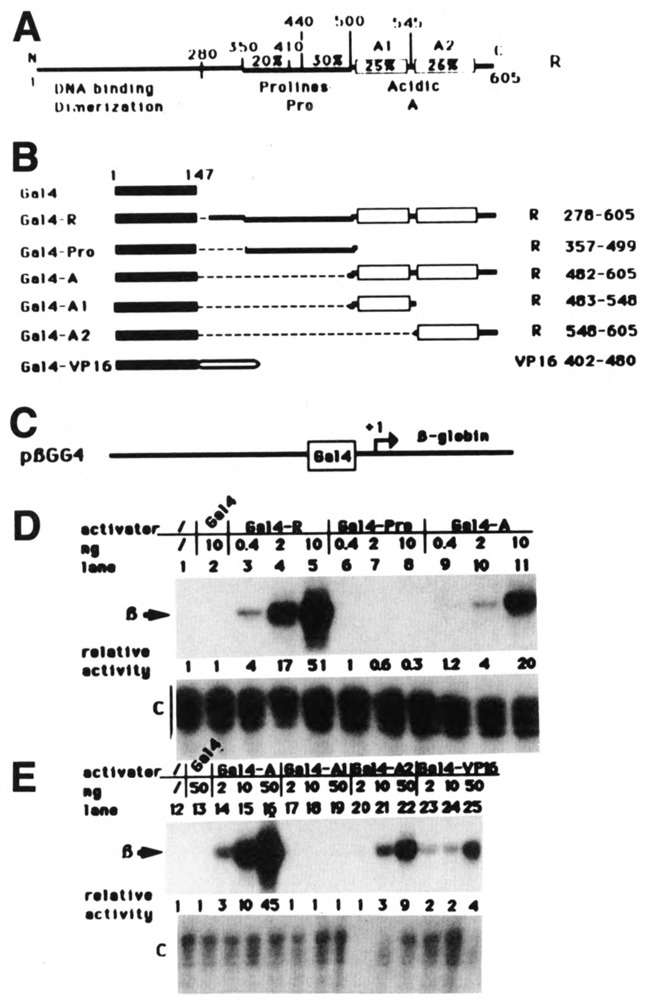
The activity of the C-terminal acidic domain is increased by a contiguous proline-rich domain. A. Schematic representation of the wild-type R protein. B. Schematic representation of the chimeric proteins containing the Gal4 DNA-binding domain fused to various regions of the R protein. The limits of the R regions fused to Gal4 are indicated on the right. C. Schematic representation of the reporter gene pβGG4, comprising the β-globin ORF, a TATA box, and a single Gal4 binding site. D and E. HeLa cells were transfected with 3 μg of reporter gene plasmid together with increasing amounts of Gal4 fusion-expressing plasmids: 0.4, 2, and 10 ng (D) or 2, 10, and 50 ng (E). Transcriptional activation was determined by quantitative SI analysis using total cellular RNA isolated from transfected cells. The specific β-globin bands are indicated in the margin by β. Plasmid pCMVβ was cotransfected as an internal control. The specific bands are indicated by C (control) in the margin. The level of activation was quantified by cutting out the bands and counting the amount of radioactivity in each band. The results are expressed as relative activities.
To study the relative contribution of these regions in transactivation, we generated chi-meric proteins that contained the 147 amino-terminal residues of Gal4 to which different parts of the 327 C-terminal amino acids of R were fused (Fig. 1B). These chimeric proteins were co-transfected in HeLa cells with a reporter construct (pβGG4) containing a TATA box and a single Gal4 binding site upstream from the rabbit β-globin gene (Fig. 1C). The nuclear localization of these fusion proteins is assured by a functional nuclear translocation signal present in the 147 Gal4 amino acids. The level of specific transcription initiated from plasmid pβGG4 was evaluated by SI nuclease mapping. The assay was quantified by cutting the specific bands out and counting the radioactivity. In each experiment, plasmid pCMVp was co-transfected as an internal control for the transfection efficiency. The amount of specifically initiated RNAs expressed from this plasmid was also quantified by S1 nuclease mapping.
Figure 1D shows that, compared to Gal4 alone (lane 2), the chimeric protein containing the 327 C-terminal amino acids of R fused to the Gal4 DNA-binding domain (Gal4-R) was able to activate transcription from the reporter gene (lane 3, 4, and 5). Activation was proportional to the increase in the amount of Gal4-R expression vector transfected up to 2 ng, but reached a plateau at 10 ng (compare lanes 3, 4, and 5). Note that the amounts of Gal4-R expression plasmid transfected increase from 0.4 ng to 10 ng, a range of DNA concentrations insuring that the Gal4-R-induced transcription occurred under physiologically accurate conditions. These results confirm that the transactivation domain of R is localized in the C-terminal half of the protein and show the capacity of this domain to function when linked to a heterologous DNA-binding domain.
Activation by the acidic domain of R is potentiated by a contiguous proline-rich region
In order to determine which structure(s) of the C-terminal domain of the R protein contribute to activation, we evaluated the activity of the chimeric proteins Gal4-R, Gal4-A, and Gal4-Pro depicted in Figure 1B. The results, shown in Figure 1D, demonstrate that the acidic region by itself is transcriptionally active (lanes 9, 10, and 11), whereas the proline-rich region is not detectably active alone (lanes 6, 7, and 8). Activation was not observed, even when up to 1 μg of Gal4-Pro expression plasmid was used (not shown). However, in the Gal4-R protein, the presence of this proline-rich region, together with the acidic domain, increased the activation potential by a factor of 4 at the concentration of 2 ng of expression vector.
The activity of the acidic domain was defined further by comparing the relative activity of the fusion proteins Gal4-Al and Gal4-A2, which contain subregions of A, with the activity of Gal4-A. In this experiment, 2, 10, and 50 ng of chimeric protein-expressing vector were cotransfected in HeLa cells with the reporter gene pβGG4. As shown in Figure 1E, the Gal4-A2 protein was able to activate pβGG4 (lanes 20, 21, and 22), although less efficiently than the Gal4-A protein, which contains the entire acidic domain (lanes 14, 15, and 16). In contrast, the Gal4-Al fusion was not detectably active (lanes 17, 18, and 19). Furthermore, the activity of these chimeric proteins was compared to the activity of a well-characterized transactivator, Gal4-VP16, consisting of the Gal4 DNA-binding domain fused to the activation domain of the herpes simplex virus activator, VP16. In our assay, using a reporter promoter containing a single Gal4 binding site, the level of activation by the Gal4-A2 fusion is similar to the level of activation obtained with Gal4-VP16 (Fig. 1E; compare lanes 20, 21, and 22 to lanes 23, 24, and 25).
It is important to note that in our transfection experiments the activation by R is very efficient, even at very low concentrations of transfecting DNA. In these conditions, it was not possible to visualize the proteins by Western blotting, using antibodies against Gal4. However, when such Western blotting experiments were made using nuclear extracts of cells transfected with 1 μg of expression plasmids, all the proteins that were transcriptionally inactive were expressed at the same level and localized hi the nucleus (Gal4, Gal4-Pro, and Gal4-Al). Thus the inactivity of these proteins cannot be due to their lack of expression. However, the chimeric proteins that activated transcription efficiently (Gal4-R, Gal4A, Gal A2, and Gal4-VP16) were seen only weakly or not at all under these conditions, probably due to an inhibitory effect on their own expression. In effect, as an internal control for transfection efficiency, we co-transfected a plasmid from which EB1 could be expressed from the same promoter as the Gal4 fusions, namely the SV40 early promoter. The expression of EB1 was greatly reduced when the coexpressed Gal4 fusions were efficient in activation (not shown). The active fusion proteins Gal4-R, Gal4-A, Gal-A2, and Gal4-VP16 thus seem to have an inhibitory effect on the SV40 promoter when high concentrations of transfecting plasmid are used (data not shown). When lower concentrations of these proteins are used, such an effect does not seem to occur, as the level of activation observed is directly proportional to the amount of transfecting plasmid used (Fig. 1D and E).
From these results we can conclude that the 57 C-terminal acidic amino acids are central to the function of the activation domain of R. Alone, this domain can work as efficiently as the acidic domain of VP16, which is itself considered a strong activator (Sadowski et al., 1988). However, the adjacency of the Al domain and of the proline-rich domain makes the activator at least 16 times more efficient than Gal4-A2.
The effect of the proline-rich region on the acidic activation domain is cell-specific
Several transcription factors have previously been characterized as carrying proline-rich activation domains. One of them, AP2 (Williams and Tjian, 1991), possesses a structure comparable to the structure of R, with a proline-rich region adjacent to a region rich in acidic residues. In contrast to R, the AP2 proline-rich region is able to activate alone when linked to the DNA-binding domain of Gal4. However, these experiments were carried out using HepG2 cells, which led us to study the activity of our Gal4 fusions in this particular cell type.
The relative activity of the fusion proteins was evaluated by transfecting HepG2 cells with 2 10 and 50 ng of-the expression plasmids pGal4, pGal4-R, pGal4-Pro, and pGal4-A (Fig. 2A), together with the reporter plasmid pβGG4 (Fig. 2B). Expression of the Gal4 DNA-binding domain (at 50 ng of expression plasmid used) had a weak effect on the transcription of pβGG4 (Fig. 2C; compare lanes 1 and 2), whereas expression of Gal4-R substantially increased the level of transcription from pβGG4 in a manner relatively proportional to the amount of expressing plasmid transfected (Fig. 2C, lanes 3, 4, and 5). Compared to Gal4 alone (Fig. 2C, lane 2), the Gal4-Pro fusion protein was again not de-tectably active (Fig. 2C, lanes 6, 7, and 8). Surprisingly, the level of activation by the Gal4-A chimera was the same as that by Gal4-R (Fig. 2C; compare lanes 9, 10, and 11 with lanes 6, 7, and 8). These results suggest that in HepG2 cells, the proline-rich region does not function and has no effect on the activity of the acidic domain A. The cooperation between the proline-rich region of R and its acidic domain thus seems to be cell-specific.
Figure 2.

The effect of the proline-rich domain is cell-specific. A. Schematic representation of fusion proteins between the Gal4 DNA-binding domain and subdomains of the R protein. B. Schematic representation of the reporter gene pβGG4. C. HepG2 cells were transfected with 3 μg of reporter gene plasmid together with increasing amounts of Gal4 fusion-expressing plasmids: 2, 10, and 50 ng. Transcriptional activation was determined as described in Figure 1.
The effect of the A1 subregion is independent of the cell line
Both the proline-rich region and the A1 subregion of R are able to potentialize activation by the A2 acidic domain of R. As stated above, cooperation between the proline-rich domain and the acidic region is cell-specific. To determine whether this cell specificity was a characteristic of the proline-rich region only, we also compared the activation potential of fusions Gal4-A, Gal4-Al, and Gal4-A2 in the HepG2 cells. The results are shown in Figure 3. In this experiment 10, 50, or 250 ng of expression plasmids were cotransfected with the reporter plasmid pβGG4. Activation of transcription from the reporter gene by the fusion Gal4-A was proportional to the amount of expressing plasmid used (lanes 2, 3, and 4). As in HeLa cells, we found that fusion Gal4-Al was inactive (lanes 5, 6, and 7), and that fusion Gal4-A2 (lanes 8, 9, and 10) was consistently less efficient than Gal4-A (lanes 2, 3, and 4). The level of activation obtained using 250 ng of plasmid expressing Gal4-A2 (lane 10) was approximately equivalent to the level of activation obtained using only 50 ng of Gal4-A expression plasmid (lane 3). We can thus conclude that the potentialization effect of subregion A1 on domain A2 is similar in both HeLa and HepG2 cells.
Figure 3.
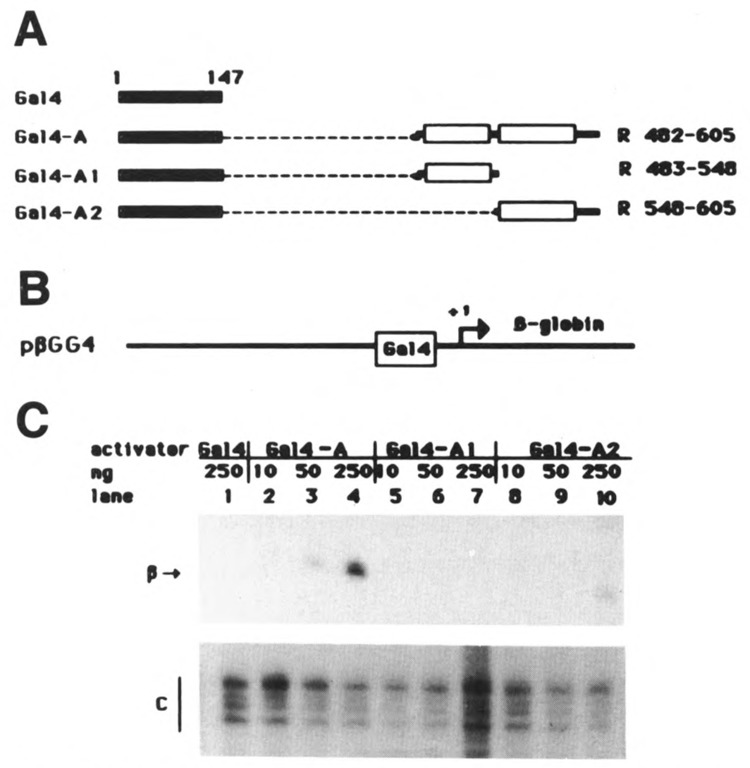
The A1 subregion of R potentiates transcrip-tional activation by domain A2 in HepG2 cells. A. Schematic representation of fusion proteins between the Gal4 DNA-binding domain and subdomains of the R protein. B. Schematic representation of the reporter gene pβGG4. C. HepG2 cells were transfected with 3 μg of reporter gene plasmid together with increasing amounts (10, 50, or 250 ng) of expression plasmids Gal4-A, Gal4-Al, and Gal4-A2. As a control (lane 1), the cells were cotransfected with the reporter gene plasmid together with 250 ng of plasmid expressing the DNA-binding domain of Gal4.
The Gal4-VP16 chimeric protein is able to squelch a factor necessary for activation by R
Given the similar features of the primary sequences of the R (A2) and VP16 activating domains (both acidic and hydrophobic), we further investigated the functional similarity of these two domains by asking whether they could compete for a common factor (“squelching”). For this we used pβGR, a β-globin reporter gene with a promoter containing only a TATA box and binding sites for the R protein (RRE; see Fig. 4A). This construction is activated by the wild-type R protein (Fig. 4B, lane 4), but not by the Gal4-VP16 activator (Fig. 4B, lane 3) or the control protein Gal4 (Fig. 4B, lane 2). We found that when increasing amounts of Gal4-VP16 plasmid (0.1, 0.5, and 2 μg) were cotransfected with pSVR and pPGR, activation by R was increasingly inhibited (Fig. 4B, lanes 5, 6, and 7). These results suggest that VP16 and R contact a common factor necessary for their function. The classical explanation of such inhibition is that unbound Gal4-VP16 sequesters a factor present in limited amounts but necessary for R’s activity.
Figure 4.
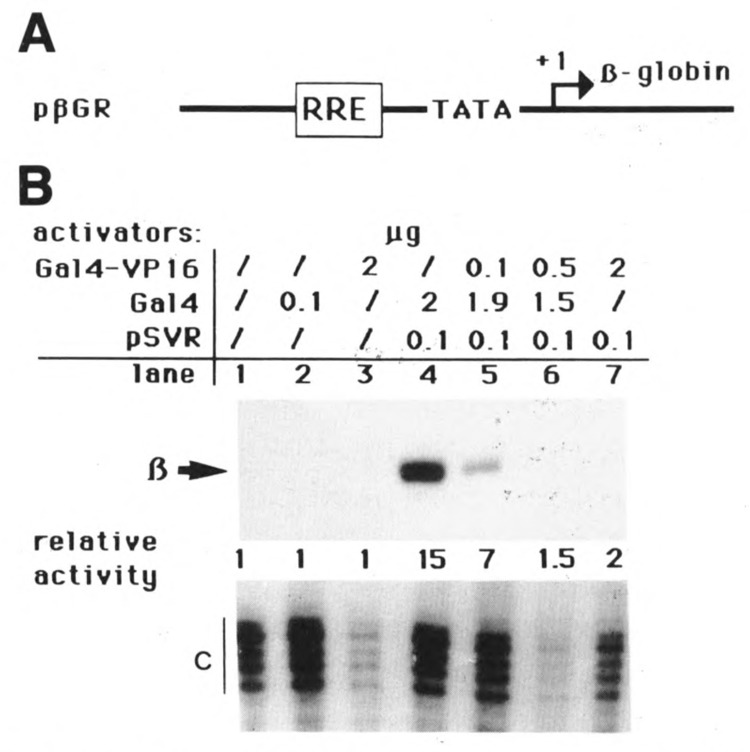
Unbound Gal4-VP16 represses R-induced activation. A. Schematic representation of the reporter gene pβGR, comprising the β-globin ORF, a TATA box, and two binding sites for R. B. HeLa cells were transfected with 3 μg of the reporter gene together with plasmids expressing the proteins indicated in the figure. The fusions are described in Figure 1. Transcriptional activation was determined as for Figure 1.
The acidic region of R interacts in vitro with both hTFIIB and hTBP
Activation domains of transcriptional activators are thought to function by recruiting or stabilizing factors necessary for the formation of the initiation complex. Both TFIIB and TBP have been suggested as possible targets for transcriptional activators. In this context, we wished to determine whether R could directly interact in vitro with either TFIIB or TBP. To demonstrate such interactions, we used affinity chromatography.
Human TFIIB was expressed in E. coli as part of a fusion protein with glutathione S-transferase (GST). The GSThIIB fusion produced was then immobilized on glutathione-agarose. R and several R mutants were then translated in vitro, in the presence of [35S]methionine, and chromatographed on GSThIIB-glutathione-agarose minicolumns in the presence of 200 mM KC1. The R-GSThllB complexes were then eluted from the column by using free glutathione and visualized on SDS-PAGE. The R protein variants used in the experiment are shown in Figure 5B. Representative aliquots of the proteins loaded onto the columns were kept and run on SDS-PAGE (Fig. 5C, lanes 1–5) as a control for the amount of protein used in each case. The proteins were also chromatographed on GST-glutathione-agarose columns as a control. None of the proteins significatively bound to these columns (Fig. 5C, lanes 6–10). Chromatography of the same proteins on the GSThIIB-glutathione-agarose columns showed that the wild-type R protein was specifically retained and was eluted from the column as a complex with GSThIIB (Fig. 5C, lane 11). Deletion mutants lacking the C-terminal acidic domain of R (mutants Rt515 and Rt356) were not retained on the column (Fig. 5C, lanes 13 and 14), whereas mutants Rd357-492 and Rd2-277 were specifically eluted with GSThIIB (Fig. 5C, lanes 12 and 15). These results suggest the possibility of direct interactions between the R protein and the general transcription factor TFIIB involving the acidic domain of R.
Figure 5.
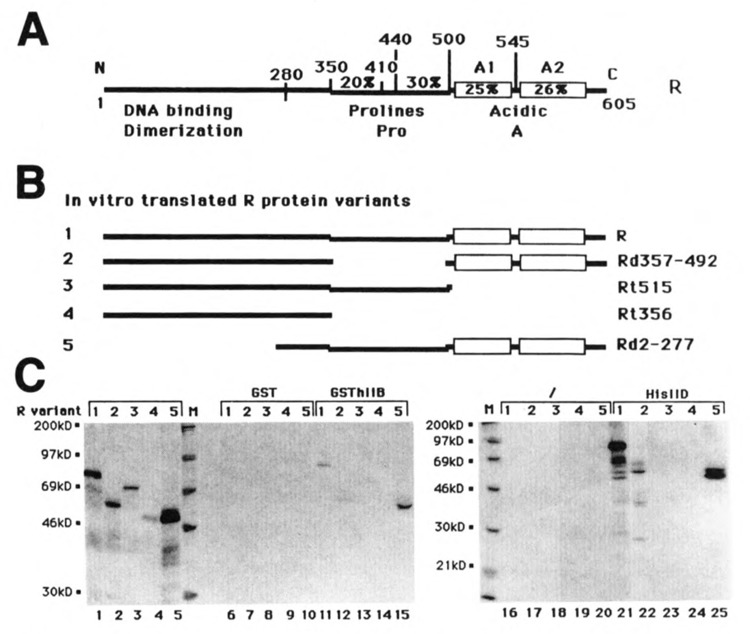
The acidic domain of R contacts both TBP and TFIID in vitro. A. Schematic representation of the R protein. B. Schematic representation of the R mutant proteins tested for their capacity to bind TBP or TFIIB. Each variant has been assigned a recognition number (1–5). C. The R mutant proteins presented in B were translated in vitro in the presence of [35S] methionine. Aliquots of the lysate extracts were either loaded directly onto SDS PAGE (lanes 1–5) or loaded onto minicolumns of GST- or GSThllB-agarose beads (lanes 6–15), nickel-NTA-agarose, or HisIID-nickel-NTA-agarose beads (lanes 16–25). The eluates were loaded onto SDS-PAGE. The gels were then autoradiographed. The mutant proteins used in each lane are indicated by their corresponding number. M indicates the lanes that correspond to the molecular weight markers.
The same protocol was used for TBP. In this case a TBP protein with an N-terminal histi-dine tag (HisIID) was expressed in E. coli. The HisIID protein was immobilized on a nickel-chelating resin, and the in vitro-translated R variants were chromatographed on minicolumns of the immobilized HisIID in the presence of 200 mM KC1. The RHisIID complexes were eluted from the column with imidazole. When the R variants were chromatographed on a nickel resin without HisIID, none of them was significantly retained on the columns (Fig. 5C, lanes 16–20). When the proteins were chromatographed on the HisIID-nickel column, the R wild-type (Fig. 5C, lane 21) and the deletion mutants Rd357-492 and Rd2-277 (Fig. 5C, lanes 22 and 25) were specifically eluted with HisIID, whereas mutants Rt515 and Rt356 were not (Fig. 5C, lanes 23 and 24). As for TFIIB, we found a direct interaction between R and the general transcription factor TBP in vitro. These interactions involve the acidic domain of R necessary for transcriptional activation, suggesting that they could be important for the mechanism of activation by R.
Discussion
The data presented in this study show that the activation domain of R localized at the C terminus of the protein is bipartite. It comprises a potent acidic activation domain, A (aa 515 to 605), and a proline-rich domain, Pro (aa 350 to 500). Although inactive alone, domain Pro is able to potentiate in cis the activity of domain A. Furthermore, this effect is cell-specific, since it is observed in HeLa cells but not in HepG2 cells.
The acidic domain A has been defined according to the acidic and hydrophobic character of the primary sequence in this region. This acidic domain contains two regions, A1 and A2, that can potentially adopt an α-helical configuration and may represent separate functional entities (Fig. 1A). Indeed, when fused to the Gal4 DNA-binding domain, region A2 (aa 548 to 605) is sufficient for transcriptional activation. Although region A1 is inactive when fused to the Gal4 DNA-binding domain, it strongly increases the activity of the region A2. Which part of region A1 is required for increasing the activity of region A2 and how this region affects the activation potential of domain A2 are not as yet known. Domain A2 shows homologies with the acidic activation domain of VP16. Like VP16, it is highly acidic and contains hydrophobic residues that can be aligned with those of VP16. Replacing some of these hydrophobic residues with glycine severely impaired the activation properties of the C-terminal domain of R (aa 520 to 605; Hardwick et al., 1992), as was the case with VP16 itself (Cress and Triezenberg, 1991). In accordance with these data, we have shown that unbound VP16 is able to repress activation by R, which suggests that R and VP16 contact or recruit a common factor necessary for activation.
Although the acidic region A plays a central role in transcriptional activation, the proline-rich region seems to increase its activating potential. Again, region Pro has been defined according to its overall amino acid composition, but it remains to be established whether the prolines are essential for the function of domain Pro. Proline-rich regions have previously been found to be involved in activation (CTF/NF1, AP2, OTF2), but the region found in R is unique, in that it has no activity when linked to the Gal4 DNA-binding domain. However, we have clearly shown that the proline-rich region can potentiate the activity of region A in a cell-specific manner. Cooperation between the proline-rich region of R and the acidic domain may be achieved in many ways. The proline-rich region may simply play a structural role by influencing the topology of the acidic domain within the protein’s tertiary structure. The proline-rich region may also be important for the stability of the protein. Another hypothesis is that the proline-rich region may contact a cellular factor cooperating with region A to recruit or to stabilize components of the basal transcriptional machinery.
We have also shown that region A can contact both TBP and TFIIB in vitro, and the interactions seem relatively stable, as all our experiments have been carried out in 200 mM KC1. The acidic region A shows structural similarities to the VP16 activation domain, which has also been found to interact with TBP and TFIIB (Lin et al., 1991; Stringer et al., 1990). In accord with this, we observed that unbound Gal4-VP16 is able to repress activation by R. Similarly, the other EBV-encoded transcription factor, EBl/Zta, is able to repress R-mediated transcriptional activation (Giot et al., 1991) and has also been shown to be capable of contacting TBP in vitro (Lieberman and Berk, 1991). In the light of such interactions, we asked whether overexpression of TBP can relieve the repression by Gal4-VP16 of R-induced transcription. We found a general increase in basal transcription similar to that observed by Colgan and Manley (1992), but we did not observe any effect on repression (our unpublished data). Thus it seems likely that repression is due to the titration of a coactivator.
As is the case for VP16, R seems to be a factor that is able to interact directly with the general transcription factors TBP and TFIIB but requires a coactivator. Although the acidic region is likely to be involved in all three interactions, the amino acids involved in these interactions could be different, or independent subregions may contact TBP, TFIIB, or a coactivator. Supporting this view, Lee et al. (1991) have shown that E1A interacts with TBP and that, although some mutants of E1A affect both interaction with TBP and activation, others do not. In this context, it would be interesting to analyze point mutants of R for their capacity to activate and interact with identified targets.
To explain the synergy between the acidic region and the proline-rich region that is otherwise inactive, we hypothesize that the acidic region contacts TBP, TFIIB, and a coactivator. The proline-rich region may contact a different cofactor; alternatively, it may help the acidic region recruit its specific coactivator. The absence of activity of the proline-rich region in HepG2 cells may be due to the absence of a factor in these cells, or the proline-rich region may require posttranslational modification (eg., phosphorylation) to be active, and such modification may not be possible in HepG2 cells. In vitro transcription experiments are now required to identify a possible cell-specific factor necessary for the effect observed with the proline-rich region.
Acknowledgments
We wish to thank Dr. J. Greenblatt for human TFIIB cDNA, Drs. M. Horikoshi and R. G. Roeder for human TBP cDNA, Dr. C. Kedinger for plasmid pG4MpolyII, Dr. C. M. Preston for plasmid pMCl, Dr. M. Ptashne for Gal4 antibodies, Dr. H. Th. M. Timmers for plasmid pET8cHisIID, and Conrad B. Bluink for reading the manuscript.
This work was supported by the Federation National des Centres de Lutte contre le Cancer, by the Ministère de l’Enseignement et de la Recherche (Virologie Fondamentale), by INSERM (contract no. 910117), and by the Association pour la Recherche sur le Cancer (no. 6810).
I. Mikaelian is the recipient of an MRT fellowship.
The costs of publishing this article were defrayed in part by the payment of page charges. This article must therefore be hereby marked “advertisement” in accordance with 18 USC Section 1734 solely to indicate this fact.
References
- Ace C. I., Dalrymple M. A., Ramsay F. H., Preston V. G., and Preston C. M. (1988), J Gen Virol 69, 2595–2605. [DOI] [PubMed] [Google Scholar]
- Berger S. L., Cress W. D., Cress A., Triezenberg S. J., and Guarente L. (1990), Cell 61, 1199–1208. [DOI] [PubMed] [Google Scholar]
- Buisson M., Manet E., Biemont M. C., Gruffat H., Durand B., and Sergeant A. (1989), J Virol 63, 5276–5284. [DOI] [PMC free article] [PubMed] [Google Scholar]
- Chevallier-Greco A., Gruffat H., Manet E., Calender A., and Sergeant A. (1989), J Virol 63, 615–623. [DOI] [PMC free article] [PubMed] [Google Scholar]
- Chevallier-Greco A., Manet E., Chavrier P., Mosnier C., Daillie J., and Sergeant A. (1986), EMBO J 5, 3243–3249. [DOI] [PMC free article] [PubMed] [Google Scholar]
- Colgan J. and Manley J. L. (1992), Genes Dev 6, 304–315. [DOI] [PubMed] [Google Scholar]
- Countryman J. and Miller G. (1985), Proc Natl Acad Sci USA 82, 4085–4089. [DOI] [PMC free article] [PubMed] [Google Scholar]
- Countryman J. K., Jenson H., Grogan E., and Miller G. (1986), Cancer Cells 4, 517–523. [Google Scholar]
- Cox M. A., Leahy J., and Hardwick M. (1990), J Virol 64, 313–321. [DOI] [PMC free article] [PubMed] [Google Scholar]
- Cress W. D. and Triezenberg S. J. (1991), Science 251, 87–90. [DOI] [PubMed] [Google Scholar]
- Dynlacht B. D., Hoey T., and Tjian R. (1991), Cell 66, 563–576. [DOI] [PubMed] [Google Scholar]
- Fixman E. D., Hayward G. S., and Hayward S. D. (1992), J Virol 66, 5030–5039. [DOI] [PMC free article] [PubMed] [Google Scholar]
- Flanagan P. M., Kellehee R. J. III, Sayre M. H., Tschoner H., and Kornberg R. D. (1991), Nature 350, 436–438. [DOI] [PubMed] [Google Scholar]
- Giot J., Mikaelian I., Buisson M., Manet E., Joab I., Nicolas J., and Sergeant A. (1991), Nucleic Acids Res 19, 1251–1258. [DOI] [PMC free article] [PubMed] [Google Scholar]
- Graham F. L. and Van Der Eb A. J. (1973), Virology 52, 456–467. [DOI] [PubMed] [Google Scholar]
- Gruffat H., Duran N., Buisson M., Wild F., Buckland R., and Sergeant A. (1992), J Virol 66, 46–52. [DOI] [PMC free article] [PubMed] [Google Scholar]
- Gruffat H., Manet E., Rigolet A., and Sergeant A. (1990), Nucleic Acids Res 18, 6835–6843. [DOI] [PMC free article] [PubMed] [Google Scholar]
- Gruffat H., Moreno N., and Sergeant A. (1990), J Virol 64, 2810–2818. [DOI] [PMC free article] [PubMed] [Google Scholar]
- Ha I., Lane W. S., and Reinberg D. (1991), Nature 352, 689–693. [DOI] [PubMed] [Google Scholar]
- Hammerschmidt W. and Sugden B. (1988) Cell 55, 427–433. [DOI] [PubMed] [Google Scholar]
- Hardwick J. M., Lieberman P. M., and Hayward S. D. (1988), J Virol 62, 2274–2284. [DOI] [PMC free article] [PubMed] [Google Scholar]
- Hardwick J. M., Tse L., Applegren N., Nicholas J., and Veliuona M. A. (1992), J Virol 66, 5500–5508. [DOI] [PMC free article] [PubMed] [Google Scholar]
- Holley-Guthrie E. A., Quinlivan E. B., Mar E.-C., and Kenney S. (1990), J Virol 64, 3753–3759. [DOI] [PMC free article] [PubMed] [Google Scholar]
- Horikoshi N., Maguire K., Kralli A., Maldonado E., Reinberg D., and Weinmann R. (1991), Proc Natl Acad Sci USA 88, 5124–5128. [DOI] [PMC free article] [PubMed] [Google Scholar]
- Ingles C. J., Shales M., Cress W. D., Triezenberg S. J., and Greenblatt J. (1991), Nature 351, 588–590. [DOI] [PubMed] [Google Scholar]
- Jalinot P. and Kedinger C. (1986), Nucleic Acids Res 14, 2651–2669. [DOI] [PMC free article] [PubMed] [Google Scholar]
- Kenney S., Holley-Guthrie E., Mar E. C., and Smith M. (1989), J Virol 63, 3878–3883. [DOI] [PMC free article] [PubMed] [Google Scholar]
- Lee W. S., Kao C. C., Bryant G. O., Liu X., and Berk A. (1991), Cell 67, 365–376. [DOI] [PubMed] [Google Scholar]
- Lieberman P. M. and Berk A. J. (1991), Genes Dev 5, 2441–2453. [DOI] [PubMed] [Google Scholar]
- Lin Y. and Green M. R. (1991), Cell 64, 971–981. [DOI] [PubMed] [Google Scholar]
- Lin Y., Ha I., Maldonado E., Reinberg D., and Green M. R. (1991), Nature 353, 569–571. [DOI] [PubMed] [Google Scholar]
- Manet E., Gruffat H., Trescol-Biemont M., Moreno N., Chambard P., Giot J. F., and Sergeant A. (1989), EMBO J 8, 1819–1826. [DOI] [PMC free article] [PubMed] [Google Scholar]
- Manet E., Rigolet A., Gruffat H., Giot J. F., and Sergeant A. (1991), Nucleic Acids Res 19, 2661–2667. [DOI] [PMC free article] [PubMed] [Google Scholar]
- Marschall M., Schwarzmann F., Leser U., Oker B., Alliger P., Mairhofer H., and Wolf H. (1991), Virology 181, 172–179. [DOI] [PubMed] [Google Scholar]
- Meisterernst M. and Roeder R. G. (1991), Cell 67, 557–567. [DOI] [PubMed] [Google Scholar]
- Miller G., Rabson M., and Heston L. (1984), J Virol 50, 174–182. [DOI] [PMC free article] [PubMed] [Google Scholar]
- Mitchell P. J. and Tjian R. (1989), Science 245, 371–378. [DOI] [PubMed] [Google Scholar]
- Parvin J. D., Timmers H. Th. M., and Sharp P. A. (1992), Cell 68, 1135–1144. [DOI] [PubMed] [Google Scholar]
- Prywes R. and Zhu H. (1992), Nucleic Acids Res 20, 513–520. [DOI] [PMC free article] [PubMed] [Google Scholar]
- Ptashne M. (1988), Nature 335, 683–689. [DOI] [PubMed] [Google Scholar]
- Ptashne M. and Gann A. F. (1990), Nature 346, 329–331. [DOI] [PubMed] [Google Scholar]
- Pugh B. F. and Tjian R. (1990), Cell 61, 1187–1197. [DOI] [PubMed] [Google Scholar]
- Rooney C. M., Rowe D. T., Ragot T., and Farrell P. J. (1989), J Virol 63, 3109–3116. [DOI] [PMC free article] [PubMed] [Google Scholar]
- Sadowski I., Ma J., Triezenberg S., and Ptashne M. (1988), Nature 335, 563–564. [DOI] [PubMed] [Google Scholar]
- Stringer K. F., Ingles C. J., and Greenblatt J. (1990), Nature 345, 783–786. [DOI] [PubMed] [Google Scholar]
- Tanese N., Pugh B. F., and Tjian R. (1991), Genes Dev 5, 2212–2224. [DOI] [PubMed] [Google Scholar]
- Thomsen D. R., Stenberg R. M., Goins W. F., and Stinski M. F. (1984), Proc Natl Acad Sci USA 81, 659–663. [DOI] [PMC free article] [PubMed] [Google Scholar]
- Webster N., Green S., Tasset D., Ponglikitmongkol M., and Chambon P. (1989), EMBO J 8, 1441–1446. [DOI] [PMC free article] [PubMed] [Google Scholar]
- White J. H., Brou C., Wu J., Burton N., Egly J. M., and Chambon P. (1991), Proc Natl Acad Sci USA 88, 7674–7678. [DOI] [PMC free article] [PubMed] [Google Scholar]
- Williams T. and Tjian R. (1991), Genes Dev 5, 670–682. [DOI] [PubMed] [Google Scholar]
- Zhu H. and Prywes R. (1992), Proc Natl Acad Sci USA 89, 5291–5295. [DOI] [PMC free article] [PubMed] [Google Scholar]