

Abstract
Expression of the skeletal muscle troponin C (TnC) gene is confined to fast-twitch skeletal muscle fibers (Gahlmann et al., 1988) and appears to be subject to an unexpected form of regulation. Unlike enhancers of other muscle genes, the TnC enhancer and basal promoter are muscle cell-specific only when linked to each other. We identified a strong classical enhancer element within the 5′-flanking sequence of this gene at −1.5 kb and a basal promoter near the transcription start site. Both elements are required for the transcriptional activity of TnC test constructs in myogenic cells. When the TnC enhancer was linked to the SV40 early basal promoter, or the TnC basal promoter was linked to the SV40 enhancer, each supported expression in non-muscle cells. Nuclear factors from both muscle and non-muscle cells b in d to one CTF/NF1 binding site and to two functionally related MEF2-like A/T-rich binding sites in the enhancer element. It is currently unknown whether modifications of these nuclear factors, differences in their concentrations, or their interaction with additional factors restrict human fast-twitch TnC expression to skeletal muscle cells. However, it appears that the human fast-twitch skeletal troponin C gene is restricted in non-muscle cells in a distinctive way requiring communication between its enhancer and basal promoter.
The transcriptional expression patterns of contractile protein gene isoforms display precise muscle-specificity as well as subtle fiber-type restriction. Alternate genes have evolved that are responsible for expression of highly similar but distinctive contractile proteins expressed in only one or a few fiber types, such as striated fast or slow skeletal muscle, atrial or ventricular myocardium, or varieties of smooth muscle, and at different stages of muscle development and differentiation (reviewed in Bishopric et al., 1991; Wade and Kedes, 1989). The mechanisms that regulate the specific patterns of expression of these genes remain elusive. The expression of the troponin C family of genes is a prime example of such fiber-type specificity; furthermore, the troponin C proteins themselves impart clear physiologic differences to the myofibers in which they are expressed. Expression of the human fast TnC gene is not only muscle-specific, but the expression of cloned test genes is restricted to only one (C2) out of several myogenic cell lines tested, suggesting that transcriptional mechanisms analogous to those responsible for fiber-type specificity may distinguish such myogenic cell lines (Gahlmann and Kedes, 1990).
The discovery of muscle-specific transcription activating factors (Olson, 1990; Weintraub, 1991; Yu et al., 1992) has established one likely mode of muscle-specific gene expression. It is generally presumed that transcriptional regulation of striated muscle genes is the result of their activation in muscle cells. Repression mechanisms in non-muscle cells has not been a widely considered alternative explanation, although a preliminary report (Braun et al., 1989) suggests that there is a non-muscle repressor interaction in the promoter of the chicken myosin light chain 2-A gene.
Many regulatory elements of muscle genes are known to bind nuclear proteins (Bishopric et al., 1991; Rosenthal, 1989; Wade et al., 1989). Mutations within such sequences have been shown to eliminate or dramatically reduce both the activity of the gene and the binding of one or more nuclear factors to the mutated activator element (Buskin and Hauschka, 1989; Lassar et al., 1989; Sartorelli et al., 1990). Thus it seems likely that the concentration of such factors represents the rate-limiting step of gene activation. There are also examples of seemingly ubiquitous factors that may become activated in certain tissues, or whose access to regulatory DNA elements may be restricted in a tissue-specific fashion. Such mechanisms seem not to control tissue-specificity of muscle genes but may contribute to their expression level (Rosenthal, 1989). Several transcription factors that can bind to regulatory elements have been identified, but only a few of them seem to be muscle-specific. One group of key players of muscle-specific gene expression is the family of helix-loop-helix transcription factors, including MyoD, myogenin, Myf5, and MRF4, all of which, if expressed, have the potential to convert undetermined non-muscle cells into myogenic cells (reviewed in Olson, 1990; Weintraub, 1991). In addition, MEF-2, whose expression is induced by MyoD (Cserjesi and Olson, 1991; Lassar et al., 1991), is a muscle-enriched transcription factor that can also regulate muscle-specific gene expression (Gossett et al., 1989; Yu et al., 1992). Repressor activities seem to restrict the capacity of MyoD or its homologues to induce biochemical differentiation in certain non-muscle (e.g., liver) cells (Schafer et al., 1990). The MyoD family of factors activates its own expression and the expression of other members of this family, and of many muscle-specific genes, e.g., genes encoding muscle creatine kinase (MCK; Lassar et al., 1989), myosin light chain 1/3 (MLC1/3; Wentworth et al., 1991), and cardiac α-actin (Sartorelli et al., 1990). But there are also examples of muscle genes that seem not to be controlled directly by MyoD-like factors (Rosenthal, 1989), e.g., the chicken cardiac troponin T gene (Mar and Ordahl, 1988).
We have previously tested the expression of a human fast troponin C (HFTnC) hybrid gene in several myogenic and non-myogenic cell lines. The construct containing approximately 6.2 kbp of 5′-flanking sequence linked to a CAT reporter gene (Fig. 1) revealed differential, high-level, muscle-specific expression in C2 cells (Gahlmann and Kedes, 1990). We now report that HFTnC gene expression is controlled by an unexpected mode of regulation. The major regulatory elements of the HFTnC gene are capable of being activated in both muscle and non-muscle cells. In non-muscle cells, however, an additional and novel mechanism appears to suppress expression through communication between its enhancer and promoter.
Figure 1.
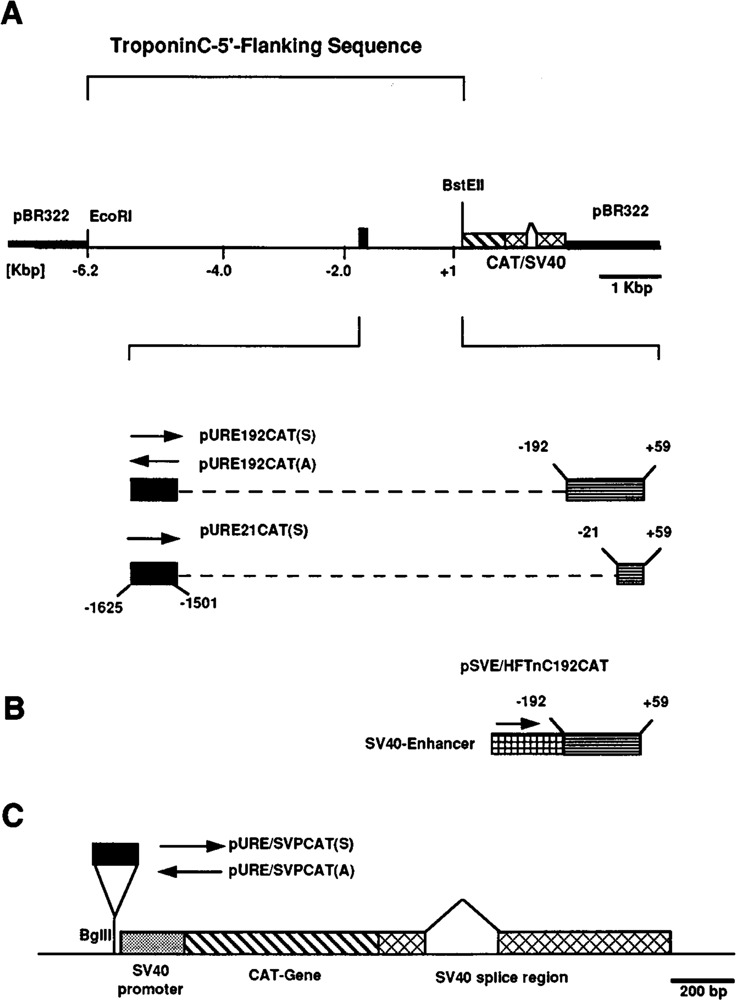
Schematic maps of human fast skeletal troponin C promoter constructs that were tested for expression in transient transfection assays. A. Basic construct comprising 6.2 kbp of 5′-flanking sequence within an EcoR I-BstE II restriction endonuclease fragment (−6200 to +59) linked to the reporter CAT gene (diagonally striped box) and SV40 splice and polyadenylation signals (cross hatched box) in pBR322 (thick line; Gahlmann and Kedes, 1990). The HFTnC upstream regulatory enhancer described in this report is located between −1501 and −1625 bp relative to the transcriptional start site and indicated by a filled box. The maps of clones pURE/192CAT and pURE/21CAT are presented underneath. In these constructs sequences from −1500 to −193 or −1500 to −22 (thin dashed lines) were deleted and replaced by Bgl II linkers. The corresponding reference clone without internal deletion is pHFTnC-1625CAT. The upstream sequence (−1625 to −1501), flanked by Bgl II linkers, is in the sense orientation in both clones in contrast to clone pURE/192CAT(A), in which this element is reversed. B. The SV40 enhancer-TnC basal promoter construct pSVE(S)/HFTnC 192CAT comprises the HFTnC basal promoter sequence from −192 to +59 (as in clone pURE −192CAT) linked to the SV40 enhancer in the sense orientation. C. Schematic map of the constructs tested for enhancer activity. The sequence element −1625/−1501 was cloned into the Bgl II site, located upstream of the SV40 basal promoter in the plasmid pCAT-Promoter (Promega), as indicated. Inserts were positioned in sense (S) or anti-sense (A) orientation.
Materials and methods
Plasmid construction and CAT assays
Construct pHFTnC6200CAT contains 6.2 kbp upstream of the transcriptional start site and 59 bp of the 5′ untranslated region of the human fast troponin C gene cloned in front of the reporter CAT gene and has been described previously (Gahlmann et al., 1990). The number following the HFTnC designation in this construct and 5′ deletion constructs thereof indicates the number of nucleotides 5′ to the initiation of transcription. The internal deletion constructs pHFTnC6200(Δ−4700/−1289)CAT and pHFTnC6200(Δ−4700/+58)CAT were created by first digesting pHFTnC6200CAT with Sac I or BstE II, respectively. A Bgl II linker was ligated to the blunt end DNA, and the DNA was digested with Bgl II and recircularized.
For the 5′ deletion series, a deletion construct pHFTnC4700CAT was generated in which the distal 5′-flanking sequence between −6200 and −4700 (EcoR I–Bgl II fragment) was replaced by an adapter element that restored these two sites and generated three new unique sites in the order: EcoR I-Xba I-Kpn I-Sal I-Bgl II. pHFTn C4700CAT DNA was double-digested with restriction endonucleases Bgl II and Kpn I, and one-directional deletion clones were generated using the Exo III Erase-a-Base System (Promega). The length of TnC 5′-flanking sequences contained in individual constructs was determined by restriction endonuclease mapping. Deletion end points of all clones between −2100 and −1500 were determined more precisely by nucleotide sequencing, and the numbers indicate the position of the most distal nucleotide present in a particular clone.
The construct pURE-B6 was generated by first digesting pHFTnC1625CAT DNA with restriction endonuclease Bsm I, which cleaves the insert (at promoter position −1501) and the vector. The overhanging ends were filled, a Bgl II linker was added, and the construct was re-circularized. The resulting clone pURE-B6 contains the EcoR I–Bgl II fragment (essentially equivalent to probe 3 shown in Figure 5) inserted into pBR322 vector sequences from map unit 4361 (EcoR I site) to 1353 (Bsm I site, converted to a Bgl II site).
Figure 5.

Two DNA–protein complexes form with the enhancer element. Different fragments containing sequences from the HFTnC promoter between −1625 and −1501 were used as probes in gel shift assays. Individual fragments were labeled either at the internal Stu I or Sty I sites or at the flanking Bgl II or Xba I linker sites, as described in Material and Methods. Nuclear extracts from C2, HeLa, and L8 cells were tested for complex formation. Three μg of sonicated salmon sperm DNA was used as nonspecific competitor DNA. Two complexes that were formed with the full-length probe were designated bands 1 and 2 (B1 and B2). The nucleotide sequence of this region is presented in Figure 6.
The internal deletion clones pHFTnC1625S (Δ−1500/−193)CAT and pHFTnC1625S (Δ−1500/−22)CAT were generated by digesting clone pHFTnC1625CAT with restriction endonucleases Stu I or Sma I, respectively. A Bgl II linker was added, and the DNA was digested with restriction endonucleases Bgl II and Xba I. The Xba I-Bgl II fragment depicted in Figure 5 was isolated from plasmid pURE-B6 and cloned in the sense orientation upstream of the basal promoter sequences, as indicated in Figure 1A. Clone pHFTnC1625A(Δ−1500/−193)CAT contains the upstream element (−1625/−1501) flanked by Bgl II sites in the antisense orientation. These clones are also referred to as pURE192CAT(S) and pURE192CAT(A), as shown in Figure 1C.
Construct PSV40E(S)-HFTnC192CAT contains the SV40 enhancer flanked by Bgl II sites upstream of the basal fast TnC promoter (Fig. 1B). The enhancer region was cloned from the pCATControl Vector (Promega) by polymerase chain reaction amplification of bp 2243–2479 within this plasmid using flanking primers that added Bgl II sites immediately adjacent to the SV40 enhancer region. The inserts within this clone were sequenced to ascertain that no point mutations had been introduced during cloning.
Constructs of the pCP-Bgl series (Fig. 1C) were generated by cloning fragment B6 (−1625/−1501) from the fast TnC 5′-flanking sequence, as indicated in Figure 1, into the Bgl II site of pCATPromoter (Promega), upstream of the test gene. The flanking restriction sites of the inserted fragment were modified by filling in and addition of Bgl II linkers.
Plasmids were prepared and purified over three consecutive CsCl gradients. Purity and supercoiling of plasmids were tested and compared on agarose gels. Only highly purified, supercoiled plasmid preparations were used for transfection experiments. Transfection assays were carried out at least in duplicate and generally with multiple plasmid preparations. Internal controls were avoided, since we and others have detected competition between control constructs and test constructs when the β-actin (Muscat et al., 1988), SV40 (Muscat et al., 1988), or RSV promoter (Mar et al., 1988) was used as an internal control for such assays.
Expression was tested in differentiated C2 cells (Yaffe and Saxel, 1977) after transfection of high confluency myoblasts. The medium was changed to low serum fusion medium 16–24 hours after transfection. Fusion was clearly visible after 24 hours in fusion medium, and cells were harvested 24 hours later. CAT assays were performed essentially as described by Gorman et al. (1982), and representative results were quantified by scintillation counting of thin-layer chromatography plates or with the AMBIS Dual Radioanalytic Imaging System.
Preparation of nuclear protein extracts
C2, HeLa, and L8 cells were grown as described before (Gahlmann and Kedes, 1990). Nuclear extracts were prepared from 100% confluent HeLa monolayers and from L8 and C2 myoblasts at 80–100% confluency, as described by Dignam et al. (1983) with some modifications. Cells were washed twice with PBS and scraped off the plates in 1 mM EDTA (ethylene-diamine-tetra acetic acid). Cells were washed in PBS and resuspended in cold buffer A containing 10 mM Hepes (N-2-hydroxyethylpiperazine-N′-2-ethane sulfonic acid, pH 7.9), 1.5 mM MgCl2, 10 mM KC1,1.0 mM DTT (dithiothreitol), 1.0 mM phenylmethylsulfonyl fluoride (PMSF), 2 μg/ml leupeptin, and 2 μg/ml aprotinin. The cells were left on ice for 10 minutes, pelleted, and lysed in buffer A in a Dounce homogenizer. Nuclei were washed in buffer A, pelleted, and resuspended in 4–5 original cell volumes of 20 mM Hepes (pH 7.9), 10% sucrose, 0.45 M NaCl, 1.5 mM MgCl2, 0.2 mM EDTA, 20% glycerol, 1 mM DTT, 1 mM PMSF. Nuclei were left on ice for 60 minutes and then centrifuged for 15 minutes at 15,000 rpm at 0 °C in a JA-20 rotor (Beckman). The supernatant was dialyzed against buffer C (20 mM Hepes, pH 7.9, 20% glycerol, 100 mM KC1, 0.2 mM EDTA, 1.5 mM MgCl2, 1 mM DTT, 1 mM PMSF, 3 μg/ml aprotinin, 3 μg/ml leupeptin.
Gel mobility shift assays
Clone pURE-B6, containing sequences from −1625 to −1501 bp flanked by EcoR I/Xba I and Bgl II linker/adapter sequences, was used to generate probes for the gel shift analysis. End-labeled probes for gel shift analysis were generated by digestion of pURE-B6 DNA with restriction endonucleases Xba I, Stu I, or Bgl II, which cut at one site. Sty I was also used to generate fragment 7A, depicted in Figure 12. One Sty I site is internal, and a second is located in the vector sequence adjacent to the Bgl II site. All fragments were labeled with T4 polynucleotide kinase and [γ-32P]ATP and then gel purified. For footprinting analysis and some gel shift experiments, labeled fragments were cleaved by a second endonuclease before purification.
Figure 12.

Comparison of binding affinities of DABS and PABS wild-type and mutant oligonucleotide pairs to nuclear factors in complex B1. The formation of DNA–protein complex B1 by proximal A/T-rich binding site (PABS) contained in DNA fragment 7A and C2 cell nuclear extracts was competed for with different concentrations of oligonucleotide pairs, as indicated.
Oligonucleotides used as probes or competitor DNAs were synthesized on an Applied Bio-systems 380A DNA synthesizer and gel purified. For use as competitors, complementary strands were mixed in 100 mM NaCl, 10 mM Tris-HCl (pH 7.5), 1 mM EDTA, heated to 90°C for 5 minutes, and slowly cooled to room temperature. For use as probes, oligonucleotide single strands were labeled with [γ−32P]ATP by T4-polynucleo-tide kinase. Annealed, radiolabeled oligonucleotide pairs were gel purified to remove unincorporated label and unpaired single-strand DNA.
Pilot experiments indicated that similar mobility shift patterns were obtained whether salmon sperm DNA, pUC18, or poly(dI-dC) was used as a non-specific competitor (data not shown). Accordingly, salmon sperm DNA was used as non-specific competitor in all experiments presented in this report, since it generated the cleanest results. The optimal protein concentration for gel shift assays was determined empirically for each nuclear extract. Analytical binding reaction mixtures (25 μl) contained 3 μg of sonicated salmon sperm DNA as nonspecific competitor, 2–10 μg of crude nuclear extract, and 0.2–5 ng of labeled probe. The binding buffer consisted of 20 mM Hepes (pH 7.9), 20% glycerol, 100 mM KC1, 0.2 mM EDTA, 1.5 mM MgCl2, 1 mM DTT, and 1 mM PMSF. In some cases specific competitor DNAs were included. After incubation at room temperature for 15 minutes, the reaction mixtures were loaded onto 5% or 6% (19:1) polyacrylamide-bisacrylamide gels and electrophoretically separated in 45 mM Tris base, 45 mM boric acid, 1 mM EDTA until the bromophenol blue dye had migrated 10–20 cm. Gels had been run for 1–2 hours at 100–200 V before use. The gels were fixed after electrophoresis in 10% acetic acid, dried, and autoradiographed.
Gel shift assays were scaled up for methylation interference footprinting analysis. In this case, the probe DNAs were partially methylated with dimethylsulfate (Maxam and Gilbert, 1980) before complex formation. After electrophoresis, complexed and free DNA was localized in gels, eluted, and purified over Elutip cartridges (Schleicher & Schuell), ethanol-precipitated, and cleaved in 100 μl of 20 mM ammonium acetate, 0.1 mM EDTA (pH 7.0) for 15 minutes at 90°C. Ten μl of 10 M piperidine was added, and the incubation was continued for an additional 30 minutes at 90°C, resulting in cleavage at methylated adenine and guanidine residues (Maxam et al., 1980). The DNAs were separated on 8% polyacrylamide urea sequencing gels, as described by Maxam et al. (1980).
Results
Location of HFTnC enhancer and basal promoter elements
We first identified an upstream regulatory element (URE) located between bp −1625 and −1500 upstream of the transcriptional start site by 5′ deletion analysis using transfected CAT reporter constructs (Fig. 2A). This URE is sufficient to support a level of activity in C2 myotubes indistinguishable from the expression of constructs bearing the entire 6.2 kb of 5′-flanking sequences. In addition to the constructs shown in Figure 2A, constructs with 5′ termini at −6200, −4700, −3500, −3300, −3150, −2950, −2350, and −2100 gave the same level of CAT activity (not shown). Furthermore, the URE is essential for high-level expression of the test gene in the C2 cell line: deletion of the URE renders the reporter gene inactive. We tested the URE with a heterologous SV40 basal promoter (pURE/SVPCAT constructs; Fig. 1) and demonstrated that it supports high-level expression both upstream (Fig. 2B, lanes S and A), or downstream (not shown) from the transcription start site and thus has the features of a classical enhancer. Surprisingly, the URE proved to be a strong classical enhancer both in HeLa cells and in C2 cells and is therefore not muscle-specific (Fig. 2B). We assumed that a different element within the test constructs was responsible for the muscle-specificity of the HFTnC gene. The enhancer-less SV40 promoter was inactive (Lane P).
Figure 2.

Transcriptional activity of upstream regions of the human fast skeletal TnC gene. A. A series of 5′ deletion clones was tested for transcriptional activity in C2 cell myotubes. The constructs were generated from clone pHFTnC6200CAT (Gahlmann et al., 1990). The numbers correspond to the number of base pairs upstream of the transcriptional start site (+1) present in each construct. We determined the exact length of the 5′-flanking sequences encompassed in each clone by nucleotide sequencing. Plasmids pSV2CAT (Gorman et al., 1982) and pHCA485CAT (Minty et al., 1986; Minty and Kedes, 1986) served as positive controls. The transfection procedures used have been described before (Gahlmann et al., 1990). In other experiments pHFTnC −1763CAT expressed at levels equivalent to the longer constructs. B. The URE element −1625 to −1501 was cloned into pCAT-Promoter (Promega), an enhancerless basal SV40 promoter CAT construct, upstream (Bgl II site) of the CAT gene in sense (S) and anti-sense (A) orientation (see Fig. 1C). Independently isolated clones were tested in transient transfection assays. Representative results were quantified by scintillation counting of thin-layer chromatography plates or with an AMBIS Dual Radioanalytic Imaging System. Quantification of multiple transfections normalized to pCAT-Control (C = 100%) are presented (standard deviation in brackets). P = pCAT-Promoter.
To locate such an element, we linked the HFTnC URE enhancer in either orientation to its own basal promoter from −192 to +59, and tested expression in both muscle and non-muscle cells. These strongly expressing constructs (pURE-192CAT) manifest muscle cell-specific expression and are inactive in HeLa cells (Fig. 3). Sequences between −192 and −22 are required for the expression of the gene, since a construct in which the URE is linked to the HFTnC promoter at −21 (pURE-21CAT) loses essentially all activity (Fig. 3). Thus, we focused our attention on the basal promoter element of the HFTnC gene as the likely location of sequences that may control muscle-restricted expression. We were again surprised to find that when this promoter region (from −192 to +59) was linked to a heterologous SV40 enhancer, high-level expression of the hybrid gene (pSVE-HFTnC192CAT) is observed in HeLa cells, as well as in C2 cells (Fig. 4). Thus, the HFTnC basal promoter element in conjunction with a strong, ubiquitously active viral enhancer cannot restrict expression to muscle. However, in its normal setting, linked to its own enhancer, expression is both strong and muscle-specific. Conversely, the HFTnC enhancer can restrict expression of the TnC gene to muscle cells only if linked to its own promoter. Thus, both the HFTnC enhancer and basal promoter—which are not muscle-specific by themselves — have to be linked to each other in order to manifest muscle-specific expression.
Figure 3.

The combination of the HFTnC enhancer and promoter is muscle-specific. CAT activity was tested in C2 and HeLa cells of internal HFTnC deletion constructs pHFTnCE–192CAT(S), pHFTnCE–192CAT(A), and pHFTnCE–21CAT(S); See construct maps in Figure 1. Construct pSV2CAT with both SV40 enhancer and promoter served as positive control. Multiple transfections were quantified, and means and standard deviations (in bracket) normalized to pSV2CAT (=100%) are presented.
Figure 4.

The HFTnC basal promoter supports high-level transcription in muscle and non-muscle cells when linked to a heterologous enhancer. CAT activity in C2 cells (myotubes) and HeLa cells of construct pSVE(S)/HFTnC–192CAT (see Fig. 1) were compared to pHFTnC 1625CAT and pSV2CAT (=100%).
Nuclear factors bind to the enhancer element
Gel mobility shift assays allowed us to test whether nuclear factors that may be involved in the transcriptional enhancement of the HFTnC gene bind to the URE. A fragment comprising this sequence flanked by Xba I and Bgl II linkers (Fig. 5, probe 3) and various sub-fragments thereof were tested for protein binding using nuclear extracts prepared from C2 myoblasts that express the test construct and from HeLa and L8 cells in which the test gene is not expressed (Gahlmann and Kedes, 1990).
The results of a typical experiment are shown in Figure 5. When probe 3 was used in mobility shift assays, two complexes of different mobilities were detected (arrows at right side of Fig. 5). A strong signal corresponding to a faster migrating complex (B2) and a less abundant second complex of slower mobility (B1) were visible with extracts from all three cell lines. The B2 complexes formed by HeLa cell extracts are more heterogeneous than the complexes formed by C2 or L8 cell nuclear extracts. The B1 complexes are more abundant relative to B2 complexes in C2 cells than in HeLa or L8 cells.
We localized the protein binding sites by testing convenient subfragments of probe 3. Probe 1A gave rise only to the B1 complex, and probe 1B gave rise only to the B2 complex, while probe 2 formed both complexes. Thus, it is likely that several protein–DNA complexes are formed at separate segments of the enhancer element.
Three sites of protein–DNA interaction in the enhancer
We used a series of methylation interference footprint analyses and gel mobility shift competition assays to define three sites of DNA-protein interaction on the enhancer. For reference, the DNA sequence of the enhancer element (−1625 to −1500) is presented in Figure 6, and the location of the three sites of interaction with nuclear proteins are indicated as stippled regions. In summary, one of the sites appears to be a binding site for the well-described family of transcription factors CTF/NF1 (Jones et al., 1987; Rupp and Sippel, 1987; Santoro et al., 1988) and is responsible for the B2 band in the mobility shift experiment shown in Figure 5. Two other sites appear to interact with the same protein(s) and share an A/T core flanked by a 5′ cytosine and a 3′ guanine. We have referred to these two elements as the distal and proximal A/T-rich binding sequences (DABS and PABS, respectively). Nuclear protein-DNA complexes with either the DABS or PABS sites appear to be responsible for the B1 mobility shift complex (Fig. 5).
Figure 6.

Nucleotide sequence of the human fast skeletal troponin C upstream enhancer. The region between −1625 and −1501 is presented. Internal restriction sites used to map binding sites for nuclear factors and sites in flanking linker/adapter sequences are indicated. The binding site for nuclear factor CTF/NF1 and two A/T-rich binding sites for related or identical nuclear factors are designated by hatched boxes, and the results of methylation interference footprinting experiments are represented by filled and open circles (see Fig. 7A and B). PABS: proximal A/T-rich binding site. DABS: distal A/T-rich binding site. Experiments defining the three binding sites are described in the text.
Identification of a CTF/NF1 interaction site
We used methylation interference footprinting to map the binding sites of nuclear proteins from C2 cells on the upstream regulatory element. End-labeled probes 1B and 2 (Fig. 5) were used to identify binding sites on the top and bottom strands of the higher mobility complex, B2 (Fig. 7A). Nine guanidine residues were identified in the probe that, if methylated, seemed to abolish or reduce protein binding. This sequence (bottom of Fig. 7A) is very similar to the consensus sequence TGGCANNNTGCCA originally described by Sippel and co-workers as the target for the TGGCA-binding protein (Borgmeyer et al., 1984). The similar consensus sequence TGG(A/C)NNNNNGCCAA was described for CTF/NF1 isolated from HeLa cells (Jones et al., 1987). There is now strong evidence that these two nuclear factors are members of the family of CTF/NF1 proteins (Jones et al., 1987; Rupp et al., 1987; Santoro et al., 1988).
Figure 7.

Methylation interference footprinting of B1 and B2 protein complexes. A. Complex B2 was footprinted using probe 2 labeled at the Xba I site (top strand) and probe 1B labeled at the Stu I site (bottom strand). Differences in the sequencing ladder for free probe (F) and bound probe (B) corresponding to nucleotides whose methylation interfered with complex formation are indicated by arrows and are marked by circles in the sequence. Stronger and weaker interferences are distinguished by arrows without and with brackets and by filled and open circles, respectively. B. Complex B1 was footprinted using probe 1A labeled at the Stu I site (top strand) or Bgl II site (bottom strand). The sequencing ladder derived from gel-eluted free probe (F) and bound probe (B) are compared. Differences in the sequencing patterns are indicated by arrows. Methylation interference in the target DNA sequence is indicated at the bottom of the figure.
A competition assay supports the notion that the high mobility complex B2 contains nuclear factor CTF/NF1 bound to this sequence. We used a series of oligonucleotide double strands (Figs. 8 and 9) that embodied either functional or mutated binding sites for nuclear factor CTF/NF1. We previously demonstrated that purified CTF/NF1 protein specifically binds to oligonucleotides G7 and G9, which contain an intact binding site for this factor (Gustafson and Kedes, 1989). Oligonucleotide pairs G10 and Gil carry mutations that prevent binding of purified CTF/NF1, and oligonucleotide G3 carries no CTF/NF1 site.
Figure 8.

Oligonucleotide pairs employed as probes or as competitor DNAs in gel mobility shift experiments. Sequences that correspond to HFTnC sequence elements are underlined. Base changes in mutant oligonucleotides of proximal and distal A/T-rich binding sites (PABS-M1, PABS-M2, DABS-M1) relative to the wild-type oligonucleotide pairs (PABS-WT1, DABS-WT) are marked by arrowheads. Oligonucleotides G3, G7, and Cl contain human cardiac α-actin 5′flanking sequences −316/−290, −430/−400, and −118/−92, respectively (Gustafson and Kedes, 1989).
Figure 9.

The HFTnC enhancer binds nuclear factor CTF/NF1. C2 cell nuclear extract was incubated with probe 3 (see Fig. 5) in the presence of 3 μg of sonicated salmon sperm DNA and 300 ng of the following competitor oligonucleotide pairs: Lane 1, no competitor; lane 2, G3 (see Fig. 8); lane 3, G7 (see Fig. 8); lane 4, G9 (=double point mutant of G7); lane 5, G10 (=double point mutant of G7); lane 6, Gil (=quadruple point mutant of G7); lane 7, no competitor. The oligonucleotides used as competitors carry an intact (+) or mutated (−) CTF/NF1 binding sites: G3, no CTF/NF1 site; G7, CTF/NF1(+); G9, CTF/NF1(+); G10, CTF/NF1(−); Gil, CTF/NF1(−). The binding characteristics of these oligonucleotide pairs were defined previously (Gustafson and Kedes, 1989; T. Gustafson and L. Kedes, unpublished results).
We used these oligonucleotides to compete for binding of nuclear proteins to the −1625/−1501 DNA fragment (Fig. 5, probe 3). As shown in Figure 9, oligonucleotides that include a functional CTF/NF1 binding site (G7 and G9) competed for the formation of the B2 complex (lanes 3 and 4), while oligonucleotides containing a mutated CTF/NF1 binding site (G10 and Gil; lanes 5 and 6) or no CTF/NF1 binding site (G3; lane 2) did not compete for binding. This result strongly suggests that there is a functional CTF/NF1 binding site in the enhancer of HFTnC, and that the B2 complex represents the binding of members of the CTF/NF1 family to that site. We noticed no significant change of signal intensity for complex B1 when any of these oligonucleotides was used as a competitor.
Identification of an A/T-rich nuclear protein binding site
The specific bases that interact with nuclear proteins to form complex B1 were identified by methylation interference analysis using probe 1A (Fig. 5) labeled at either the Stu I (top strand) or the Bgl II site (bottom strand). Methylation of one guanidine residue in each strand (at bases −1534 and −1543) seemed to reduce greatly, but not abolish, complex formation (Fig. 7B). These residues are part of the palindromic sequence CTATATATAG The two contact sites defined by our footprinting analysis are marked at the bottom of Figure 7B and in Figure 6.
We analyzed the specificity and sequence requirements of the PABS–protein complex by gel mobility shift assays in the presence of various competitor DNAs. The complex formed with the PABS on probe 1A was inhibited by itself (Fig. 10, lanes 2, 3, and 4) and by a double-stranded 34-base oligonucleotide PABS-WT1 (Fig. 10, lane 5) that encompasses the PABS sequence (Fig. 8). A synthetic double-stranded oligonucleotide, PABS-M1 (Fig. 8), in which the two G/C pairs were changed to T/A pairs, competed as well as the wild-type oligonucleotide PABS-WT1 (Fig. 10, lane 6) and was able to form B1 complexes (see below and Fig. 12). Oligonucleotide Cl (Fig. 8), containing human cardiac α-actin sequences from −118/−92, including CArG box 1 (Gustafson and Kedes, 1989), did not compete (Fig. 10, lane 7). CArG boxes were originally defined by Minty and Kedes (1986) as encompassing the decamer CC(A or T)6GG, and it has been shown that the core A/T-rich element and all four flanking G/C pairs are required for the element’s ability to enhance transcriptional activity of human α-actin genes (Gustafson et al., 1988; Miwa et al., 1987; Phan-Dinh-Tuy et al., 1988). Our results suggest that whereas methylation of either of the cytosines in the flanking C/G pairs of the palindromic PABS interferes somewhat with complex formation (Fig. 7B), these bases are not essential for B1 complex formation in vitro (Fig. 12). In addition, the experiment confirmed that CArG boxes and the PABS sequence are not functionally related. Furthermore, since the distinct A/T-rich segment of 6 bp present in the CArG box of the Cl fragment does not compete for B1 formation, it is likely that the sequences of the A/T-rich core segment of PABS, rather than just its A/T-richness, contribute to the specificity of complex formation. As described below, mutations in this A/T core prevent B1 complex formation (see Fig. 12).
Figure 10.

Sequence-specificity of PABS–protein complex formation. Probe 1A (lanes 1–7) or probe 1B (lanes 8 and 9) as depicted in Figure 5 was mixed with nuclear extracts from C2 cells and incubated with 3 μg of sonicated salmon sperm DNA in the presence of the following competitor DNAs: lane 1: no competitor; lanes 2, 3, 4: 10-, 100-, and 1000-fold excess, respectively, of unlabeled fragment 1A (self-competition); lane 5: PABS-WT1 (200 ng; approximately 3000-fold excess); lane 6: PABS-M1 (200 ng; approximately 3000-fold excess); lane 7: oligonucleotide Cl (300 ng; approximately 4500-fold excess), which comprises nucleotides −118 to −92 of the human cardiac α-actin promoter, including CArG box 1 (Gustafson and Kedes, 1989); lane 8: unlabeled fragment 1B, 250-fold excess (self competition); lane 9: no competitor DNA.
A distal A/T-rich site appears to form a complex with the same nuclear factor
Since the DNA segment in probe 2 (Fig. 5) does not embody the PABS sequence, but does give rise to a complex with identical mobility to B1, we suspected the presence of an additional site in the enhancer that might be forming a DNA-protein complex with the same nuclear factor. Indeed, the sequence overlapping the Stu I site contains an A/T-rich nonamer flanked by G/C pairs, CTTATTTAG, and represents a reasonable candidate for a putative PABS-related sequence. The overlap of this putative site with the Stu I restriction site (see Fig. 5, bottom) might also explain why no footprint was detectable between the Stu I and Sty I sites when probe 1A was used, and why no low mobility complex was observed with probe 1B, which terminates at the Stu I site, or with a Stu I/Sty I subfragment (not shown).
We tested the ability of C2 cell nuclear extracts to interact with this putative distal A/T-rich binding site (DABS) contained in a BstN I-Sty I fragment (see Fig. 11). As indicated from the data presented in Figure 11, this fragment, designated 7B, forms a nuclear protein-DNA complex that is specifically inhibited by itself and three PABS binding fragments but not by a synthetic oligonucleotides carrying a mutation in the A/T-rich core of either the PABS or DABS binding site. These mutant double-stranded oligonucleotides, PABS-M2 and DABS-M1, were constructed by replacing four A/T pairs in the core by four G/C pairs (CCGG; see Fig. 8). Taken together, these results suggest that both the DABS and PABS bind the same nuclear factor(s), which requires an intact but degenerate A/T-rich core in its target DNA for binding.
Figure 11.

Gel shift analysis demonstrating that the A/T-rich element in both PABS and DABS are critical for complex formation. Probe 7B (BstN I–Sty I fragment) was incubated with C2 cell nuclear extract in the presence of 400 ng of competitor DNA in each lane, as indicated. The sequences of competitor oligonucleotide pairs used in this experiment are presented in Figure 8.
The relative affinities of the DABS and PABS sites for nuclear factors were assessed in a series of competition experiments. Probe 7A encompassing PABS was incubated with C2 cell nuclear extracts in the presence of either 30 ng or 300 ng of various competitor duplex oligonucleotides. Three oligonucleotide competitors, PABS-WT1, PABS-WT2 and DABS-WT, had no mutations in their binding sites. Oligonucleotide PABS-M1 had changes in the G/C-flanking bases of the PABS sequence, while oligonucleotide PABS-M2 had four adjacent bases altered in its A/T-rich core. All these oligonucleotide sequences are presented in Figure 8. As seen in Figure 12, and as expected, all competitor DNAs except PABS-M2 competed. PABS-WT1 and PABS-WT2 competed the most efficiently. PABS-M1 was less efficient as a competitor at lower concentration (30 ng), indicating that mutations in flanking G/C pairs of PABS have a mild but noticeable effect on the binding affinity. DABS-WT was least effective as a competitor, showing that DABS has weaker nuclear factor binding affinity than PABS. These results correlate with the results of the initial gel shift analysis (Fig. 5), in which B1 formation was significantly lower with probe 2.
The PABS-binding protein does not appear to be cell type-specific
We compared nuclear extracts from C2 myoblasts, L8, and HeLa cells to test for differences in the ability to form PABS-protein complexes of cell lines that express HFTnC constructs (C2) versus cell lines that do not express HFTnC constructs, such as L8 and HeLa (Fig. 4; Gahlmann and Kedes, 1990). Two wild-type PABS sequences (PABS-WT1 and PABS-WT2) and two PABS-mutant sequences (PABS-M1 and PABS-M2; see Fig. 8) were used. The result is shown in Figure 13. Both PABS-WT1 and PABS-WT2, as well as PABS-M1, gave rise to B1 complexes in gel shift assays, while PABS-M2 did not reveal complex formation with any of the nuclear extracts tested. B1 complex patterns with the set of four oligonucleotides were indistinguishable for each cell line. Thus, this assay gives us no indication (but does not exclude the possibility) of cell line-specific differences between PABS-binding nuclear factors in HFTnC expressing and non-expressing cell lines. However, the PABS-binding activity is consistently enriched in C2 cells (also see Fig. 5) compared to HeLa and L8 cells.
Figure 13.

Comparison of B1 complex formation with PABS wild-type (W1, W2) and mutant oligonucleotides (M1, M2) as probes. The sequences of these four oligonucleotide pairs are presented in Figure 8. Nuclear extracts from C2, HeLa, and L8 cells were tested.
Discussion
The data presented here suggest that the muscle-specific transcription of the HTnCf gene does not easily conform to the usual paradigm of muscle-specific gene expression. Muscle genes described to date contain muscle-specific regulatory elements, either enhancers or compound promoters, that confer muscle-specificity to heterologous test genes. For example, muscle-specific enhancers have been described, including the enhancers of the genes for mammalian muscle creatine kinase (Horlick et al., 1989; Jaynes et al., 1988; Sternberg et al., 1988), rat myosin light chain 1/3 (Donoghue et al., 1988), quail troponin I (Yutzey et al., 1989), chicken acetylcholine receptor α-subunit (Wang et al., 1988), and human skeletal α-actin (Muscat and Kedes, 1987; Muscat et al., 1992). In all of these cases, the enhancer allows muscle-specific activation of a heterologous promoter. Other muscle-specific genes that do not contain predominant tissue-specific enhancers do carry muscle-specific compound promoters. The human cardiac α-actin gene has a number of muscle-specific upstream regulatory sequence elements that seem not to represent or contain classical enhancers (Miwa and Kedes, 1987) but do include serum response factor, Spl, MyoD1, and CTF/NF1 binding sites (Sartorelli et al., 1990). Thus, multiple, interdigitated promoter regions seem to be critical for cardiac α-actin gene expression (Chow and Schwartz, 1990; Gustafson and Kedes, 1989; Muscat et al., 1987; Sartorelli et al., 1990). Similarly, the regulation of MHC genes seems to be achieved by 5′-flanking elements in which multiple elements interact, but no enhancer element has yet been identified (Bouvagnet et al., 1987).
In the case of the human myoglobin gene, its tissue-specific enhancer worked only when attached to the myoglobin basal promoter and its particular TATA box element (Devlin et al., 1989), providing evidence for the ability of a muscle-specific enhancer and its basal promoter to communicate. Unlike the situation with the HFTnC enhancer, however, the myoglobin enhancer is itself muscle-specific and does not function in other cell types. Our observations on HFTnC gene expression also support the notion that critical communication between enhancer and promoter is responsible for tissue-specificity of transcription. However, the HFTnC mechanism appears to be novel, since cooperation of a particular enhancer and promoter is required to repress activity in non-muscle cells, even though either element can function vigorously with a heterologous partner. This mechanism of muscle-specific gene regulation does not conform to the usual paradigm, i.e., activation in muscle cells, but rather appears to be governed by restriction of activity in non-muscle cells. It seems likely, but is yet unproved, that different transcription factors interact with and activate the enhancer and promoter in muscle versus non-muscle cell environments.
We have begun to analyze the nuclear factors that can bind to the enhancer elements from muscle and non-muscle cells (that is, from cells that differentially express the test genes) in order to look for specific features of the binding patterns that may help to explain this novel mode of control of muscle genes. We detected three binding sites for nuclear factors within the human fast-twitch TnC enhancer element: a CTF/NF1 binding site and two A/T-rich binding sites (DABS and PABS) with different affinities for binding of the same nuclear factors. The two A/T-rich sequence elements in the human fast TnC enhancer resemble an internal regulatory element, CATTTTTAG, in the quail TnI gene (Yutzey et al., 1989). An A/T-rich element (CTAAAAAIAG) is also detectable in the mouse fast TnC enhancer fragment (Parmacek et al., 1990). The relationship between these elements and the PABS/DABS elements remains to be determined.
The binding site for CTF/NF1 was originally described by Sippel and co-workers (Borgmeyer et al., 1984) as TGGCANNTGCCA. It is now well established that CTF/NF1 represents a group of factors present in HeLa cells that are encoded by at least three genes (Rupp et al., 1987; Santoro et al., 1988) and that can activate both transcription and replication (Jones et al., 1987). In our gel mobility assays, complex B2, which appears to be formed by CTF/NF1, was more heterogeneous with HeLa cell extracts than with muscle cell extracts. This suggests that a different, and possibly more heterogeneous, subset of CTF/NF1 is expressed in HeLa cells than in muscle cells. There seems to exist an additional liver-specific nuclear factor that is evolutionarily related to the CTF/NF1 factor subset present in HeLa cells (Paonessa et al., 1988). At this point there is no evidence for a muscle-specific form of CTF/NF1. The nuclear factors giving rise to complex B2 are similarly abundant in C2 and L8 cells. In contrast, the nuclear factor(s) contained in complex B1 is markedly more abundant in C2 cells, which are the only cells that express the TnC test gene. This raises the possibility that factor concentrations or ratios may be critical for the transcriptional activity of the human fast TnC gene. But it is not clear to us how different levels of factors in muscle and non-muscle cells could lead to the observed TnC basal promoter-dependent repression in non-muscle cells. Similarly unknown are whether differences between CTF/NF1 isoforms are critical for differential HFTnC expression, and whether this group of factors or the factors binding to the A/T-rich sites interact with additional factors as part of the regulatory mechanism. One possibility is that different sets of positively acting factors are present in different cell types.
Several regulatory sequences that have been described in other genes resemble the PABS and DABS sequences we observed in the HFTnC enhancer. Currendy, we cannot exclude the possibility that DABS and PABS maybe targets for, high mobility group (HMG) proteins, which have been shown to bind to short stretches of 5 or more A/T residues (Solomon et al., 1986; Wegner et al., 1989). This seems unlikely, however, since no noticeable competition was found when a CArG box oligonucleotide, which also contains an A/T hexamer core, failed to compete even when used in high concentrations (Fig. 10, lane 7). This result also confirmed that PABS and DABS are not functionally related to CArG box elements.
A10 bp motif in the MCK enhancer, TAAAAA TAAC, is the binding site for MEF2, a protein that may be enriched in differentiated myocytes (Cserjesi et al., 1991; Gossett et al., 1989; Yu et al., 1992; Yu and Nadal-Ginard, 1989). Deletion of the element results in a dramatic decrease of enhancer activity. Such MEF2 sites are found in MCK genes of the mouse, human, and rat; in the chicken cardiac MLC2 promoter; and in the rat MLC1/3 enhancer (Braun et al., 1989; Donoghue et al., 1988; Gossett et al., 1989; Horlick et al., 1989). The DABS site does bind MEF2, as judged by competition for binding of myotube nuclear extracts with the MCK MEF2 site (J. Raju and L. Kedes, unpublished data). MEF2 is encoded by a member of an alternatively spliced, multigene family that is expressed in many cell types and whose proteins appear to share similar DNA target site sequences (Yu et al., 1989). Thus it is likely that the complexes we observe in HeLa and myoblast nuclear extracts are formed by MEF2 or its nuclear protein relatives. The function of the HFTnC enhancer elements in non-muscle cells probably depends on transcription factors in addition to MEF2 or MEF2-related proteins. Such observations suggest that the same sequence elements are used by different transcription factors in different cellular contexts. This possibility is enhanced by our preliminary data that site-specific mutations in an MEF2 site cripple transcription in both muscle and non-muscle cells (H. Prentice, T Prygoszy, and L. Kedes, unpublished data). Such observations also make it unlikely that the transcriptional activity we observe is due to random readthrough of transcription.
Certainly the presence of MEF2 in C2 myotubes might play an important role in HFTnC expression. Similarly, the presence of MyoD DNA target sites (E-boxes; Davis et al., 1990) in the enhancer and promoter may also be important for expression in myogenic cells. However, since non-muscle factors are capable of activating the enhancer, the restriction of HFTnC expression to muscle cells must be based on a mechanism involving interactions of the HFTnC enhancer with its promoter. Although the basal promoter can be used to support high-level transcription in non-muscle cells, this occurred when it was linked to a strong viral SV40 enhancer. It cannot be excluded that this non-specificity is due only to the promiscuity and exceptional strength of the viral enhancer. In either event, the muscle-specificity of the HFTnC gene must be imposed by restriction of enhancer activity to muscle cells either by the promoter or by interactions between the enhancer and promoter. Experiments to distinguish these possibilities are under way.
Acknowledgments
We thank Werner Witke and Peter Evans for excellent technical support, Tom Gustafson for oligonucleotides and technical advice, and members of our lab groups for continued and often abundant criticism.
This work was supported in part by grants from the National Institutes of Health; the Muscular Dystrophy Association; the American Heart Association, Greater Los Angeles Affiliate; and by funds provided by the Cigarette and Tobacco Surtax Fund of the State of California through the Tobacco Related Disease Research Program of the University of California.
During the initial phases of this work, R. Gahlmann was supported by a research fellowship from the American Heart Association, California Affiliate, and with funds contributed by the San Mateo San Francisco Chapter. Part of this work was done while R. Gahlmann was a Senior Investigator of the American Heart Association, Greater Los Angeles Affiliate.
The costs of publishing this article were defrayed in part by the payment of page charges. This article must therefore be hereby marked “advertisement” in accordance with 18 USC Section 1734 solely to indicate this fact.
Reinhold Gahlmann is currently at Bayer AG, Institute of Industrial Toxicology, P.O. Box 101709, 5600 Wuppertal 1, Germany.
References
- Bishopric N. H., Gahlmann R., Wade R., and Kedes L. (1991), in The Heart and Cardiovascular System (Fozzard H. A., Haber E., Jennings R. B., Katz A. M., and Morgan H. E., eds.) Raven Press, New York, pp. 1587–1598. [Google Scholar]
- Borgmeyer U., Nowock J., and Sippel A. E. (1984), Nucleic Acids Res 12, 4295–4311. [DOI] [PMC free article] [PubMed] [Google Scholar]
- Bouvagnet P. F., Strehler E. E., White G. E., Strehler-Page M.-A., Nadal-Ginard B., and Mahdavi V. (1987), Mol Cell Biol 7, 4377–4389. [DOI] [PMC free article] [PubMed] [Google Scholar]
- Braun T., Tannich E., Buschhausen-Denker G., and Arnold H.-H. (1989), Mol Cell Biol 9, 2513–2525. [DOI] [PMC free article] [PubMed] [Google Scholar]
- Buskin J. N. and Hauschka S. D. (1989), Mol Cell Biol 9, 2627–2640. [DOI] [PMC free article] [PubMed] [Google Scholar]
- Chow K.-L. and Schwartz R. J. (1990), Mol Cell Biol 10, 528–538. [DOI] [PMC free article] [PubMed] [Google Scholar]
- Cserjesi P. and Olson E. N. (1991), Mol Cell Biol 11, 4854–62. [DOI] [PMC free article] [PubMed] [Google Scholar]
- Davis R. L., Cheng P.-F., Lassar A. B., and Weintraub H. (1990), Cell 60, 733–746. [DOI] [PubMed] [Google Scholar]
- Devlin B. H., Wefald F. C., Kraus W. E., Bernard T. S., and Williams R. S., (1989), J Biol Chem 264, 13896–13901. [PubMed] [Google Scholar]
- Donoghue M., Ernst H., Wentworth B., Nadal-Ginard B., and Rosenthal N. (1988), Genes Dev 2, 1779–1790. [DOI] [PubMed] [Google Scholar]
- Gahlmann R. and Kedes L. (1990), J Biol Chem 265, 12520–12528. [PubMed] [Google Scholar]
- Gahlmann R., Wade R., Gunning P., and Kedes L. (1988), J Mol Biol 201, 379–391. [DOI] [PubMed] [Google Scholar]
- Gorman C. M., Moffat L. F., and Howard B. H. (1982), Mol Cell Biol 2, 1044–1051. [DOI] [PMC free article] [PubMed] [Google Scholar]
- Gossett L. A., Kelvin D. J., Sternberg E. A., and Olson E. N. (1989), Mol Cell Biol 9, 5022–5033. [DOI] [PMC free article] [PubMed] [Google Scholar]
- Gustafson T. A. and Kedes L. H. (1989), Mol Cell Biol 9, 3269–3283. [DOI] [PMC free article] [PubMed] [Google Scholar]
- Gustafson T. A., Miwa T., Boxer L., and Kedes L. (1988), Mol Cell Biol 8, 4110–4119. [DOI] [PMC free article] [PubMed] [Google Scholar]
- Horlick R. A. and Benfield P. A. (1989), Mol Cell Biol 9, 2396–2413. [DOI] [PMC free article] [PubMed] [Google Scholar]
- Jaynes J. B., Johnson J. E., Buskin J. N., Gartside C. L., and Hauschka S. D. (1988), Mol Cell Biol 8, 62–70. [DOI] [PMC free article] [PubMed] [Google Scholar]
- Jones K. A., Kadonaga J. T., Rosenfeld P. J., Kelly T. J., and Tjian R. (1987), Cell 48, 79–89. [DOI] [PubMed] [Google Scholar]
- Lassar A. B., Buskin J. N., Lockshon D., Davis R. L., Apone S., Hauschka S. D., and Weintraub H. (1989), Cell 58, 823–831. [DOI] [PubMed] [Google Scholar]
- Lassar A. B., Davis R. L., Wright W. E., Kadesch T., Murre C., Voronova A., Baltimore D., and Weintraub H. (1991), Cell 66, 305–15. [DOI] [PubMed] [Google Scholar]
- Mar J., Antin P., Cooper T., and Ordahl C. (1988), J Cell Biol 107, 573–585. [DOI] [PMC free article] [PubMed] [Google Scholar]
- Mar J. and Ordahl C. (1988), Proc Natl Acad Sci USA 85, 6404–6408. [DOI] [PMC free article] [PubMed] [Google Scholar]
- Maxam A. M. and Gilbert W. (1980), Methods Enzymol 65, 499–560. [DOI] [PubMed] [Google Scholar]
- Minty A., Blau H., and Kedes L. (1986), Mol Cell Biol 6, 2137–2148. [DOI] [PMC free article] [PubMed] [Google Scholar]
- Minty A. and Kedes L. (1986), Mol Cell Biol 6, 2125–2136. [DOI] [PMC free article] [PubMed] [Google Scholar]
- Miwa T., Boxer L., and Kedes L. (1987), Proc Natl Acad Sci USA 84, 6702–6706. [DOI] [PMC free article] [PubMed] [Google Scholar]
- Miwa T. and Kedes L. (1987), Mol Cell Biol 7, 2803–2813. [DOI] [PMC free article] [PubMed] [Google Scholar]
- Muscat G. E. O., Gustafson T. A., and Kedes L. (1988), Mol Cell Biol 8, 4120–4133. [DOI] [PMC free article] [PubMed] [Google Scholar]
- Muscat G. E. O. and Kedes L. (1987), Mol Cell Biol 7, 4089–4099. [DOI] [PMC free article] [PubMed] [Google Scholar]
- Muscat G. E. O., Perry S., Prentice H., and Kedes L. (1992), Gene Expr 2, 111–126. [PMC free article] [PubMed] [Google Scholar]
- Olson E. N. (1990), Genes Dev 4, 1454–61. [DOI] [PubMed] [Google Scholar]
- Paonessa G., Gounari F., Frank R., and Cortese R. (1988), EMBO J 7, 3115–3123. [DOI] [PMC free article] [PubMed] [Google Scholar]
- Parmacek M. S., Bengur A. R., Vora A. J., and Leiden J. M. (1990), J Biol Chem 265, 15970–15976. [PubMed] [Google Scholar]
- Phan-DinhTuy F., Tuil D., Schweighoffer F., Pinset C., Kahn A., and Minty A. (1988), Eur J Biochem 173, 507–515. [DOI] [PubMed] [Google Scholar]
- Rosenthal N. (1989), Curr Opin Cell Biol 1, 1094–1101. [DOI] [PubMed] [Google Scholar]
- Rupp R. and Sippel A. (1987), Nucleic Acids Res 15, 9707. [DOI] [PMC free article] [PubMed] [Google Scholar]
- Santoro C., Mermod N., Andrews P. C., and Tjian R. (1988), Nature 334, 218–224. [DOI] [PubMed] [Google Scholar]
- Sartorelli V., Webster K. A., and Kedes L. (1990), Genes Dev 4, 1811–1822. [DOI] [PubMed] [Google Scholar]
- Schafer B. W., Blakely B. T., Darlington G. J., and Blau H. M. (1990), Nature 344, 454–458. [DOI] [PubMed] [Google Scholar]
- Solomon M. J., Strauss F., and Varshavsky A. (1986), Proc Natl Acad Sci USA 83, 1276–1280. [DOI] [PMC free article] [PubMed] [Google Scholar]
- Sternberg E. A., Spizz G., Perry W. M., Vizard D., Weil T., and Olson E. N. (1988), Mol Cell Biol 8, 2896–2909. [DOI] [PMC free article] [PubMed] [Google Scholar]
- Wade R. and Kedes L. (1989), Annu Rev Physiol 51, 179–188. [DOI] [PubMed] [Google Scholar]
- Wang Y., Xu H.-P., Wang X.-M., Ballivet M., and Schmidt J. (1988), Neuron 1, 527–534. [DOI] [PubMed] [Google Scholar]
- Wegner M., Zastrow G., Klavinius A., Schwender S., Mueller F., Luksza H., Hoppe J., Wienberg J., and Grummt F. (1989), Nucleic Acids Res 17, 9909–9932. [DOI] [PMC free article] [PubMed] [Google Scholar]
- Weintraub H., Davis R., Tapscott S., Thayer M., Krause M., Benezra R., Blackwell T. K., Turner D., Rupp R., Hollenberg S., Zhuang Y., and Lassar A. (1991), Science 251, 761–766. [DOI] [PubMed] [Google Scholar]
- Wentworth B. M., Donoghue M., Engert J. C., Berglund E. B., and Rosenthal N. (1991), Proc Natl Acad Sci USA 88, 1242–1246. [DOI] [PMC free article] [PubMed] [Google Scholar]
- Yaffe D. and Saxel O. (1977), Nature 270, 725–727. [DOI] [PubMed] [Google Scholar]
- Yu Y. T., Breitbart R. E., Smoot L. B., Lee Y., Mahdavi V., and Nadal-Ginard B. (1992), Genes Dev 6, 1783–1798. [DOI] [PubMed] [Google Scholar]
- Yu Y. T. and Nadal-Ginard B. (1989), Mol Cell Biol 9, 1839–1849. [DOI] [PMC free article] [PubMed] [Google Scholar]
- Yutzey K. E., Kline R. L., and Konieczny S. F. (1989), Mol Cell Biol 9, 1397–1405. [DOI] [PMC free article] [PubMed] [Google Scholar]