

Abstract
We investigated the suppression, transformation, and transactivation functions of isolated segments of wild-type murine p53. Intact p53, but no segment of p53, inhibited cellular transformation by the activated ras and adenovirus E1A proteins. We conclude that most of p53 is needed for suppression of cellular proliferation. Nevertheless, the transactivating domain of herpesvirus protein VP16 was able to substitute for the N-terminal transactivating domain of p53 in cellular suppression. Thus, unless the interchanged p53 and VP16 acidic segments share additional functions, transactivation is required for suppression by p53. Interestingly, we found that all p53 segments containing amino acids 320–360 enhanced transformation by ras and E1A. This region has been associated with the oligomerization of p53 (Milner et al., 1991; Sturzbecher et al., 1992). Furthermore, no p53 segment lacking amino acids 320–360 transformed cells. Amino acids 320–360, therefore, may account for the major transforming activity of p53. Intact p53 and chimeric VP16-p53 transactivated the CAT gene under control of a p53-specific promoter, while transforming segments of p53 interfered with transactivation by wild-type p53. Our findings argue that transactivation by p53 is required for cellular suppression and that any nontransactivating p53 that retains the capacity to oligomerize with wild-type p53 would have transformation potential.
The p53 gene appears to be the most frequently mutated gene in human cancer (Hollstein et al., 1991; Levine et al., 1991). Study of human and murine p53 has provided extensive evidence that wild-type p53 suppresses cell proliferation. The mutation of both p53 alleles in many human and experimental cancers implies that the mutations cause a loss of suppressor function (Mowat et al, 1985; Masuda et al., 1987; Baker et al., 1989). Indeed, suppression of cell proliferation by p53 has been demonstrated directly in a number of ways. The wild-type p53 gene inhibits the initiation of transformation of primary cells in culture by other oncogenes (Eliyahu et al., 1989; Finlay et al., 1989; Hinds et al., 1989), and the overexpression of wild-type p53 in established tumor cells blocks their proliferation in culture (Baker et al., 1990; Diller et al., 1990; Mercer et al., 1990) and tumor induction in animals (Chen et al., 1990).
Many mutant forms of p53 interfere with the suppressor function of endogenous wild-type p53. After cotransfection with other oncogenes, the mutant p53s strongly enhance rather than suppress the transformation of primary cells (Eliyahu et al, 1984; Parada et al., 1984; Jenkins et al., 1985; Finlay et al., 1988). Furthermore, mutant p53s can immortalize cells in culture in the absence of other transfected genes (Jenkins et al., 1984; Finlay et al., 1989). These findings indicate that mutant p53 interferes with wild-type p53. Classically, a dominant-negative phenotype is achieved by the formation of mixed oligomers of wild-type and mutant proteins (Herskowitz, 1987), and oligomerization of p53 has been demonstrated directly by a variety of approaches (McCormick et al., 1981; Eliyahu et al., 1988; Kraiss et al., 1988; Schmieg and Simmons, 1988; Gannon et al., 1990; Milner and Medcalf, 1991; Milner et al., 1991; Stenger et al., 1992; Sturzbecher et al., 1992). Some mutant p53s, however, could interfere with wild-type protein by other mechanisms, for example by competing for one or more substrates of the wild-type protein.
Oncogenic mutations of p53 cluster around “hot spots” in the center of the polypeptide chain (Hollstein et al., 1991; Levine et al., 1991). These clusters overlap segments of the protein that are the most highly conserved among a wide variety of species (Soussi et al., 1990). Therefore, the position of the oncogenic mutations probably reflects a selective pressure in tumors to inactivate functions crucial to the negative regulation of cell proliferation. This idea is consistent with the finding that most transforming mutations severely reduce site-specific DNA binding (Bargonetti et al., 1991; Kern et al., 1991; El-Deiry et al., 1992) and transactivation (Raycroft et al., 1990; Raycroft et al., 1991; Farmer et al., 1992; Kern et al., 1992; Unger et al., 1992; Zambetti et al., 1992). Aside from the identification of transforming mutations, mutational analysis of p53 has been limited. Therefore, little is known about the domain structure of the protein. The first seventy-three amino acids are highly acidic and have been shown to activate transcription (Fields and Jang, 1990; Raycroft et al., 1990). The C-terminal region is moderately basic, and mutations in this region reduce nonspecific DNA binding and oligomerization (Foord et al., 1991; Milner et al., 1991; Sturzbecher et al., 1992). Furthermore, Sturzbecher et al. (1992) have shown that certain small C-terminal segments of p53 can oligomerize. In the present study, we have undertaken a systematic genetic analysis of p53 to define its domain structure and to understand how its domains cooperate to regulate the proliferation of cells. Our goal in this study was to determine biological functions of different segments of p53 in vivo.
Materials and methods
Plasmid construction
We constructed the pAT plasmids to express tagged proteins in animal cells. Plasmid pAT was made by inserting the Maloney sarcoma virus (MSV) promoter (nucleotides 2380 to 2990), p53 cDNA (sequences −67 to −11), a synthetic oligonucleotide, the SV40 small t antigen splicing signals (nucleotides 4710 to 4100), and the SV40 polyadenylation signal (nucleotides 2770 to 2533) in that order between the Cla I and BamH I sites of pBluescript KS+ (Stratagene). The synthetic oligonucleotide encodes a unique Nhe I site, a cassette for cloning and expression of polypeptides (see Results), and a unique BamH I site. The Nhe I site in the MSV promoter and the BamH I site of the pBluescript polylinker were intentionally destroyed by oligonucleotide-directed mutagenesis during construction of pAT The plasmid pATn is identical to pAT except for the addition of the adenovirus E1A nuclear localization signal (Lanford et al., 1990; Dingwall and Laskey, 1991) to the N-terminus of the cloning and expression cassette. The sequences and restriction maps of both plasmids are available on request.
Plasmid pSP72-RAS, consisting of the 6.6 kb BamH I fragment of clone T24 (Goldfarb et al., 1982) subcloned into the BamH I site of SP72 (Promega), expresses the activated ras protein. It was the generous gift of Arnold Levine. Plasmid pBS-E1A was constructed by inserting the EcoR I to Sac I fragment of p1A (Logan et al., 1984) into the polylinker of pBluescript; it expresses the wild-type E1A protein of adenovirus.
Synthesis of p53 domains
Arnold Levine supplied us with wild-type murine p53 cDNA in pMSVcl (Finlay et al., 1988). We copied the entire p53 sequence or segments of it by using PCR with Vent polymerase (New England Biolabs), as described by the supplier. The PCR primers matched the N- and C-termini of chosen segments of p53 N-terminal primers were blunt-ended, and C-terminal primers included a termination codon and a BamH I site. The PCR fragments were cut with BamH I and phosphorylated at their 5′ ends. These fragments were directionally ligated into the dephosphorylated Stu I and BamH I sites in the expression and cloning cassettes of pAT and pATn. The entire sequence of wild-type p53 and the Stu I N-terminal junctions of all cloned segments were verified by sequencing. The correct sequence of the entire p53 gene indicates that our PCR technique does not introduce mutations with significant frequency. To exclude further the possibility of mutations within p53 segments, we isolated and tested two independent clones expressing each p53 segment. The pAT and pATn vectors were used for expression of p53 in Fisher rat embryo fibroblast (REF) cells.
For expression of wild-type and mutant p53s in SF9 cells, we moved Nhe I–BamH I restriction fragments encoding the tagged proteins from pAT into the Nhe I–BamH I sites of the pJVPIOZ plasmid (Vialard et al., 1990). This vector places the p53 segments under the control of the polyhedron promoter of baculovirus. We recombined this vector with baculovirus using a kit supplied by InVitrogen.
Suppression and transformation assays
We used the fourth passage of cells from a single lot of REF cells for all assays. The cells were frozen in aliquots after passage three. Two days before transformation assays, REF cells (1 × 10⁵) were thawed and seeded into 60 mm Falcon plates in DMEM with 10% fetal bovine serum (FBS) and antibiotics. The cells were triply transfected with 2.5 μg of pSP72-RAS, 2.5 μg of pBS-E1A, and 5.0 μg of pAT DNA with or without a p53 insert at its cloning site. The DNAs were mixed with DOTAP (Boehringer Mannheim) for liposome-mediated transfection, as recommended by the supplier. In brief, 50 μl of DOTAP were mixed with 50 μl of 2× Hepes buffered saline (20 mM Hepes, 150 mM NaCl at pH 7.4) in polystyrene tubes. The three DNAs were diluted to 100 μl with Hepes buffered saline, added to the DOTAP mixture, and incubated at room temperature for 10 minutes. These mixtures were diluted to 5 ml with DMEM containing 10% FBS and added to a 60 mm plate of REF cells. The cells were incubated at 37°C in a moist CO2 incubator for 18 hours. The cells were washed once with 4 ml of DMEM and then refed with 5 ml of DMEM with 10% FBS and antibiotics. After 24 hours, the cells were removed from the plates with trypsin-EDTA and transferred to a 10 cm plate. The cells were fed with DMEM and 10% FBS every 3–4 days. After 12 days, the cells were washed twice with 10 ml of PBS, fixed with 6 ml of methanol for 5 minutes, and stained with 6 ml of .05% Coomassie Blue in 50% methanol and 10% acetic acid for 1 hour. The plates were washed with water and air-dried, and transformed foci were counted.
CAT assays for p53 transactivation
HCT-116 cells that express little endogenous p53 (Kern et al., 1992) were transfected using liposome-mediated transfection as described above. The reporter plasmid was PG13CAT (Kern et al., 1992), kindly supplied by Bert Vogelstein. It places the CAT gene under the control of a p53-specific promoter consisting of thirteen tandem p53-binding sites and the TATA sequences of the polyomavirus early promoter. Plasmids (pAT) expressing wild-type p53 or segments of p53 were the same as those used for suppression and transformation assays. HCT-116 cells were cotransfected with 2 μg of PG13CAT and plasmids expressing p53. In some cases, a third plasmid (10 μg) was added to the cotransfection mixture to determine whether or not it would interfere with transactivation by WT p53. Cells were harvested after 48 hours, and CAT activities were measured by phase extraction using a kit supplied by United States Biochemical Corp. Each assay was repeated at least four times; there was less than 20% variation among individual transfections.
Immunoprecipitation and immunoblotting
REF cells in 175 cm2 flasks were transfected with 25 μg of pAT plasmid DNAs expressing wild-type p53 or segments of p53, using DOTAP as described for the suppression and transformation assays above. After 48 hours, the cells were washed with isotonic buffer, and p53 was extracted with 1 ml of lysis buffer (1% triton X-100 in 0.15 M Tris-HCl, 0.15 M NaCl, 0.001 M EDTA, 10% glycerol, pH 9.0) containing 1 mg of leupeptin (Sigma) and aprotinin (Sigma) for 30 minutes at 4°C. The tagged p53s were bound to purified KT3 monoclonal antibodies (MacArthur and Walter, 1984) cross-linked to protein G-sepharose (Pharmacia) overnight at 4°C. After the beads were washed three times with 1 ml of lysis buffer, the tagged p53s were released with 100 μl of SDS loading buffer for gel electrophoresis. The concentrated and partially purified p53s were analyzed by SDS gel electrophoresis and immunoblotting using enhanced chemiluminescence (Amersham), as previously described (Stenger et al., 1992). We used 50 μg of purified KT3 monoclonal antibody in 100 ml for the immunoblotting procedure.
SF9 cells in 25 cm2 flasks were infected with recombinant baculoviruses expressing wild-type and mutant p53s. After 4 days at 27°C, tagged p53s were extracted with 1 ml of lysis buffer as described for REF cells. Cellular proteins in 25 μl of lysate were separated by electrophoresis through 15% SDS polyacrylamide gels without immunoprecipitation. Tagged p53s were identified by immunoblotting with 50 μg of purified KT3 monoclonal antibody in 100 ml.
Results
Design of expression plasmids
We designed an expression vector that would be useful for the characterization of p53 domains in vivo and eventually for biochemical studies as well. The vector has an Nhe I to BamH I cassette in pBluescript to facilitate the cloning, expression, identification, and purification of segments of p53 or of other polypeptides (Fig. 1). The cassette has unique Stu I and BamH I cloning sites that accept appropriately designed PCR-generated DNA segments of the wild-type p53 gene in a single orientation. The cassette also encodes a twenty-two amino acid tag N-terminal to cloned p53 or segments of p53. At the left end of the cassette, a 5′-GCCATGG-3′ sequence provides a favorable context for the initiation of translation (Kozak, 1986). The initiation codon is followed by a block encoding six histidines to create synthetic metal binding sites for purification of tagged polypeptides by metal chelate affinity chromatography (Porath et al., 1975). Next, the cassette encodes an epitope from SV40 large T antigen recognized by the KT3 monoclonal antibody (MacArthur and Walter, 1984) for purification of expressed proteins by immunoaffinity chromatography. Finally, the cassette encodes a factor Xa proteinase site (Maina et al., 1988) for removal of the N-terminal protein tag from the p53 domains should that be desirable. We designate this vector pAT. We used vector pATn to add a strong E1A nuclear localization signal to the N-terminus of tagged p53 segments lacking natural nuclear localization signals (Shaulsky et al., 1990).
Figure 1.
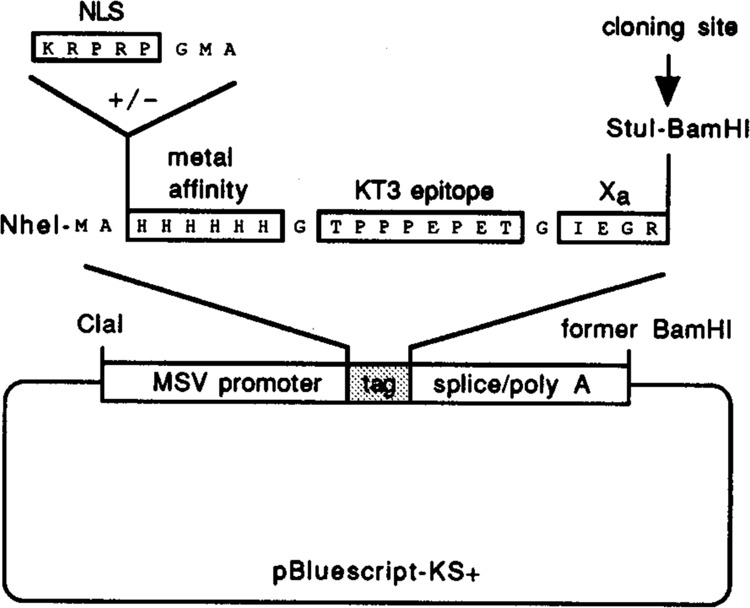
Vector for the expression of p53 and domains of p53. The vector contains the MSV promoter, a cassette for insertion of protein segments, an RNA splice signal, and a polyadenylation signal. Insertion of coding sequences in-frame in the cassette creates a tagged protein. The tag contains an optional E1A nuclear localization signal (NLS), six histidines for metal affinity purification, the KT3 epitope, and a site for cleavage by proteinase Xa.
Function of tagged p53
It was important to establish that the N-terminal synthetic tag did not interfere with p53 functions. Finlay et al. (1989) used triple transfections of REF cells to show that wild-type p53 suppresses uncontrolled cellular proliferation induced by activated ras and adenovirus E1A. In contrast, mutant p53 with an alanine-to-valine substitution at amino acid 135 (p53Val135) significantly enhances transformation by ras and E1A. We used this simple assay to quantitate the suppression and transformation functions of wild-type and mutant p53s in the presence and absence of an N-terminal tag (Table 1). Suppression was measured by dividing the number of foci produced by E1A, ras, and pBluescript by the number of foci produced by E1A, ras, and p53. Cotransfection of plasmids expressing untagged, wild-type p53 with plasmids expressing ras and E1A suppressed transformation more than 2-fold under these experimental conditions. The same concentration of input plasmid expressing the tagged p53 suppressed transformation by more than 30-fold. In a second experiment, enhancement of transformation was quantitated by dividing the number of foci produced by E1A, ras, and p53Val135 by the number of foci produced by E1A, ras, and pBluescript. Mutant p53Val135 without a tag enhanced transformation by ras and E1A about 4-fold, while tagged mutant p53Va1135 increased transformation about 6-fold. We conclude that the synthetic tag not only does not interfere with p53 function but actually enhances it. We suspect that tagged p53 is translated more efficiently than untagged p53 because the pAT plasmid has a more favorable sequence context for translation of the initiator codon of the tag (5′-GCCATGG-3′) than does the natural p53 sequence (5′TGGATGA-3′). All wild-type and truncated p53s used in subsequent experiments were tagged.
Table 1.
p53 suppression or enhancement of transformation by E1A and ras in the absence and presence of an N-terminal tag on p53.
| Test plasmids | Tag | Transformed foci | Change | |
|---|---|---|---|---|
| Experiment 1 | Suppression | |||
| pBluescript | − | 65 | 69 | |
| wild-type p53 | − | 28 | 33 | 2.2 |
| wild-type p53 | + | 0 | 4 | 33.5 |
| Experiment 2 | Enhancement | |||
| pBluescript | + | 28 | 30 | |
| p53Val135 | − | 104 | 121 | 3.9 |
| p53Val135 | + | 190 | 165 | 6.1 |
Function of p53 domains
We wanted to identify autonomous functional domains of p53 to develop a better understanding of p53 mechanisms of suppression and transformation. Little is known about p53 domain structure at the biochemical level, but analysis of mutations in human tumors and transformed cells suggests that p53 is divided into three distinct regions. The majority of transforming mutations have been mapped between amino acids 130 and 290, and many of these mutations cluster in four highly conserved regions (Soussi et al., 1990; Levine et al., 1991). In contrast, few transforming mutations have been identified in the remaining N-terminal and C-terminal segments. This distribution of mutations suggests that the three regions have different molecular activities and provides a logical basis for the initial division of p53 into segments (Fig. 2A). To begin, we chose to make three protein segments in overlapping pieces (amino acids 1–110, 80–320, and 280–390) to minimize the risk of interrupting important sequences. We also designed plasmids that would express the p53 segments in every possible combination of the three segments. Because the central domain is large, we further divided it between conserved regions III and IV into two overlapping halves (amino acids 1–220 and 180–390). In effect, these divisions allowed us to investigate the function of p53 in overlapping quarters and combinations of quarters. Finally, we substituted the transactivating domain of p53 with the trans-activating domain of herpesvirus VP16 (Pellet et al., 1985) to see if p53 would tolerate domain swapping. The acidic domains of some transcription-activating proteins are known to be interchangeable, even though their sequences are quite different (Sadowski et al., 1988; Fields and Jang, 1990).
Figure 2.
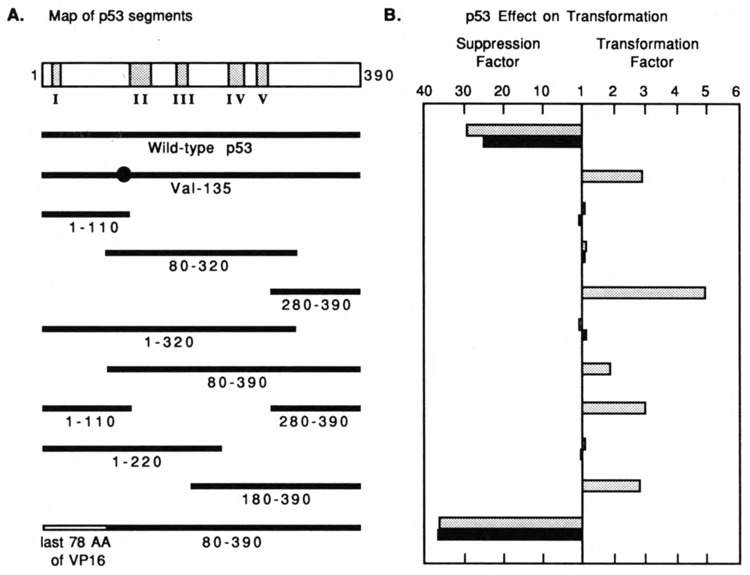
Suppression and transformation by murine p53 and domains of p53. A. Structures of the p53 polypeptides. WT p53 has five regions of conservation; mutations in regions II–V are frequent sites of mutations in human tumors and in transformed mouse cells. The solid lines represent p53 segments expressed by different plasmids. B. Suppression and transformation activities of the polypeptides shown in A. Test plasmids expressing no p53, wild-type p53, or isolated segments of p53 were cotransfected with plasmids expressing activated ras and E1A into REF cells. Transformed foci were counted 12 days after transfection. The levels of suppressed or enhanced transformation were determined by comparing the number of foci induced by p53 segments, ras, and E1A to the number of foci induced by ras and E1A, as described in the text. Shaded bars indicate p53s without an E1A NLS; solid bars indicate p53s with an E1A NLS added to their N-terminal tags.
We first moved these domains into the pAT expression vector with an N-terminal tag that did not include a nuclear localization signal. Again, we used triple transfections of REF cells to determine which p53 segments were able to suppress or enhance transformation by ras and E1A. Figure 2 summarizes our results. The segments of p53 expressed in each of our plasmids are shown in Figure 2A, and their functional activities in vivo are shown by the shaded bars in the histogram in Figure 2B. Quantitation of suppression and enhancement of transformation were as described for Table 1. Note that the scales measuring suppression and transformation in Figure 2B are different. The histogram was derived from at least four independent experiments using two independently derived clones of each p53 expression vector. Transfection of plasmids expressing E1A and ras in the absence of p53 induced transformation of an average of 49 foci/assay. Wild-type p53 suppressed transformation about 25-fold, while the prototypical mutant p53Val135 increased transformation more than 3-fold. None of the segments of p53, including the largest segments consisting of amino acids 1–320 and 80–390, suppressed cellular transformation to a significant extent. In contrast, the substitution of the N-terminal transactivating domain of p53 with the transactivating domain of VP16 resulted in a chimeric protein that suppressed transformation somewhat better than wild-type p53 did. Interestingly, all segments of p53 that include amino acids 280–390 enhanced transformation. The transformation frequency increased as the central regions of p53 were removed.
No segments of p53 lacking amino acids 280–390 increased transformation. Some p53 segments did not include all the nuclear localization signals (NLS) of p53. Shaulsky et al. (1990) have presented evidence that amino acids 312–321 and 366–381 are important for the nuclear localization of p53. Therefore, we added a sequence encoding a strong NLS from the adenovirus E1A protein to the N-terminus of the p53 gene in our expression vectors. The adenovirus E1A NLS has been shown to transport certain fusion proteins into the nucleus within 15 minutes after microinjection (Lanford et al., 1990; Dingwall and Laskey, 1991). The addition of the artificial NLS did not influence the suppression or transforming activities of any p53 tested (solid bars in the histogram of Fig. 2B). These independently constructed plasmids also serve to demonstrate the reproducibility of our results. Nuclear localization signals were not added to p53Val135 or to segments 280–390, 80–390, 1–110/280–390, and 180–390 since these all had natural p53 NLSs.
It is important to note that transformation by segments of p53 not only increased the frequency of transformation by ras and E1A but also changed the morphology of the transformed foci dramatically. Figure 3 shows an example of these assays. Cells transfected by pBluescript were indistinguishable from untransfected cells (not shown). Co-transformation by ras and E1A produced small, dense foci that could be easily identified. Tagged, wild-type p53 suppressed the ras and E1A activities very efficiency; only 2–3 possible transformed foci were evident. The addition of p53280–390 to ras and E1A increased the number of foci 5- to 6-fold, and many of the foci were considerably enlarged. All segments of p53 that increased the frequency of transformation (Fig. 2) induced a significant number of enlarged foci. Therefore, colony morphology confirmed the quantitative changes induced by the p53 segments.
Figure 3.

Examples of transformed foci induced by selected plasmids shown in Figure 2. Test plasmids, identified in the figure, were cotransfected into REF cells. Transformed foci were stained with Coomassie Blue 12 days after transfection.
Fine mapping of the p53 transformation domain
We made additional mutants to map the transforming domain of p53 more precisely (Fig. 4A). We quantitated the transforming potential of the truncated polypeptides by measuring their enhancement of transformation by ras and E1A (an average of 41 foci/assay) or by ras alone (an average of 2 foci/assay), as described for Table 1. We identified the N-terminal and C-terminal boundaries of the transformation domain by progressively shortening the p53 segment from one or both ends. Note that the p53 segments enhanced transformation by ras alone more than they enhanced transformation by E1A and ras, and that the scales of the two histograms are different. The shaded bars in Figure 4B show an interesting pattern of transforming activities as p53 was shortened. p53 segments became progressively more active in the enhancement of transformation as the N-terminus was shortened to amino acid 315. The segment from amino acids 315–390 was the most active transforming segment. The 315–360 and 320–360 segments had somewhat less transforming activity than the 315–390 segment but maintained a significant level of enhancement in both assays. The 315–350 segment had low, but reproducible, levels of transformation enhancement. The remaining segments from amino acids 330–390, 330–360, 330–350, and 350–390 failed to enhance transformation by either ras and E1A or by ras alone. We conclude that residues 315–390 constitute the optimal transformation domain of p53, and that residues 320–360 represent a strong core transformation domain.
Figure 4.

Fine mapping of the transformation domain of p53. Test plasmids expressing no p53, p53Val135, or isolated segments of p53 were cotransfected with plasmids expressing ras and E1A or ras alone into REF cells. The total DNA added to all cultures was 10 μg. Transformed foci were counted 12 days after transfection. We quantitated the transforming potential of the truncated polypeptides by measuring their enhancement of transformation by ras and E1A or by ras alone in the absence (shaded bars) or in the presence (solid bars) of an artificial nuclear localization signal.
Again, some p53 segments did not include a complete set of natural p53 nuclear localization signals. Therefore, we added a strong NLS from the adenovirus E1A protein to the N-terminal tag of these p53 segments. The addition of the E1A NLS did not influence the transforming activities of segments 315–390,315–360, 320–360, 330–390, 330–360, 330–350, or 350–390 (solid bars in the histogram of Fig. 4B). These results are in agreement with the finding that the 320–360 segment, without a NLS, enhanced transformation as well as the 315–360 segment, with a partial NLS, did.
Transactivation by p53 domains
We investigated transactivation by wild-type p53 and segments of p53 to determine how the transactivation function correlates with p53 suppression and transforming functions (Fig. 5). We used the CAT gene under the control of a p53-specific promoter as a reporter for transactivation (Fig. 5A). Kern et al. (1992) have shown that thirteen p53-DNA recognition sequences upstream from a TATA sequence act as a strong promoter in HCT-116 cells. Co-transfection of the reporter plasmid with a plasmid expressing wild-type p53 stimulated CAT activity about 20-fold. We have shown this level as 100% in Figure 5B. The chimeric protein in which the p53 transactivating domain is replaced by the transactivating domain of VP16 stimulated CAT activity almost twice as well as wild-type p53. This result is consistent with our finding that the chimeric protein is a better suppressor of transformation than wild-type p53. We used triple transfections to determine whether p53 segments, in a 5-fold molar excess, could block CAT transactivation by wild-type p53. The p53 gene segment encoding amino acids 1–110 did not inhibit wild-type transactivation. In contrast, the gene encoding p53 amino acids 315–390 almost completely blocked wild-type transactivation. Thus, wild-type and chimeric p53s that suppress transformation are strong transactivators of this reporter plasmid, while the 315–390 segment that enhances transformation interferes with wild-type transactivation.
Figure 5.
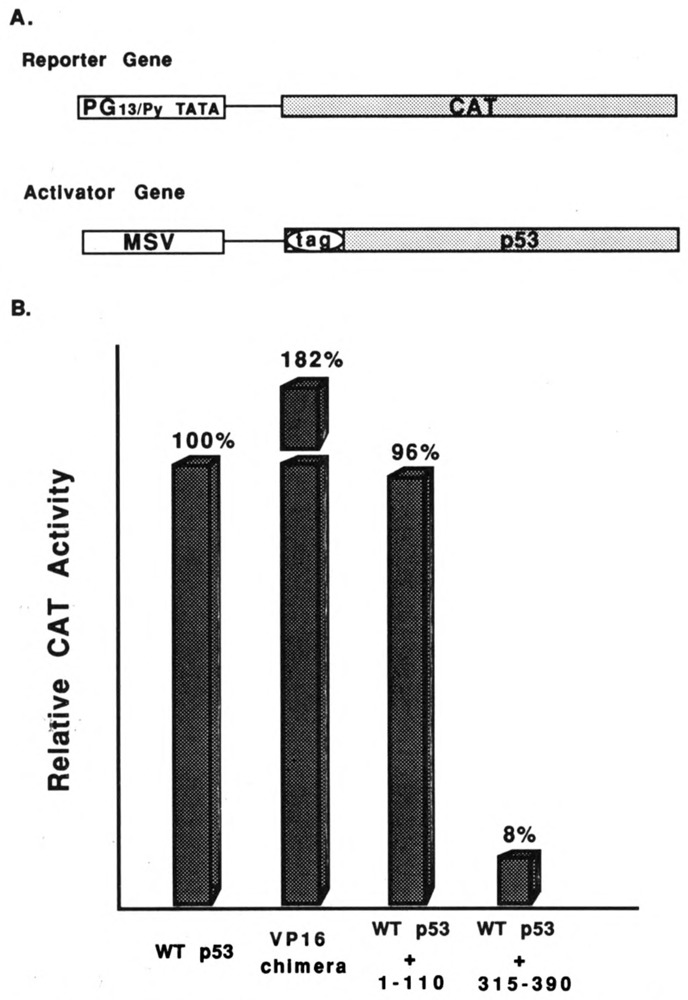
Transactivation by wild-type and mutant p53s. HCT-116 cells were transfected with plasmids expressing the CAT gene under the control of the p53-specific PG13/Py promoter and wild-type p53 or segments of p53. A. General structure of the CAT reporter gene and the genes expressing wild-type p53 or segments of p53. B. Levels of CAT activity induced by the various p53s or combinations of p53 indicated at the bottom of the histogram.
Intracellular expression of p53 domains
Most of our p53 segments maintain either suppression or transformation functions. These segments, therefore, must be expressed in significant quantities in REF cells, and conclusions based on these positive results are valid. Some p53 segments, however, neither suppress nor enhance transformation. We investigated the intracellular expression of p53 segments 1–320, 80–390, and 330–390 because these three segments include all of the p53 regions that have no function in suppression and transformation assays. We used KT3 monoclonal antibodies that recognize the tagged p53s to quantitate intracellular expression (Fig. 6). With the exception of the segment consisting of amino acids 80–390, we were unable to identify the transfected, tagged p53 segments in REF cells using a combination of immunoprecipitation and immunoblotting techniques (Fig. 6A). The 80–390 segment is evident only because there is very little background in this position of the blot. Endogenous wild-type p53 encoded by the REF cells is not present in the immunoblots because it does not have a KT3 epitope. These results were not unexpected for a number of reasons. The MSV promoter is not a strong promoter; only a minority of REF cells would be successfully transfected; many p53s have very short half-lives; and the KT3 monoclonal antibody has only moderate affinity for its epitope (MacArthur and Walter, 1984). Therefore, we expressed selected, tagged p53 segments in SF9 cells under the control of a strong promoter. The immunoblot in Figure 6B demonstrates that the p53 segments are expressed, and that the segments have sizes consistent with their predicted molecular composition. Furthermore, there is no evidence of intrinsic instability of the various segments under these conditions.
Figure 6.
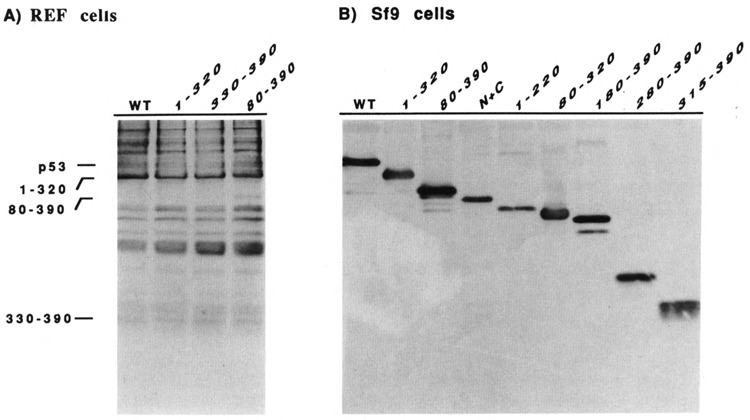
Expression of tagged p53 in REF and SF9 cells. A. REF cells were transfected with pAT plasmids expressing wild-type p53 or segments of p53. The tagged p53s were concentrated by immunoprecipitation and analyzed by immunoblotting with KT3 monoclonal antibodies, as described in Materials and Methods. B. SF9 cells were infected with baculovirus expressing wild-type p53 or segments of p53. Tagged p53s were identified directly by immunoblotting with KT3 monoclonal antibodies, as described in Materials and Methods. The N + C abbreviation designates the p53 segment containing N-terminal (1–110) and C terminal (280–390) segments of p53.
Discussion
We have investigated the suppression and transformation properties of isolated segments of wild-type murine p53. We cotransfected plasmids expressing p53 along with plasmids expressing ras and E1A to monitor both activities simultaneously or with plasmids expressing ras alone to monitor transformation. Although levels of p53 expression in transfected REF cells were too low for quantitation, we could identify wild-type p53 and segments of p53 that were expressed under the control of a strong promoter in SF9 cells. Our findings argue that our plasmids express p53s of the appropriate size and with similar stabilities. Most importantly, our major conclusions are based on positive events: suppression of cell proliferation and enhancement of transformation. Furthermore, both our positive and negative findings demonstrate striking domain patterns that are not likely to represent differences in protein expression. Only intact or chimeric p53s with all functional domains suppress transformation; all sixteen sub-segments of p53 fail to suppress. Eight out of eight segments that include amino acids 320–360 enhance transformation, while eight out of eight segments without these amino acids fail to enhance transformation.
None of the p53 segments had any detectable suppression function. We know that the largest segment, consisting of amino acids 80–390, is expressed in the transfected REF cells. It was detected by immunoblotting, and it enhances rather than suppresses transformation. We conclude that most of p53 is needed for suppression of cellular growth. It is known that p53 oligomerizes (McCormick et al., 1981; Eliyahu et al., 1988; Kraiss et al., 1988; Schmieg and Simmons, 1988; Gannon et al., 1990; Milner et al., 1991; Stenger et al., 1992; Sturzbecher et al., 1992), binds specific DNA sequences (Stein-meyer and Deppert, 1988; Bargonetti et al., 1991; Kern et al., 1991; El-Deiry et al., 1992; Funk et al., 1992), and activates downstream genes (Fields and Jang, 1990; Weintraub et al., 1991; Farmer et al., 1992; Funk et al., 1992; Kern et al., 1992; Zambetti et al., 1992). The transactivation function may be modulated by other cellular proteins, such as mdm-2 (Momand et al., 1992; Oliner et al., 1992). Fields and Jang (1990) have proposed that transactivation would lead to the expression of a number of genes that negatively regulate cellular proliferation. Our present findings are consistent with the idea that all of these functions are needed for suppression of both cellular proliferation and tumor formation. Indeed, we have shown directly that wild-type p53 and chimeric VP16-p53 that suppress transformation strongly transactivate a p53-specific promoter. Our findings are consistent with those of others–that most of p53 is needed for intracellular transactivation (Aoyama et al., 1992). However, mouse p53 with a deletion of the C-terminal 30 amino acids has been reported to retain tumor suppressor activity (Barak and Oren, 1992).
Deletion of the p53 transactivation domain within amino acids 1–80 completely abolished p53 suppression of transformation by E1A and ras. Because we have demonstrated the accumulation of the 80–390 segment of p53 in REF cells, we know that the loss of suppression represents an intrinsic loss of p53 function. Substitution of the transactivation domain of herpesvirus VP16 for the p53 transactivation domain fully restored the suppression function. Aside from a net negative charge, the amino acid sequences of the transactivating domains of VP16 (Pellet et al., 1985) and p53 (Soussi et al., 1990) are quite different, and it seems unlikely that these small domains share more than the transactivating function. Thus, unless the p53 and VP16 acidic segments share functions in addition to transactivation, our findings directly implicate transactivation in the suppression of cellular proliferation by p53. However, our findings do not exclude the possibility that p53 has additional functions in the suppression of cellular proliferation. Indeed, p53 represses rather than activates the expression of many promoters, and a combination of promoter activation and repression by p53 may modulate cellular proliferation (Seto et al., 1992). Furthermore, p53 may play additional roles in the regulation of DNA replication (Friedman et al., 1990) and in cellular repair mechanisms (Lane, 1992).
Interestingly, we found that any p53 segment that includes amino acids 320–360 enhances transformation by ras or by ras and E1A. These results are consistent with the recent findings of Shaulian et al. (1992) that amino acids 315–390 of mouse p53 are sufficient for transformation. We also found that, in the absence of these amino acids, none of the segments that we tested could transform cells. Amino acids 320–360, therefore, appear to account for the major transforming potential of p53. The extremely small size of this domain argues that it transforms through a loss rather than gain of function. This segment contains only 29 amino acids (positions 321–349 in the mouse and 324–352 in human) that are highly conserved in diverse species (Fig. 7). When similar p53 segments from many species are aligned, amino acids 321–349 of the mouse are bracketed by insertions or deletions in some other species. Recent evidence supports the idea that such insertions and deletions are important clues for the identification of functional segments within proteins (Thornton et al., 1992). Furthermore, we can delete amino acids 350–360 without a complete loss of transformation. These observations suggest that amino acids 321–349 are the most crucial for transformation. Nevertheless, other sequences in the segment of amino acids 3500–390 also contribute to p53 transformation. Recently, Sturzbecher et al. (1992) have implicated human p53 amino acids 334–356 both in dimerization and tetramerization of p53 and amino acids 363–386 in tetramerization. Overlapping regions, therefore, have been implicated in p53 oligomerization and transformation. Together, these findings strongly support the concept that incorporation of nonsuppressing and nontransactivating p53 subunits in p53 oligomers is necessary and sufficient for p53-induced transformation.
Figure 7.

Genetic and structural organization of p53. The protein is divided into three regions: an N-terminal acidic transactivation domain, a central domain with conserved sequences and highly specialized functions, and a C-terminal oligomerization domain. The optimal transformation domain coincides with the oligomerization domain. The sequences of the core transforming domain from 315–360 are shown and compared with similar sequences of p53s from other species. The shaded sequences are the most conserved.
How does mutant p53 interfere with the function of wild-type p53? We have shown directly that a p53 segment that enhances transformation also interferes with transactivation by wild-type p53. Although p53 has been reported in a variety of oligomeric states in crude extracts, purified p53 forms mostly tetramers or multiples of tetramers (Stenger et al., 1992). Tetramers would be well suited to bind two adjacent sets of inverted repeats found in the strongest DNA recognition sites identified to date (El-Deiry et al., 1992; Funk et al., 1992). The incorporation of one or more segments of p53 in tetramers would have variable effects on DNA binding, depending on the residual molecular activities of the truncated p53. Tetramers including large truncated segments, such as those between amino acids 80–390 and 180–390, may retain some DNA binding, transactivation, and suppression functions, while small segments, such as 315–390 and 315–360, would retain fewer functions. However, once the oligomerization domain is invaded, the p53 segment would no longer oligomerize or interfere with wild-type function. This idea would explain why the 315–390 segment, which is believed to contain both dimerization and tetramerization domains (Sturzbecher et al., 1992), transforms better than the 320–360 dimerization segment does.
Our findings explain the pattern of amino acid substitutions found in naturally occurring human tumors and in spontaneously transformed rodent cells (Fig. 7). Although the entire p53 protein is needed for growth suppression, mutations are frequently identified in the central segment of p53. These mutations would inactivate specific suppression functions like DNA binding (Bargonetti et al., 1991; Kern et al., 1991; Kern et al., 1991; El-Deiry et al., 1992) and transactivation (Raycroft et al., 1990; Ray-croft et al., 1991; Farmer et al., 1992; Kern et al., 1992; Unger et al., 1992; Zambetti et al., 1992) but would not block oligomerization. The products of alleles with mutations in the central segment would enhance actively growing tumor cells by forming mixed oligomers with wild-type p53. Amino acid substitutions with transforming activity are not found in the N-terminal domain; this segment can be exchanged with other transactivating domains and is, therefore, relatively nonspecific. Furthermore, the strongly acidic nature of the N-terminus of wild-type p53 would not be significantly affected by spontaneously occurring amino acid substitutions. Transforming mutations do not occur frequently in the C-terminal segment; these mutations would interfere with oligomerization functions that are essential for trans-dominance. We conclude that any nonsuppressing and nontransactivating p53 that retains the capacity to oligomerize with endogenous wild-type p53 would have transformation potential.
Acknowledgments
We would like to thank Stan Fields for helpful discussions of this study.
This investigation was supported by public health service grants NIH CA-28146 and NIH CA-18808 awarded by the National Cancer Institute.
The costs of publishing this article were defrayed in part by the payment of page charges. This article must therefore be hereby marked “advertisement” in accordance with 18 USC Section 1734 solely to indicate this fact.
References
- Aoyama N., Nagase T., Sawazaki T., Mizuguchi G., Nakagoshi H., Fujisawa J., Yoshida M., and Ishii S. (1992), Proc Natl Acad Sci USA 89, 5403–5407. [DOI] [PMC free article] [PubMed] [Google Scholar]
- Baker S. J., Fearon E. R., Nigro J. M., Hamilton S. R., Preisinger A. D., Jessup J. M., vanTuinen P., Ledbetter D. H., Barker D. F., Nakamura Y., White R., and Vogelstein B. (1989), Science 244, 217–221. [DOI] [PubMed] [Google Scholar]
- Baker S. J., Markowitz S., Fearon E. R., Willson J. K. V., and Vogelstein B. (1990), Science 249, 912–915. [DOI] [PubMed] [Google Scholar]
- Barak Y. and Oren M. (1992), EMBO J 11, 2115–2121. [DOI] [PMC free article] [PubMed] [Google Scholar]
- Bargonetti J., Friedman P. N., Kern S. E., Vogelstein B., and Prives C. (1991), Cell 65, 1083–1091. [DOI] [PubMed] [Google Scholar]
- Chen P. L., Chen Y. M., Bookstein R., and Lee W. H. (1990), Science 250, 1576–1580. [DOI] [PubMed] [Google Scholar]
- Diller L., Kassel J., Nelson C. E., Gryka M. A., Litwak G., Gebhardt M., Bressac B., Ozturk M., Baker S. J., Vogelstein B., and Friend S. H. (1990), Mol Cell Biol 10, 5772–5781. [DOI] [PMC free article] [PubMed] [Google Scholar]
- Dingwall C. and Laskey R. A. (1991), Trends Biochem Sci 16, 478–481. [DOI] [PubMed] [Google Scholar]
- El-Deiry W. S., Kern S. E., Pietenpol J. A., Kinzler K. W., and Vogelstein B. (1992), Nat Genet 1, 45–49. [DOI] [PubMed] [Google Scholar]
- Eliyahu D., Goldfinger N., Pinhasi-Kimhi O., Shaulsky G., Skurnik Y., Arai N., and Rotter V. (1988), Oncogene 3, 313–321. [PubMed] [Google Scholar]
- Eliyahu D., Michalovitz D., Eliyahu S., Pinhasi-Kimhi O., and Oren M. (1989), Proc Natl Acad Sci USA 86, 8763–8767. [DOI] [PMC free article] [PubMed] [Google Scholar]
- Eliyahu D., Raz A., Gruss P., Givol D., and Oren M. (1984), Nature 312, 646–649. [DOI] [PubMed] [Google Scholar]
- Farmer G., Bargonetti J., Zhu H., Friedman P., Prywes R., and Prives C. (1992), Nature 358, 83–86. [DOI] [PubMed] [Google Scholar]
- Fields S. and Jang S. K. (1990), Science 249, 1046–1049. [DOI] [PubMed] [Google Scholar]
- Finlay C. A., Hinds P. W., and Levine A. J. (1989), Cell 57, 1083–1093. [DOI] [PubMed] [Google Scholar]
- Finlay C. A., Hinds P. W., Tan T.-H., Eliyahu D., Oren M., and Levine A. J. (1988), Mol Cell Biol 8, 531–539. [DOI] [PMC free article] [PubMed] [Google Scholar]
- Foord O. S., Bhattacharya P., Reich Z., and Rotter V. (1991), Nucleic Acids Res 19, 5191–5198. [DOI] [PMC free article] [PubMed] [Google Scholar]
- Friedman P. N., Kern S. E., Vogelstein B., and Prives C. (1990), Proc Natl Acad Sci USA 87, 9275–9279. [DOI] [PMC free article] [PubMed] [Google Scholar]
- Funk W. D., Pak D. T., Karas R. H., Wright W. E., and Shay J. W. (1992), Mol Cell Biol 12, 2866–2871. [DOI] [PMC free article] [PubMed] [Google Scholar]
- Gannon J. V., Greaves R., Iggo R., and Lane D. P. (1990), EMBO J 9, 1595–1602. [DOI] [PMC free article] [PubMed] [Google Scholar]
- Goldfarb M., Shimizu K., Perucho M., and Wigler M. (1982), Nature 296, 404–409. [DOI] [PubMed] [Google Scholar]
- Herskowitz I. (1987), Nature 329, 219–222. [DOI] [PubMed] [Google Scholar]
- Hinds P., Finlay C., and Levine A. J. (1989), J Virol 63, 739–746. [DOI] [PMC free article] [PubMed] [Google Scholar]
- Hollstein M., Sidransky D., Vogelstein B., and Harris C. C. (1991), Science 253, 49–53. [DOI] [PubMed] [Google Scholar]
- Jenkins J. R., Rudge K., Chumakov P., and Currie G. A. (1985), Nature 317, 816–818. [DOI] [PubMed] [Google Scholar]
- Jenkins J. R., Rudge K., and Currie G. A. (1984), Nature 312, 651–654. [DOI] [PubMed] [Google Scholar]
- Kern S. E., Kinzler K. W., Baker S. J., Nigro J. M., Rotter V., Levine A. J., Friedman P., Prives C., and Vogelstein B. (1991), Oncogene 6, 131–136. [PubMed] [Google Scholar]
- Kern S. E., Kinzler K. W., Bruskin A., Jarosz D., Friedman P., Prives C., and Vogelstein B. (1991), Science 252, 1708–1711. [DOI] [PubMed] [Google Scholar]
- Kern S. E., Pietenpol J. A., Thiagalingam S., Seymour A., Kinzler K. W., and Vogelstein B. (1992), Science 256, 827–830. [DOI] [PubMed] [Google Scholar]
- Kozak M. (1986), Cell 44, 283–292. [DOI] [PubMed] [Google Scholar]
- Kraiss S., Quaiser A., Oren M., and Montenarh M. (1988), J Virol 62, 4737–4744. [DOI] [PMC free article] [PubMed] [Google Scholar]
- Lane D. P. (1992), Nature 358, 15–16. [DOI] [PubMed] [Google Scholar]
- Lanford R. E., Feldherr C. M., White R. G., Dunham R. G., and Kanda P. (1990), Exp Cell Res 186, 32–38. [DOI] [PubMed] [Google Scholar]
- Levine A. J., Momand J., and Finlay C. A. (1991), Nature 351, 453–456. [DOI] [PubMed] [Google Scholar]
- Logan J., Pilder S., and Shenk T. (1984), Cancer Cells 2, 527–532. [Google Scholar]
- MacArthur H. and Walter G. (1984), J Virol 52, 483–491. [DOI] [PMC free article] [PubMed] [Google Scholar]
- Maina C. V., Riggs P. D., Grandea A. G., Slatko B. E., Moran L. S., Tagliamonte J. A., McReynolds L. A., and di Guan C. (1988), Gene 74, 365–373. [DOI] [PubMed] [Google Scholar]
- Masuda H., Miller C., Koeffler H., Battifora H., and Cline M. (1987), Proc Natl Acad Sci USA 84, 7716–7719. [DOI] [PMC free article] [PubMed] [Google Scholar]
- McCormick F., Clark R., Harlow E., and Tjian R. (1981), Nature 292, 63–69. [DOI] [PubMed] [Google Scholar]
- Mercer W. E., Shields M. T., Amin M., Sauve G. J., Appella E., Romano J. W., and Ullrich S. J. (1990), Proc Natl Acad Sci USA 87, 6166–6170. [DOI] [PMC free article] [PubMed] [Google Scholar]
- Milner J. and Medcalf E. A. (1991), Cell 65, 765–774. [DOI] [PubMed] [Google Scholar]
- Milner J., Medcalf E. A., and Cook A. C. (1991), Mol Cell Biol 11, 11–19. [DOI] [PMC free article] [PubMed] [Google Scholar]
- Momand J., Zambetti G. P., Olson D. C., George D., and Levine A. J. (1992), Cell 69, 1237–1245. [DOI] [PubMed] [Google Scholar]
- Mowat M., Cheng N., Kimura N., Bernstein A., and Benchimol S. (1985), Nature 314, 633–636. [DOI] [PubMed] [Google Scholar]
- Oliner J. D., Kinzler K. W., Meltzer P. S., George D. L., and Vogelstein B. (1992), Nature 358, 80–83. [DOI] [PubMed] [Google Scholar]
- Parada L. F., Land H., Weinberg R. A., Wolf D., and Rotter V. (1984), Nature 312, 649–651. [DOI] [PubMed] [Google Scholar]
- Pellet P. E., McKnight J. L. C., Jenkins F. J., and Roizman B. (1985), Proc Natl Acad Sci USA 82, 5870–5874. [DOI] [PMC free article] [PubMed] [Google Scholar]
- Porath J., Carlsson J., Olsson I., and Belfrage G. (1975), Nature 258, 598–599. [DOI] [PubMed] [Google Scholar]
- Raycroft L., Schmidt J. R., Yoas K., Hao M. M., and Lozano G. (1991), Mol Cell Biol 11, 6067–6074. [DOI] [PMC free article] [PubMed] [Google Scholar]
- Raycroft L., Wu H., and Lozano G. (1990), Science 249, 1049–1051. [DOI] [PMC free article] [PubMed] [Google Scholar]
- Sadowski I., Ma J., Triezenberg S., and Ptashne M. (1988), Nature 335, 563–564. [DOI] [PubMed] [Google Scholar]
- Schmieg F. I. and Simmons D. T. (1988), J Virol 164, 132–140. [DOI] [PubMed] [Google Scholar]
- Seto E., Usheva A., Zambetti G. P., Momand J., Horikoshi N., Weinmann R., Levine A. J., and Shenk T. (1992), Proc Natl Acad Sci USA 89, 12028–12032. [DOI] [PMC free article] [PubMed] [Google Scholar]
- Shaulian E., Zauberman A., Ginsberg D., and Oren M. (1992), Mol Cell Biol 12, 5581–5592. [DOI] [PMC free article] [PubMed] [Google Scholar]
- Shaulsky G., Goldfinger N., Benzeev A., and Rotter V. (1990), Mol Cell Biol 10, 6565–6577. [DOI] [PMC free article] [PubMed] [Google Scholar]
- Soussi T., Caron de Fromentel C., and May P. (1990), Oncogene 5, 945–952. [PubMed] [Google Scholar]
- Steinmeyer K. and Deppert W. (1988), Oncogene 3, 501–507. [PubMed] [Google Scholar]
- Stenger J. E., Mayr G. A., Mann K., and Tegtmeyer P. (1992), Mol Carcinog 5, 102–106. [DOI] [PubMed] [Google Scholar]
- Sturzbecher H.-W., Brain R., Addison C., Rudge K., Remm M., Grimaldi M., Keenan E., and Jenkins J. R. (1992), Oncogene 7, 1513–1523. [PubMed] [Google Scholar]
- Thornton J. M., Flores T. P., Jones D. T., and Swindells M. B. (1992), Nature 354, 105–106. [DOI] [PubMed] [Google Scholar]
- Unger T., Nau M. M., Segal S., and Minna J. D. (1992), EMBO J 11, 1383–1390. [DOI] [PMC free article] [PubMed] [Google Scholar]
- Vialard J., Lalumiere M., Vernet T., Briedis D., Alkhatib G., Henning D., Levin D., and Richardson C. (1990), J Virol 64, 37–50. [DOI] [PMC free article] [PubMed] [Google Scholar]
- Weintraub H., Hauschka S., and Tapscott S. J. (1991), Proc Natl Acad Sci USA 88, 4570–4571. [DOI] [PMC free article] [PubMed] [Google Scholar]
- Zambetti G. P., Bargonetti J., Walker K., Prives C., and Levine A. J. (1992), Genes Dev 6, 1143–1152. [DOI] [PubMed] [Google Scholar]