

Abstract
The human embryonic globin genes ζ and ε are expressed when erythropoiesis is initiated at about the third week of development but are subsequently repressed as expression of the fetal globins, α and γ, begins. We have examined the promoter region of the human ζ-globin and ε-globin genes in order to identify regulatory sequences that may be involved in this process. Stable transfection of the human erythroid cell line K562 with either a truncated form of the ζ-globin gene, containing 112 base pairs (bp) of 5′-flanking sequences, or a larger ζ-globin construct, containing several hundred bp o f 5′-flanking sequence, revealed that the ζ-globin gene is subject to negative regulation by its 5′-flanking region. We have defined the sequences responsible for this negative regulation to a 22 bp region immediately upstream of the proximal promoter sequence of the ζ-globin gene. A 22 bp oligonucleotide including this negative element was found to inhibit both the ζ-globin and HSV TK promoters. We have also analyzed the promoter of the human ε-globin gene, since it is coordinately expressed with ζ-globin. We show that it is likewise subject to negative regulation, though in this case from a distal silencer element. Gel retardation and methylation interference assays have provided evidence of a factor which binds specifically to the ε-globin silencer. However, no obvious sequence homology exists between the ζ and ε negative elements, and at least some of the factors that recognize these elements are distinct. We postulate that the negative transcriptional control elements in the human embryonic globin gene promoters contribute to the observed reduction in and ε-globin gene expression that occurs during development.
Closely related genes within gene families may be expressed at different times during development or in different cell types (e.g., Schwatz et al., 1981; Piatigorsky, 1984; Tilghman et al., 1982). Characterization of the elements involved in their transcriptional control is therefore likely to be informative about the critical factors governing cell- or stage-specific gene expression. The human globin genes represent a well-characterized gene family whose members are expressed at different stages during development (Maniatis et al., 1980; Collins et al., 1984). The first globin genes to be expressed during human development are the a-like embryonic gene ζ and the β-like embryonic gene s (Gale et al., 1979). Expression of these genes is thought to begin at about the third week of embryogenesis in the primitive nucleated erythroblasts produced by the blood islands of the yolk sac. At about the fifth week of development, levels of the ζ- and ε-globin proteins fall rapidly. The ζ-globin protein is undetectable by week six, whereas ε-globin protein is detectable until week seven (Peschle et al., 1985).
There is a coordinate increase in the levels of both α-globin protein and the fetal β-like globin proteins Aγ and Gγ. This change in globin types is often referred to as hemoglobin switching. A second switch occurs in the β-like globin type shortly after birth, when the y proteins are replaced by the adult β protein.
DNA sequence elements involved in the transcriptional regulation of various human globin genes, especially the γ and β genes, have been studied in detail by in vitro mutagenesis and introduction of the mutated and wild-type genes into tissue culture cells or transgenic mice. These analyses have identified many positively acting control sequences both 5′ and 3′ of the mRNA cap sites of these genes. Both the Aγ and β-globin genes have erythroid-specific enhancer elements located 3′ of the gene (Bodine et al., 1987; Kollias et al., 1987; Behringer et al., 1987; Antoniou et al., 1988). The β-globin gene also appears to have an intragenic enhancer (Behringer et al., 1987; Antoniou et al., 1988). Upstream of the cap site, most globin genes have the sequence motifs CACCC, CCAAT, and TATA (Efstratiadis et al., 1980; Dierks et al., 1983; Anagnou et al., 1986; Myers et al., 1986), which also appear upstream of many non-globin genes (Benoist et al., 1980; Jones et al., 1987; Graves et al., 1986; Dorn et al., 1987). In addition, a sequence related to GATAA is often found in globin and other erythroid-specific promoters (for review see Orkin, 1990; Evans et al., 1988; Superti-Furga et al., 1988; Watt et al., 1990). Protein factors binding to these elements have been identified (Barnhart et al., 1988; de Boer et al., 1988; Superti-Furga et al., 1988; Watt et al., 1990). Recently, a promoter mutation in the human γ-globin GATA-1 binding site was shown to cause the hereditary persistence of fetal hemoglobin phenotype (Berry et al., 1992). However, the precise role of such factors in the developmental regulation of the human globin genes is at present unclear.
In addition to local transcriptional control elements, both the α- and β-globin gene clusters contain long-range elements which ensure that the clusters remain within active chromatin in erythroid cells. These regions, which lie 6–20 kilobase pairs (kbp) upstream of the human ε-globin gene and 28–65 kbp upstream of the ζ-globin gene, were originally identified as clusters of DNase I hypersensitive sites. They were termed the β-DCR (LAR) and the α-PRE, but are now known collectively as locus control regions (LCRs). When linked to globin genes and stably introduced into the chromosomes of cell lines or transgenic mice, these LCR elements confer high levels of position-independent, erythroid-specific expression on the associated genes (Grosveld et al., 1987; Higgs et al., 1990). The LCR element seems therefore to create a large domain of “open chromatin” (characterized by hypersensitive sites) that is stable throughout development (reviewed by Townes et al., 1990). LCR elements have also been shown to act as enhancers in transient assays, although their activity is markedly reduced, particularly in non-erythroid cells (Ney et al., 1990; Tuan et al., 1989; Pondel et al., 1992).
Besides possessing positive transcriptional control elements, a variety of genes transcribed by RNA polymerase II are negatively regulated (for review see Renkawitz, 1990, and Levine et al., 1989). Negative elements have been found close to the cap site, as well as several kbp distant from it, and are sometimes associated with transcriptional enhancer elements. One of the best studied mammalian examples is the inducible enhancer of the human P-interferon gene, whose activity is repressed in uninduced cells by a negatively acting sequence (Goodbourn et al., 1986). Mutations in this sequence result in increased basal levels of β-interferon transcription in uninduced cells (Goodbourn et al., 1986, 1988). The negative elements associated with other genes may in some cases be involved in repressing gene expression in inappropriate cell types. For example, the chicken lysozyme and sperm-specific histone H2B genes both contain well characterized silencers that function only in specific cells (Barberis et al., 1987; Baniahmad et al., 1990; Weissman et al., 1991; Colantuoni et al., 1987; Imler et al., 1987; Steiner et al., 1987; Nir et al., 1986; Muglia et al., 1986; Grinnell et al., 1988). In general, however, the sequences involved in specific transcriptional repression and the factors that bind to them are less well characterized than positively acting sequences and associated factors.
Previous work has shown that the cloned human alike embryonic globin gene ζ is appropriately expressed when introduced into cells with an early erythroid phenotype such as K562 (Norman et al., 1987), but not when introduced into the non-erythroid cell lines such as HeLa and Cos (Proudfoot et al., 1984). Watt et al. (1990) performed a detailed mutational analysis of the promoter region of the ζ-globin gene and defined positively acting sequences in the promoter proximal region. We also identified a negative element in the promoter proximal region of the ζ-globin gene (Lamb et al., 1989). This paper extends these observations by showing that a short oligonucleotide that includes the negative sequence element represses the ζ globin promoter in a variety of positions and in both orientations. The same oligonucleotide also inhibits transcription from the HSV TK promoter. The promoter of the other embryonic globin gene (ε) is also subject to negative regulation (Lamb et al., 1989; Cao et al., 1989). Transgenic experiments have recently suggested a developmental role for this negative element (Raich et al., 1992). This paper characterizes the 5′ and 3′ boundaries of the ε-globin negative element and demonstrates its relative independence of position and orientation with respect to the promoter. Moreover, we provide evidence for a factor present in erythroid and non-erythroid nuclei that binds specifically to this silencer. However, both the cis-acting sequences and transacting factors responsible for the negative regulation of ζ-globin appear to be distinct from that of the ε globin gene. This observation argues against (but does not eliminate) the possibility that the two genes might be coordinately regulated by negative promoter elements.
Materials and methods
Plasmid construction
All DNA manipulations were performed essentially as described by Sambrook et al. (1989). The plasmids ζ and ζT were previously described (Proudfoot et al., 1984). Similarly, the addition of the neo gene to pSVed and the oligonucleotide tag to ζ have both been previously described by Norman et al. (1987). The CAT expression plasmid pCATO was made by ligating the Bgl II-BamH I fragment containing the CAT gene from the plasmid pSVO Bgl II, which has a Bgl II site instead of a Hind III site 5′ of the CAT gene (Gorman et al, 1982), into the BamH I site of pUC119, such that the 5′ end of the CAT gene was adjacent to the Sma I site of the pUC119 polylinker. pCATE was then constructed by inserting the SV40 enhancer sequence into pCATO (see Watt et al., 1990, for further details). The −113ζ, −96ζ, and −84ζ CAT constructs are described by Lamb et al. (1989) and Watt et al. (1990).
The 22 bp negative element (NE) oligonucleotide was formed by annealing synthetic oligonucleotides with the sequences 5′CAAACCCCA GTCCCACAGAGCT3′ and 5′CTGTGGGACTGG GGTTTGAGCT3′ to give a duplex with cohesive Sac I ends. The duplexed oligonucleotide was then ligated into the relevant ζ-CAT construct cut with Sac I. The sequence of the inserted oligonucleotide and its orientation were determined by DNA sequencing. The 200 bp TK-CAT construct was made by ligating the Pvu II-Bgl II fragment containing the TK promoter (Mc-Knight, 1980) into the Sma I site of pCATO. The NE oligonucleotide was then cloned into the Sac I site as above. The 105 bp TK-CAT construct is called BL2CAT (Lucknow et al., 1987). The NE oligonucleotide was cloned into this plasmid by blunt-end ligation into a filled-in BamH I site immediately 5′ of the TK promoter. The NE oligo was obtained in blunt-ended form by digesting a subclone containing a single copy of the NE in the Sac I site of pUC119 with EcoRI and BamH I, then filling in the overhanging ends with Klenow polymerase.
The ε-CAT constructs of Figure 3 were made by inserting blunt-ended EcoR I-Pvu II (−2.0 kb to +20 bp) or EcoRV-Pvu II (−270 bp to +20 bp) or BamH I-Pvu II (−175 bp to +20 bp) fragments from the human ε-globin gene (Baralle et al., 1980) into the Sma I site of pCATO to produce constructs A, C, and B respectively. The Hae III to BamH I fragment (−400 to −175) was isolated from a polyacrylamide gel after blunt-ending, and was ligated into the blunt-ended Asp 718 site, which is immediately 5′ of the Sma I site, into which the ε-gene BamH I-Pvu II fragment had been ligated in construct B. This resulted in construct E (natural orientation) and construct F (reverse orientation). The internal deletion construct D was made by re-ligating a filled-in EcoR V-partial BamH I restriction digest of construct A. The linker insertion mutant (construct G) was made by cleaving at the unique EcoR V site within the ε-promoter in construct A and ligating in a 17 bp oligonucleotide with flush ends encoding Xho I and Hind III sites (formed by annealing the oligonucleotide 5′CTCGAGTAAGTAAG CTT3′ and its complement). An internal deletion was introduced upstream of the EcoR V site by Bal 31 digestion of construct E (described above). This 3′ deleted fragment was isolated from an agarose gel after Sac I digestion and ligated to the large Sac I-EcoR V fragment from construct A in the presence of the same 17 bp linker.
Figure 3.
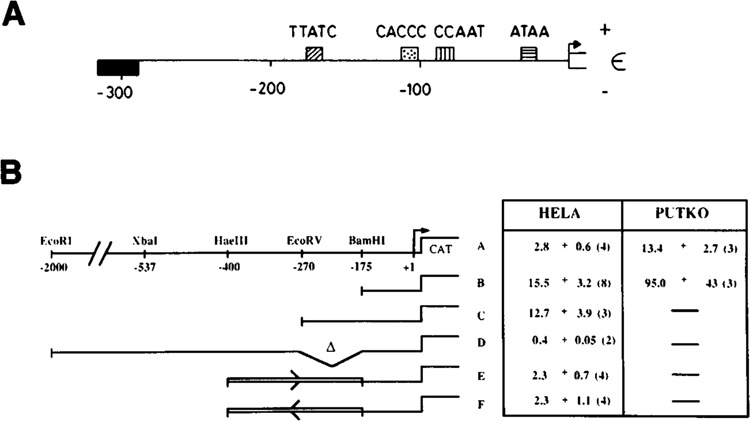
ε-globin promoter negative element. A. Diagram showing the relative positions of the promoter proximal elements of the human ε-globin gene. The positive elements are drawn above the line, while the negative element is drawn below the line. B. Relative CAT activities of ε-CAT constructs. CAT activities are given relative to the promoterless construct, pCATO, and are ± s.e.m. The number of experiments is given in brackets. Columns indicate the cells into which the constructs were transfected. Four relevant restriction sites in the human ε-globin gene 5′-flanking region are shown in construct A. The insert orientation in constructs E and F is indicated by arrows.
The 5′ deletion constructs of Figure 4 were derived from construct E (above) by Bal 31 digestion of a linear Sma I digest, filling in and digesting with Hind III, prior to ligation with a pCATO/Sma I-Hind III vector to ensure uniform 3′ deletion endpoint boundaries. The 3′ deletion mutants of Figure 4 were made as follows: construct E was linearized with EcoR V, followed by partial digestion with Bal 31 exonuclease. The digestion mixture was then ligated with a Bgl II linker (GAAGATCTTC) and transformed into E. coli. Appropriately sized clones were digested with Bgl II and filled in prior to digestion with EcoO109, which cuts in vector sequence on the 5′ side of the insert. The EcoO 109-Bgl II fragment containing the upstream portion of the Bal 31 deleted promoter was ligated into a vector fragment derived from EcoO 109-EcoR V digestion of construct E. The resultant clones have varying 3′ deletion boundaries but uniform 5′ deletion boundaries. The exact endpoints of clones were determined by DNA sequencing.
Figure 4.

Further definition of ε-globin negative element. A. Sequence of the upstream region of the ε-globin promoter containing the negative element is shown between the Hae III and EcoR V restriction sites. B. Summary of CAT activities of human ε-globin 5′ and 3′ promoter deletion constructs. Truncations of the εNE region were transfected into HeLa cells, together with positive and negative controls (constructs C, D, and E of Figure 3). The marked boundaries of the horizontal bars represent the deletion endpoints (shown next to each boundary) of the constructs, which are named by these endpoints. A simplified map of the largest of these constructs (E) is shown below. CAT activities of constructs—relative to that of the vector plasmid—were scored as positive (+) if the level of relative CAT activity was at least 5 times that of pCATE, and otherwise scored as negative (−).
The cotransfection control plasmid expressing β-galactosidase contains the lacZ gene under the control of a mouse β-actin promoter (see Watt et al., 1990).
Cell culture, transfection, and enzymatic assays
Putko cells (a hybrid cell line formed by the fusion of the cell line K562 and a B-cell lymphoma that have retained an early erythroid phenotype, including the expression of the ζ gene; Klein et al., 1980) were grown in RPMI supplemented with 10% fetal calf serum, 100 μg/ml penicillin, and 100 U/ml streptomycin, and were split 1:5 every two days. HeLa and K562 cells were grown in DMEM containing the same supplements and were split 1:3 every two days.
HepG2 cells were grown in DMEM with added non-essential amino acids. Otherwise the same supplements were used.
Putko cells were transfected by electroporation. The day before transfection, the cells were split 1:5. The following day, the cells (5 × 10⁶−107) were pelleted and resuspended in 1 ml of HEPES buffered saline (pH 7.1) containing 0.5% PEG 6000. DNA (50 μg of test plasmid, 5 μg of control plasmid) was added and the cells given a single shock of 1750 V at 25 μF using a Bio-rad Gene Pulsar. The cells were transferred immediately into half of their original volume of medium and harvested 40 hours later. HeLa, HepG2, and K562 cells were transfected using the standard calcium phosphate coprecipitation technique (Graham and van der Eb, 1973). Fifteen μg of test plasmid and 5 μg of control plasmid were used per 90 mm plate. The precipitate was left on the cells for 12 hours, and the cells harvested 24 hours after its removal.
Cellular lysates were prepared by sonication. The cleared lysates were assayed for β-galactosidase activity exactly as described by Herbomel et al. (1984). Lysates corresponding to equal amounts of β-galactosidase activity were then heated to 65°C for 5 minutes and used in a standard CAT assay (Gorman et al., 1982). CAT assays were quantitated by cutting the labeled (chlor-amphenicol and 3-acetyl chloramphenicol) spots from the plate and counting them in a liquid scintillation counter. The conversion figures (percentages) so obtained were then divided by the percentage of conversion of the background plasmid pCATE or pCATO to give the relative CAT activities. Transfections were repeated with different DNA preparations. However, the same preparation of background plasmid (pCATO) was used throughout a particular set of experiments, as we have found that the level of background can vary between different preparations (and when different batches of cells are used) – see Figure 6. For this reason, the relative CAT activities of two different sets of experiments cannot be directly compared.
Figure 6.

Activity of the ε and ζ negative elements in HepG2 cells. A. CAT assays of lysates from HepG2 cells transfected with ε-promoter CAT plasmids containing 180 and 2000 bp of ε-promoter sequence. B. Duplicate CAT assays of lysates from HepG2 cells transfected with TK-CAT plasmids in the absence (−105) or presence (−105+NE) of the ζ negative element oligonucleotide. CATO is the background control plasmid (see Materials and Methods).
S1 nuclease RNA analysis
A Hinf I fragment from the tagged ζ gene was kinase-labeled and strand-separated (see Fig. 1B), as described by Proudfoot et al. (1984). This anti-sense single-stranded DNA was annealed to K562 cytoplasmic RNA digested with SI nuclease and the DNA products fractionated by 7M urea poly-acrylamide gel electrophoresis (all described by Proudfoot et al., 1984).
Figure 1.

Negative regulation of the ζ-globin gene. A. RNA analysis using S1 nuclease of cytoplasmic RNA obtained from K562 cells stably transfected with either ζ pSVedNeo (lanes ζ1 and lanes ζ2) or ζT pSVedNeo (lanes ζT1 and ζT2). The positions of the endogenous ζ mRNA signal, transfected ζ mRNA signal, and readthrough signals are indicated. Lane K is with untransfected K562, while lane 6 is a tRNA control. B. Diagram showing the positions of the DNA probe and S1 protected signals obtained with respect to a map of the ζ globin gene. The ζ gene is depicted by a line for the 5′-flanking sequence, an open box for the 5′ non-coding region, a hatched box for exon 1, and a dashed box for intron 1. Tag denotes oligonucleotide insert into the ζ gene to allow endogenous and exogenous ζ mRNA to be distinguished.
Preparation of nuclear extract
This was essentially according to the method of Dignam et al., (1983) using HeLa or MEL cells grown in suspension.
Gel retardation assays
Gel shift assays were based on the method of Garner and Rezvin (1981) as modified by Singh et al. (1986). The NNE oligonucleotide (see below) was kinase-labeled and annealed to an excess of its complementary strand in 50 mM KC1. Approximately 20–50 fmoles of labeled oligonucleotide probe were incubated with 0.5–2 μl of nuclear extract in 20 μl of binding buffer (10 mM Tris-Cl, pH7.5; 50 mM NaCl; 1 mM EDTA; 5% glycerol; and 2 μg poly(dl-dC), Pharmacia) for 20 minutes at 20°C. Binding reactions were loaded directly (without dye addition) onto 6% non-denaturing gels and were run in 0.25X TBE at 8V/cm. The following oligonucleotides were annealed to their complementary strands in 50 mM KC1 by cooling slowly from 80°C: wild-type oligo NNE 5′AGATCTGTCA ACTGTCACCACCTTTAAGGC3′, mutant oligo MOE2/3 5 AGATCTTTCAACTTTAACCACCTTTAAGGC3′, mutant oligo MOE4/5 5′AGATCT TGGTTGGTGAACCACCTTTAAGGC3′ (altered residues are emboldened and underlined). After dilution to 2 ng/μl, the oligonucleotides were added as unlabeled competitors in gel retardation binding reactions at the final concentrations described in Figure 5. These competitor oligonucleotides were preincubated with nuclear extract at room temperature for 5 minutes in binding buffer prior to the addition of the labeled probe oligonucleotide.
Figure 5.

Factor binding to the 8 negative element. A and B. Gel retardation assay of an εNE oligonucleotide using Hela and MEL nuclear extract, respectively. The wild-type NNE oligonucleotide was used as the probe. The extract was preincubated with three unlabeled competitor oligonucleotides—the homologous (NNE) oligonucleotide, the mutant (MOE2/3), or the more extensively mutated (MOE4/5)—at increasing concentrations, shown above the figure in nanograms. Complexes A and C are indicated together with the unbound probe (P). C. Methylation interference analysis of complex C from panel B. The cleavage ladder resulting from methylation interference of the NNE oligonucleotide in MEL complex C is shown on the left. Whether the sense or antisense strand is labeled is indicated above, together with the ladder’s derivation from gel-retarded material (C) or from unretarded probe material (P). The G+A ladder from formic acid modification of NNE is shown in the right lane. Guanosine residues, which strongly inhibit complex C formation when methylated, are indicated with arrows, both on the cleavage ladder and on the corresponding sequence (shown on the right).
Methylation interference assay
Either the sense or the antisense strand of the oligonucleotide NNE (see above) was labeled at the 5′ end prior to annealing with its complement. These double-stranded oligonucleotides were then partially methylated with DMS according to Maxam and Gilbert (1980). After precipitation and resuspension, the probes were incubated with MEL nuclear extract in a gel retardation binding reaction, as described above. Following electrophoresis on a 6% non-denaturing gel, bands corresponding to the retarded complex (C) and the probe (P) were isolated, cleaved with NaOH, and fractionated on a 16% denaturing polyacrylamide gel.
Results
The 5′-flanking region of the ζ-globin gene contains a negative regulatory sequence
In a preliminary set of experiments, the expression of two previously described ζ-globin gene constructs called ζ and ζT was investigated after stable transformation of the human early erythroid cell line K562 (Lozzio and Lozzio, 1975). The construct ζ contains 300 bp of sequence upstream of the ζ cap site, while £T has been truncated to leave only 112 bp. Both constructs possess an oligonucleotide tag in exon 1, which allows transcripts from these introduced genes to be distinguished from the endogenous ζ-globin mRNA (Fig. 1B) present in K562 cells. Two pools of transformants, each consisting of approximately 100 individual clones, were analyzed for expression of both constructs by 5′ SI nuclease mapping. The DNA probe used is illustrated in Figure 1B, along with the relative size of resistant hybrids expected from endogenous and transfected ζ gene mRNAs. The results of the 5′ SI analysis are shown in Figure 1A. Correctly initiated expression from both ζ gene constructs is observed, but at a significantly lower level than that seen from the endogenous gene. This is likely to be due to the absence of the α-locus control region (LCR) element (Higgs et al., 1990) from these constructs. The LCR element, if included, might have enhanced expression, as well as conferred independence from inhibitory position effects. However, it is clear that the introduced ζT gene construct expresses considerably more correctly initiated mRNA than the ζ gene construct (fourfold, as determined by densitometry) in the duplicate experiments. These results are consistent with the presence of a negative regulatory element between −112 and −300 in the ζ gene promoter. A low level of transcription initiates upstream of the normal start site in pools containing both I, and ζT constructs (marked as ζT mismatch in Figure 1A). This probably reflects readthrough transcription initiating in adjacent vector or chromosomal sequences. Significantly, its level is similar in all pools.
A short oligonucleotide including the ζ-globin negative element inhibits promoter activity
The experiment described in Figure 1 shows that the promoter of the ζ-globin gene is subject to negative regulation. We have defined this negative element more fully elsewhere by deletion and linker scanning mutagenesis. This work identified a short region of the promoter that was necessary for repression (Lamb et al., 1989). Figure 2A summarizes the structure of the ζ-globin gene promoter, indicating the positions of both the positively acting sequences as defined by Watt et al. (1990) and Yu et al. (1990) and this negative element. The sequence of the negative element is also indicated. To investigate further whether this sequence was also sufficient for repression, a 22 bp synthetic oligonucleotide (the NE oligo) containing sequences from −152 to −135 in the C-promoter was cloned in front of several of the deleted ζ-promoter/CAT constructs. In an initial set of experiments, the NE oligo was cloned in both orientations in front of a-113 ζ-promoter deletion. These plasmids were then transfected into Putko and HeLa cells, and the CAT activities obtained are shown in Figure 2B. As described in Materials and Methods, all CAT activities are corrected for transfection efficiency by measuring β-gal activity from a cotransfected plasmid. Putko cells are a hybrid cell line formed by the fusion of the cell line K562 (used above) and a B-cell lymphoma (Klein et al., 1980); they have retained an early erythroid phenotype, including the expression of the ζ-gene. In both cell types, constructs with the oligonucleotide in the sense orientation give approximately threefold lower levels of CAT activity than the −113 deletion alone. In the antisense orientation the oligonucleotide has about a twofold negative CAT effect on expression. The 22 bp oligonucleotide is therefore capable of mimicking the effect of the NE and is effective in both cell types. The NE is also capable of functioning out of its normal position, and nearly as well in the reverse orientation. We have inserted an unrelated oligonucleotide 42 bp long into exactly the same position in the −113 deletion construct and found that this has no effect on the levels of CAT activity produced (data not shown). We performed 5’ end RNA mapping experiments with RNA isolated from HeLa cells transfected with the −113 ζ-CAT plasmid and showed that transcription initiates correctly at or close to the normal ζ-globin gene cap site (data not shown). The NE oligonucleotide has also been inserted immediately upstream of the −96 and −84 ζ-promoter deletions. In each case insertion of the NE results in a reduction of CAT activity (Fig. 2A). This demonstrates that the NE can operate independently of sequences between −135 and −84, and that it is capable of inhibiting a relatively simple promoter containing a CCAAT and TATA box as its only recognizable elements.
Figure 2.

Characterization of ζ-globin promoter negative element. A. Diagram showing the relative positions of the promoter proximal elements of the human ζ-globin gene. The positive elements are drawn above the line, while the negative element together with its sequence is drawn below the line. B. The effect of the negative element oligonucleotide on the ζ and TK promoters. CAT activities of the different constructs are given relative to pCATE (ζ-CAT constructs) or pCATO (TK-CAT constructs) and are ± s.e.m. The number of experiments is shown in brackets. The columns indicate the cell type into which the constructs were transfected. The structure of each construct is shown to the left of the column. The figure above each set of constructs gives the length of the ζ promoter sequence in bp relative to the cap site. The negative element oligonucleotide is represented by a hatched box, and its orientation when known is given by the arrow.
We have tested the effect of the NE oligonucleotide on a heterologous promoter by inserting it upstream of the well characterized HSV TK promoter. The NE oligo was inserted in both orientations upstream of TK promoters 200 bp and 105 bp long (Fig. 2B). These constructs were then transfected into HeLa cells and their relative CAT activities determined. The results show that the ζ-promoter NE oligonucleotide is capable of repressing a TK promoter 105 bp long in both orientations. The magnitude of the repression is similar to that observed when the NE oligo is placed in front of the ^-promoter. However, the NE oligo has only a small effect when positioned in front of a TK promoter 200 bp long in the sense orientation, and has no significant effect in the antisense orientation. Hence, although the NE is not promoter-specific, it exhibits distance-dependence and will not function if placed too far from the cap site. Since these constructs do not contain the SV40 enhancer, the above data demonstrate that the inhibitory effect is an enhancer-independent phenomenon.
The human ε-globin gene promoter is also under negative control
We conducted a similar study of the human s-globin gene promoter in order to allow a comparison between the promoters of the coordinate^ regulated embryonic globin genes. A DNA fragment extending from −2.0 kb to +20 of the human s-globin gene (Baralle et al., 1980) was linked to the CAT gene in the plasmid pCATO lacking the SV40 enhancer. Various deletions of the ε-globin promoter were made, and the resultant constructs were transfected into HeLa cells and in some cases into Putko cells. After a two-day period of expression, the cells were harvested and the relative CAT activities of each construct determined (see Materials and Methods). The results of these experiments are shown in Figures 3B and 4B. Figure 3A shows a map of the ε-globin gene promoter. Deletion from −2.0 kb to −270 bp (construct C) results in a fivefold increase in CAT activity in HeLa cells; further deletion to −175 bp has little additional effect (construct B). The same pattern is evident in Putko cells (Fig. 3B), as deletion from −2.0 kb to −175 bp gives a sevenfold increase in CAT activity (note that taking error into account, the level of repression is not significantly different from that observed in HeLa cells). This result shows that the εNE, like the ζNE, is not erythroid-specific. Primer extension experiments with RNA isolated from HeLa cells transfected with the −175 bp ε-CAT clone confirm that the RNA is initiated at the correct cap site (data not shown).
The ε negative element was further localized by cloning a restriction fragment extending from −175 to −400 in both orientations in front of an e-promoter truncated to the same site (-175). Expression of these constructs in HeLa cells shows that this −400 to −175 fragment includes all the inhibitory activity and functions equally well in both orientations (see constructs E and F, Fig. 3B). Two small disruptions were made within this fragment: in one, a 17 bp linker was inserted into the EcoR V site; in the other, a 3′ deletion of 20 bp was made from the EcoR V site before insertion of the same linker (construct G, Fig. 3B). Neither of these mutations affects the negative element (data not shown). The simplest interpretation of these preliminary results is that the negatively acting sequences in the ε-globin gene 5′-flanking region lies within a 110 bp region between the Hae III site at −400 and a position 20 bp upstream of the EcoR V site at −290, as shown in Figure 4A.
To assess the position-independence of this negative element, we deleted sequences between −270 and −175 of construct A to create construct D. This construct retains full repression. Indeed, we observe a significantly greater repression when the negative element is moved closer to the minimal promoter (note, however, the large relative standard errors of constructs A, E, and F, which preclude precise quantitative comparison). Similar position effects have been observed for other elements in promoters and enhancers.
Further definition of the ε-globin negative element
In order to characterize protein factor(s) presumed to be interacting with the ε-globin negative element (εNE), we decided to define its boundaries more precisely. Starting with construct E of Figure 3B, we used Bal 31 mutagenesis to make 5’ deletions from the −400 Hae III site and 3′ deletions from the −270 EcoR V site in the ε-globin promoter. The deletion constructs are named according to their endpoints (Fig 4B). These constructs, together with positive and negative controls (constructs C, D, and E), were transfected into Hela cells. As before, a cotransfection control plasmid expressing β-galactosidase was included in each transfection. After 48 hours, cells were harvested and CAT activities determined. Each transfection was performed at least twice; the results were scored as positive (+) if the CAT activity was five times or more than that of the negative control (construct A). Otherwise CAT activities were scored as negative (−). Figure 4B shows that even the smallest deletion of 16 bp (−400 to −384) from the 5′ side of the negative element was sufficient to increase expression, while further deletion (−363, −341, −320) had little additional effect. To determine the 3′ boundary of the negative element, six deletion constructs (−291 through −368) were made. None of these 3′ deletion constructs gave increased expression over the construct A control (Fig. 4B). This result suggests that the 3′ boundary of the εNE lies upstream of −368 or that the element contains functionally redundant parts. This observation is inconsistent with a model proposed by Cao et al., (1989), which suggested that two short regions of the ε-globin promoter with some homology to the chicken lysozyme silencer (−293 to −284 and −252 to −244) may be required for repression.
A factor binds specifically to the ε-globin negative element
Having further defined the probable boundaries of at least one domain of the εNE to a 32 bp region between −400 and −368 (from the cap site), we looked for transcription factors binding to this region. A parallel study previously defined the 5′ boundary of the εNE to be −392 (Cao et al., 1989), thereby reducing the sequence most probably responsible for repression to between −392 and −368. We designed an oligonucleotide (NNE) that extended from -392 to -369 (see underlined sequence in Figure 4A). This wild-type oligonucleotide contained an engineered Bgl II site at the 5′ side, which provided some additional flanking sequence. Two mutant oligonucleotides were also made and have been designated MOE2/3 and MOE4/5. The sequences of the sense strand of all three oligonucleotides are shown below 5′-3′, with the altered bases emboldened and underlined:
| NNE | 5′ AGATCTGTCAACTGTCACCACCTTTAACCC 3′ |
| MOE2/3 | 5′ AGATCTTTCAACTTTAACCACCTTTAAGGC 3′ |
| MOE4/5 | 5′ AGATCTTGGTTGGTGAACCACCTTTAAGGC 3′ |
Oligonucleotide NNE was radiolabeled, annealed to its complementary strand, and used in native gel retardation (gel shift) assays using either HeLa or MEL nuclear extract. Oligonucleotides NNE, MOE2/3, and MOE4/5 were each annealed to their respective complements and used as unlabeled competitors in the binding reactions of the same gel shift assays. Figure 5A shows such a gel shift competition experiment using an NNE probe and increasing amounts of unlabeled NNE, MOE2/3, and MOE4/5 oligonucleotides as competitors in a binding reaction containing HeLa nuclear extract. As indicated, there is a single retarded complex C, which we have found to have indistinguishable mobility from that seen with MEL nuclear extract (see below and data not shown). This complex is sensitive to competition with homologous wild-type NNE competitor, while being relatively resistant to competition with either of the mutant competitors MOE2/3 or MOE4/5. The εNE-binding factor present in HeLa cells does not appear to be O-glycosylated, since the protein giving rise to the retarded complex C is not retained on a wheat-germ agglutinin column (S. Till and S. Murphy, unpublished results). Figure 5B shows a similar gel shift competition assay using MEL cell nuclear extract in which two retarded complexes (A and C) can be seen. Complex A is probably a non-specific artifact, since its intensity did not vary greatly or consistently in the presence of any competitor (Fig. 5 and data not shown). As before, however, complex C was sensitive to homologous competition and was very resistant to competition with either of the mutant oligonucleotides. For example, 2 ng (100 fmoles) of the homologous competitor (NNE) is sufficient to remove virtually all of the labeled complex C, while this quantity of the mutant oligonucleotides had little effect. Note also the increased binding of the specific band C with increasing mutant competitor. This probably reflects the removal of an alternative competing interaction that is less specific. In summary, the data of Figure 5A and B provide evidence of similarly sized, possibly identical factors in MEL and HeLa nuclear extracts that bind specifically to the εNE.
Methylation interference analysis of factor(s) binding to the εNE
To determine the precise contacts of the NNE binding factor with the εNE, we analyzed complex C (see Fig. 5A) by methylation interference. Either the sense strand or the antisense strand of oligonucleotide NNE was labeled prior to annealing of the complementary strand. These double-stranded oligonucleotides were then partially methylated with dimethyl sulphate. After purification, these probes were incubated in binding reactions with MEL nuclear extract, as described above. Following native gel electrophoresis, DNA from the retarded complexes (C) and from the unbound probes (P) was isolated and cleaved with alkali before running on a denaturing acrylamide gel. Figure 5C shows the resultant cleavage ladders. Guanosine (G) residues that interfere with complex formation are indicated with arrows both on the autoradiograph and on the corresponding sequence shown alongside. Four out of the twelve G residues in NNE strongly inhibited factor binding upon methylation (compare the intensity of bands marked by arrows in C and P lanes). It is interesting to note that the contacting G residues occur in symmetrical pairs on different faces of the helix, suggesting that the interacting factor may wrap around the DNA to some extent. It is significant that oligonucleotides MOE2/3 and MOE4/5, which fail to compete efficiently with factor binding to oligonucleotide NNE (Fig. 5A and B), lack the critical G residues implicated in protein contact.
The ζ and ε negative elements are different sequences and are recognized by different trans-acting factors
A computer-aided comparison of the εNE sequence with the ζ negative element, defined above, revealed no striking homologies. Nevertheless, it could be argued that a common factor interacts with each of the two negative elements via distinct DNA-binding domains. An alternative way to investigate the relationship between the ε and ζ negative elements would be to compare the factors with which they interact. So far, however, we have failed to detect specific factors that interact with the ζNE in vitro, possibly reflecting their low abundance or instability in nuclear extracts. We therefore tested a variety of different cell lines for their responsiveness to the 8 and ζ negative elements. Both negative elements function in MEL, K562, Putko, and HeLa cells (Lamb et al., 1989; Cao et al., 1989; and data not shown). Figure 6, however, shows the result of CAT assays performed with lysates of the human hepatoma cell line HepG2 transiently transfected with constructs that contain or lack 8 and £ negative elements. The long and short forms of ε-CAT that possess or lack the εNE show a striking difference in activity (Fig. 6A), suggesting that the εNE is active in this cell type. In contrast, the −105 TK CAT construct with or without the ζ negative element shows no significant difference in levels (Fig. 6B). Apparently HepG2 cells possess the necessary trans-acting factors to allow the εNE but not the ζNE to operate. These results therefore demonstrate that at least some of the trans-acting factors that recognize the εNE must be distinct from those that recognize the εNE. This conclusion is supported by the observation that an unlabeled oligonucleotide containing the ζNE (NNE) failed to compete with factor binding to the εNE in gel retardation assays using the NNE oligonucleotide probe (data not shown).
Discussion
We have defined a negative element in the promoter of the human ζ-globin gene. This ζNE is directly adjacent to various positive elements that together make up the minimal promoter of the ζ-globin gene. Deletion of this negative element results in a 3- to 4-fold increase in mRNA initiating at the ζ gene cap site, both in stably transfected K562 cells and in transient assays with Putko cells (Lamb et al., 1989). Analysis of linker scanning mutations in the ζ-promoter confirms the presence of a negative element in the −140 region (Lamb et al., 1989). Indeed, a 22 bp oligonucleotide (ζNE oligo) that includes sequences between −152 to −135 in the ζ-promoter is capable of inhibiting expression from several ζ-CAT constructs in both orientations, although the natural orientation is more effective. This effect is observed in both Putko and HeLa cells. Hence this negative control is not restricted to erythroid cells. However, we have found that repression of the ζ-promoter is not observed in the human hepatoma cell line HepG2, indicating that it is not a ubiquitous phenomenon. The synthetic oligonucleotide is also capable of inhibiting an HSV TK promoter 105 bp long, demonstrating that the negative element is not promoter-specific. It does, however, exhibit distance-dependence, having little effect on the TK promoter when placed 200 bp from the cap site. This is a property shared with many promoter elements.
The fact that the ζ- and ε-globin (Cao et al., 1989) promoters are negatively regulated in K562 and Putko cells that express their endogenous £ genes may at first appear to be paradoxical. However, although these cell lines possess positive factors required for embryonic globin gene expression, they may in fact be only “semi-permissive” for ζ- and ε-globin gene expression by virtue of the presence of the putative negative regulatory factors. The cells that initially express the embryonic globin genes (early primitive nucleated erythroblasts) in vivo probably express their ζ- and ε-globin genes at higher levels than K562/Putko cells, and we suggest that they could lack active factors that bind to the negative elements. Conversely, erythroid cells that are produced at later times during development and that synthesize lower levels of embryonic globins might be expected to contain higher levels (or a larger portion of an active form) of these factors. We have in fact demonstrated that the £ NE has a fourfold inhibitory effect on its promoter in the mouse adult erythroid cell line MEL (data not shown). However, this is no greater than the effect we observed in human Putko cells. Possibly, factors that recognize the ζNE are partially species-specific, so that a more complete silencing of the £ promoter by its NE can be achieved only in human adult erythroid cells. Negative regulation of the ζ- and ε-promoters is also evident in HeLa cells, which are non-erythroid and do not express any of their endogenous globin genes. Hela cells lack the factor GATA-1 (reviewed by Orkin, 1990) required for the activity of some globin gene promoters and enhancers. In addition, the chromosomal globin genes in non-erythroid cells such as HeLa cells are packaged into inactive chromatin (Weintraub et al., 1976; Yagi et al., 1986), so that they are presumably inaccessible to transcription factors. Based on the negative regulation of the ε- and ζ-promoter in HeLa cells, we therefore consider it likely that the putative negatively acting factor present there regulates other (non-globin) genes. The ability of the ζNE and εNE (Cao et al., 1989) to repress a non-globin (TK) promoter is clearly consistent with this hypothesis.
We have also studied the human ε-globin gene promoter to allow a functional comparison with ζ, since these genes are expressed in the same cell type for approximately the same period during development. The data presented in Figures 3 and 4 clearly demonstrate that the ε-promoter, like the ζ-promoter, is under negative control. The region responsible for this inhibition was initially localized to a 110 bp region between 290 bp and 400 bp upstream of the cap site. This sequence represses the ε-promoter in both orientations and is active in Putko and HeLa cells. While still functioning at a variety of positions with respect to the transcriptional start site, the negative element is significantly more active when moved closer to the cap site than in its natural location. An independent study of the ε-promoter (Cao et al., 1989) has identified the same negative regulatory element in the 5′ flanking region of the gene. We have extended our initial observations by further defining the region responsible for repression to between −400 and −368 of the ε-globin promoter. This region is highly conserved (>90% over the entire sequence) in primates. Other interesting homologies are found, including a 100% homology over 19 bp in the Drosophila teissieri I-factor transposable element, a 20 bp region of 95% homology in a Xenopus laevis G protein (type G αi1), as well as 94% homology over 18 bp in the human PRH2 gene.
We have also identified a factor which interacts specifically with this defined εNE (see Fig. 5). However, an oligonucleotide corresponding to this sequence alone (NNE) fails to cause repression when cloned directly upstream (−270) of a minimal promoter, suggesting that, while necessary, these sequences may not be sufficient for silencing (S. Till and S. Murphy, unpublished results). The existence of trans-acting factors involved in ε-globin silencing was initially suggested by cell fusion experiments (Baron et al., 1986). It is tempting to speculate that the εNE-binding factor we have identified is involved in repression. At present there appears to be little relationship between the negative elements in the ζ- and ε-globin promoters. As described above, both the position and nucleotide sequence of the ε and ζ negative elements appear to be quite different. The fact that the εNE but not the ζNE functions in the liver cell line HepG2 (see Fig. 6) argues that at least some of the trans-acting factors that recognize these negative elements are different. Further identification of factors that bind to the ζ and ε negative regions will allow the relationship (if any) between them to be clarified.
The constructs used throughout these experiments lacked LCRs (Towns and Behringer, 1990; Higgs et al., 1990). However, it is not clear whether such elements function normally in transfection assays, particularly when moved unnaturally close to the minimal promoter. Moreover, the low activity of these elements in non-erythroid cells compared to erythroid cells (Pondel et al., 1992), would have made the assessment of negative element tissue-specificity more complicated in these studies. In transgenic mice, LCR elements appear to function as very strong enhancers that, at least in the case of some globin transcriptional control elements, can have the effect of overriding more subtle transcriptional controls. For example, the well characterized 3′ enhancer of human β-globin (Antoniou et al., 1988) fails to function in the presence of an LCR element close to the gene (Collis et al., 1990). It might be argued that the use of transient transfection assays in these experiments is based on an unnatural arrangement of chromatin. Nevertheless, numerous transcriptional elements (including the ζNE described above) are observable in both transient and stable integration transfection assays.
What relevance might the presence of these negative control regions have to the regulation of the human embryonic genes in vivo? An attractive hypothesis is that they are involved in the rapid decline in ζ- and ε-globin gene expression that is initiated at about the fifth week of embryogenesis. Precedent for such a role for negative elements in development can be found in the α-fetoprotein gene. Expression of this gene is extinguished at birth via a position-dependent negative element (Vacher et al., 1990). Such a developmental hypothesis suggests that factors interacting with the ζ and ε negative elements are absent or inactive in early erythroid cells but become functional at later stages of erythropoiesis. To address this question, constructs lacking the ζ and ε negative elements but containing intact human embryonic genes and flanking sequences (including minimal LCR elements) were stably introduced into adult murine MEL cells. No increased expression of the embryonic globin genes was observed relative to controls having undisrupted promoters (Vyas et al., 1992). This result would seem to argue against a developmental role for these negative elements, since the cell line used has a fully adult phenotype. However, unlike the endogenous mouse embryonic genes, significant amounts of ζ and ε-globin mRNAs were expressed from all the constructs used in the above experiments (including controls), suggesting that the unnatural proximity of the LCR could have overridden the normal regulatory mechanism. Conflicting results were recently obtained by Raich et al. (1992), who introduced the human ε-globin gene linked to an LCR element into transgenic mice. This control construct was regulated normally (i.e., expression of ε globin was extinguished by the fetal stage), while another construct lacking a region containing the εNE was abnormally expressed into the fetal and adult stages of development. In these experiments, however, only a comparatively low level of repression was observed (as opposed to the natural silencing of ε-globin expression from high levels to virtual extinction). Nevertheless, the observed phenomenon may contribute-with other components – to the overall silencing of ε-globin transcription.
In conclusion, it remains to be established what biological role is played by the ε- and ζ-globin negative elements described in these studies. Possibly the targeted mutagenesis of these elements in an otherwise unmodified globin gene cluster will reveal their true significance.
Acknowledgments
We acknowledge Chris Norman for her part in the initial experiments described in this paper. We would like to thank Emma Whitelaw, Merlin Crossley, Shona Murphy, Mark Pondel, and Simon Lynch for reviewing the manuscript and for helpful discussions. We are also grateful to Paul Caron for help with sequence analysis.
P. Lamb was the recipient of an MRC Training Fellowship, and P. Watt was a Commonwealth Scholar of the Association of Commonwealth Universities.
This work was funded by MRC project grant no. G8822153CB.
The costs of publishing this article were defrayed in part by the payment of page charges. This article must therefore be hereby marked “advertisement” in accordance with 18 USC Section 1734 solely to indicate this fact.
Paul Watt is currently in the Department of Biochemistry and Molecular Biology, Harvard University, 7 Divinity Avenue, Cambridge, MA 02138.
Peter Lamb is currently at Ligand Pharmaceuticals, 11149 N. Torrey Pines Road, Suite 110, Lajolla, CA 92037.
References
- Anagnou N. P., Karlsson S., Moulton A. D., Keller G., and Nienhuis A. W. (1986), EMBO J 5, 121–126. [DOI] [PMC free article] [PubMed] [Google Scholar]
- Antoniou M., deBoer E., Habets G., and Grosveld F. (1988), EMBOJ 7, 377–384. [DOI] [PMC free article] [PubMed] [Google Scholar]
- Baniahmad A., Steiner C., Kohne A., and Renkawitz R. (1990), Cell 61, 505–514. [DOI] [PubMed] [Google Scholar]
- Baralle F. E., Shoulders C. C., and Proudfoot N. J. (1980), Cell 21, 621–626. [DOI] [PubMed] [Google Scholar]
- Barberis A., Superti-Furga G., and Busslinger M. (1987), Cell 50, 347–359. [DOI] [PubMed] [Google Scholar]
- Barnhart K. M., Kim C. G., Banerji S. S., and Sheffery M. (1988), Mol Cell Biol 8, 3215–3226. [DOI] [PMC free article] [PubMed] [Google Scholar]
- Baron M. and Maniatis T. (1986), Cell 46, 591–602. [DOI] [PubMed] [Google Scholar]
- Behringer R., Hammer R., Brinster R., Palmiter R., and Townes T. (1987), Proc Natl Acad Sci USA 84, 7056–7060. [DOI] [PMC free article] [PubMed] [Google Scholar]
- Benoist C., O’Hare K., Breathnach R., and Chambon P. (1980), Nucleic Acids Res 8, 127–142. [DOI] [PMC free article] [PubMed] [Google Scholar]
- Berry M., Grosveld F., Dillon N. (1992), Nature 358, 499–502. [DOI] [PubMed] [Google Scholar]
- Bodine D. M. and Ley T. J. (1987), EMBO J 6, 2997–3004. [DOI] [PMC free article] [PubMed] [Google Scholar]
- Cao S. X., Gutman P. D., Dave H. P. D., and Schechter A. N. (1989), Proc Natl Acad Sci USA 86, 5306–5309. [DOI] [PMC free article] [PubMed] [Google Scholar]
- Colantuoni V., Pirozzi A., Blance C., and Cortese R. (1987), EMBO J 6, 631–636. [DOI] [PMC free article] [PubMed] [Google Scholar]
- Collins F. S. and Weissman S. M. (1984), Prog Nucleic Acid Res Mol Biol 31, 315–462. [DOI] [PubMed] [Google Scholar]
- Collis P., Antoniou M., and Grosveld F. (1990), EMBO J, 9, 233–240. [DOI] [PMC free article] [PubMed] [Google Scholar]
- de Boer E., Antoniou M., Mignotte V., Wall L., and Grosveld F. (1988), EMBO J 7, 4203–4212. [DOI] [PMC free article] [PubMed] [Google Scholar]
- Dierks P., van Ooyen A., Cochran M. D., Dobkin C., Reiser J., and Weissman C. (1983), Cell 32, 695–706. [DOI] [PubMed] [Google Scholar]
- Dignam J., Lebovitz R., and Roeder R. (1983), Nucleic Acids Res 11, 1475–1489. [DOI] [PMC free article] [PubMed] [Google Scholar]
- Dorn A., Bollekens J., Staub A., Benoist C., and Mathis D. (1987), Cell 50, 863–872. [DOI] [PubMed] [Google Scholar]
- Efstratiadis A., Posakony J. W., Maniatis T., Lawn R. M., O’Connell C., Spritz R. A., DeRiel J. K., Forget B. G., Weissman S. M., Slighthom J. L., Blechl A. E., Smithies O., Baralle F. E., SSoulders C. C., and Proudfoot N. J. (1980), Cell 21, 653–668. [DOI] [PubMed] [Google Scholar]
- Evans T., Reitman M., and Felsenfeld G. (1988), Proc Natl Acad Sci USA 85, 5976–5980. [DOI] [PMC free article] [PubMed] [Google Scholar]
- Gale R. E., Clegg J. B., and Huehns E. R. (1979), Nature 280, 162–164, 26. [DOI] [PubMed] [Google Scholar]
- Garner M. and Rezvin A. (1981), Nucleic Acids Res 9, 3047–3059. [DOI] [PMC free article] [PubMed] [Google Scholar]
- Goodbourn S., Burstein H., and Maniatis T. (1986), Cell 45, 601–610. [DOI] [PubMed] [Google Scholar]
- Goodbourn S. and Maniatis T. (1988), Proc Natl Acad Sci USA 85, 1447–1451. [DOI] [PMC free article] [PubMed] [Google Scholar]
- Gorman C. M., Moffat L. F., and Howard B. H. (1982), Mol Cell Biol 2, 1044–1051. [DOI] [PMC free article] [PubMed] [Google Scholar]
- Graham F. L. and van der Eb A. J. (1973), Virology 52, 456–467. [DOI] [PubMed] [Google Scholar]
- Graves B. J., Johnson P. F., and McKnight S. L. (1986), Cell 44, 565–576. [DOI] [PubMed] [Google Scholar]
- Grinnell B. W., Berg D. T., and Walls J. D. (1988), Mol Cell Biol 8, 3448–3457. [DOI] [PMC free article] [PubMed] [Google Scholar]
- Grosveld F., van Assendelft G. B., Greaves D. R., and Kollias G. (1987), Cell 51, 975–985. [DOI] [PubMed] [Google Scholar]
- Herbomel P., Bourachot B., and Yaniv M. (1984), Cele 39, 653–662. [DOI] [PubMed] [Google Scholar]
- Higgs D., Wood W., Jarman A., Sharp J., Lida J., Pretorius I., and Ayyub H. (1990), Genes Dev 4, 1588–1601. [DOI] [PubMed] [Google Scholar]
- Imler J.-L., Lemaire C., Wasylyk C., and Wasylyk B. (1987), Mol Cell Biol 7, 2558–2567. [DOI] [PMC free article] [PubMed] [Google Scholar]
- Jones K. A., Kadonaga J. T., Rosenfeld P.J., Kelly T. J., and Tjian R. (1987), Cell 48, 79–89. [DOI] [PubMed] [Google Scholar]
- Klein G., Zeuthen J., Eriksson I., Terasaki P., Bernoco M., Rosen A., Masucci G., Povey S., and Ber R. (1980), J Natl Cancer Inst 64, 725–735. [PubMed] [Google Scholar]
- Kollias G., Hurst J., deBoer E., and Grosveld F. (1987), Nucleic Acids Res 15, 5739–5747. [DOI] [PMC free article] [PubMed] [Google Scholar]
- Lamb P., Watt P., Proudfoot N. J. (1989), in Hemoglobin Switching: Part A: Transcriptional Regulation. (Stamatoyannopoulos G., and Nienhuis A. W., eds.), Alan R. Liss, Inc., New York, pp. 269–277. [Google Scholar]
- Levine M. and Manley J. (1989), Cell 59, 405–408. [DOI] [PubMed] [Google Scholar]
- Lozzio C. B. and Lozzio B. B. (1975), Blood 45, 321–334. [PubMed] [Google Scholar]
- Lucknow B. and Schutz G. (1987), Nucleic Acids Res 15, 5490. [DOI] [PMC free article] [PubMed] [Google Scholar]
- Maniatis T., Fritsch E. F., Lauer J., and Lawn R. M. (1980), Annu Rev Genetics 14, 145–178. [DOI] [PubMed] [Google Scholar]
- Maxam A. and Gilbert W. (1980), Methods Enzymol 65, 499–559. [DOI] [PubMed] [Google Scholar]
- McKnight S. (1980), Nucleic Acids Res 8, 5949–5964. [DOI] [PMC free article] [PubMed] [Google Scholar]
- Muglia L. and Rothman-Denes L. B. (1986), Proc Natl Acad Sci USA 83, 7653–7657. [DOI] [PMC free article] [PubMed] [Google Scholar]
- Myers R. M., Tilly K., and Maniatis T. (1986), Science 232, 613–618. [DOI] [PubMed] [Google Scholar]
- Ney P., Sorrentino B., McDonagh K., and Nienhuis A. (1990), Genes Dev 4, 993–1006. [DOI] [PubMed] [Google Scholar]
- Nir U., Walker M. D., and Rutter W. J. (1986), Proc Natl Acad Sci USA 83, 3180–3184. [DOI] [PMC free article] [PubMed] [Google Scholar]
- Norman C., Raymond V., and Proudfoot N. J. (1987), in Developmental Control of Globin Gene Expression (Stamatoyannopoulos G., and Nienhuis A. W., eds.), Alan R. Liss, Inc., New York, pp. 235–252. [Google Scholar]
- Orkin S. (1990), Cell 63, 665–672. [DOI] [PubMed] [Google Scholar]
- Peschle C., Malvilio F., Care A., Migliaccio G., Migliaccio A. R., Salvo G., Samoggia P., Petti S., Guerrio R., Marinucci M., Lazzaro D., Russo G., and Mastroberardino G. (1985), Nature 313, 235–238. [DOI] [PubMed] [Google Scholar]
- Piatigorsky J. (1984), Cell 38, 620–621. [DOI] [PubMed] [Google Scholar]
- Pondel M., George M., and Proudfoot N. (1992), Nucleic Acids Res 20, 237–243. [DOI] [PMC free article] [PubMed] [Google Scholar]
- Proudfoot N. J., Rutherford T. R., and Partington G. A. (1984), EMBO J 3, 1533–1540. [DOI] [PMC free article] [PubMed] [Google Scholar]
- Raich N., Papayannopoulou T., Stamatoyannopoulos G., and Enver T. (1992), Blood 79, 861. [PubMed] [Google Scholar]
- Renkawitz R. (1990), Trends Genet, 192–197. [DOI] [PubMed]
- Sambrook J., Fritsch E. F., and Maniatis T. (1989), Molecular Cloning: A Laboratory Manual, 2nd ed., Cold Spring Harbor Laboratory Press, Cold Spring Harbor, NY. [Google Scholar]
- Schwartz R. J. and Rothblum K. N. (1981), Biochemistry 20, 4122–4129. [DOI] [PubMed] [Google Scholar]
- Singh H., Sen R., Baltimore D., and Sharp P. (1986), Nature 319, 154–158. [DOI] [PubMed] [Google Scholar]
- Steiner C., Muller M., Baniahmad A., and Renkawitz R. (1987), Nucleic Acids Res 15, 4163–4178. [DOI] [PMC free article] [PubMed] [Google Scholar]
- Superti-Furga G., Barberis A., Schaffner G., and Busslinger M. (1988), EMBO J 7, 3099–3107. [DOI] [PMC free article] [PubMed] [Google Scholar]
- Tilghman S. M. and Belayew A. (1982), Proc Natl Acad Sci USA 79, 5254–5257. [DOI] [PMC free article] [PubMed] [Google Scholar]
- Towns T. and Behringer R. (1990), Trends Genet 6, 219–223. [DOI] [PubMed] [Google Scholar]
- Tuan D., Solomon W., London I., and Lee D. (1989), Proc Natl Acad Sci USA 86, 2554–2558. [DOI] [PMC free article] [PubMed] [Google Scholar]
- Vacher J. and Tilghman S. (1990), Science 250, 1732–1735. [DOI] [PubMed] [Google Scholar]
- Vyas P., Sharpe J., Watt P., Higgs D., and Wood W. (1992), Blood 80, 1832–1837. [PubMed] [Google Scholar]
- Watt P., Lamb P., Squire L., and Proudfoot N. J. (1990), Nucleic Acids Res 18, 1339–1350. [DOI] [PMC free article] [PubMed] [Google Scholar]
- Weintraub H. and Groudine M. (1976), Science 193, 848–858. [DOI] [PubMed] [Google Scholar]
- Weissman J. and Singer D. (1991), Mol Cell Biol 11, 4217–4234. [DOI] [PMC free article] [PubMed] [Google Scholar]
- Yagi M., Gelinas R., Elder J. T., Peretz M., Papayannopoulou T., Stamatoyannopoulos G., and Groudine M. (1986), Mol Cell Biol 6, 1108–1116. [DOI] [PMC free article] [PubMed] [Google Scholar]
- Yu C., Chen J., Lin L., Tam M., and Shen J. (1990), Mol Cell Biol 10, 282–294. [DOI] [PMC free article] [PubMed] [Google Scholar]