Abstract
The amyloidoses are a large group of protein misfolding diseases. Genetic and biochemical evidence support the hypothesis that amyloid formation from wild-type or 1 of 80 sequence variants of transthyretin causes the human amyloid diseases senile systemic amyloidosis or familial amyloid polyneuropathy, respectively. The late onset and variable penetrance of these diseases has led to their designation as multigenic—implying that the expression levels and alleles of multiple gene products influence the course of pathology. Here we show that the binding stoichiometry of three interacting molecules, retinol-binding protein, vitamin A, and l-thyroxine, notably influenced transthyretin amyloidogenicity in vitro. At least 70 genes control retinol-binding protein, vitamin A, and l-thyroxine levels in plasma and have the potential to modulate the course of senile systemic amyloidosis or familial amyloid polyneuropathy.
Amyloid diseases, representative of numerous misfolding disorders, affect a significant fraction of the elderly population. The amyloid hypothesis states that the process of amyloid fibril formation, involving cross-β-sheet intermediates, is responsible for the disease pathology (1, 2). Although genetic and biochemical evidence for the amyloid hypothesis is strong (3–5), it has not been unambiguously proven. Nonetheless, a significant amount of research has been performed to understand and inhibit amyloid formation with the expectation of treating these diseases.
The variability in human amyloid disease pathology suggests that many factors, including multiple genetic loci, combine to affect the initiation of amyloid deposition (6). Evidence for the influence of multiple genes includes the incomplete penetrance and variable phenotypes of some familial amyloid disease mutations (7–9). The late and variable age of onset for senile forms of amyloid diseases also suggests that multiple genetic factors, and possibly environmental factors, are involved. A clear example of the multigenic nature of amyloid diseases is the role that apolipoprotein E (apoE) alleles play in the onset of Alzheimer's disease. Patients with apoE4 alleles are at higher risk to develop the senile form of the disease, for reasons that remain unclear (6).
Here we examined the amyloidogenicity of transthyretin (TTR) to determine whether genes modulating the concentration of interacting molecules could play a role in TTR amyloid formation in vitro and consequently influence disease course. TTR amyloidogenesis of the wild-type protein putatively causes senile systemic amyloidosis, whereas amyloid formation from any of 80 different point mutations is linked to familial amyloid polyneuropathy (FAP; refs. 3 and 10). L55P TTR is the most pathogenic of the FAP-associated mutants, with the earliest age of onset.
TTR is a 55-kDa homotetrameric plasma protein known to be the primary carrier for l-thyroxine (T4) in cerebrospinal fluid and the secondary carrier for T4 in plasma (11). Thyroxine-binding globulin carries the majority of T4 in plasma; hence, its expression levels affect the extent of T4 binding to TTR. TTR is the primary indirect carrier of vitamin A (all-trans-retinol) through its interaction with retinol-binding protein (RBP; ref. 12). RBP is a 21-kDa monomer that circulates in plasma bound to retinol and tetrameric TTR (13); the interaction with TTR prevents glomerular filtration of RBP by the kidneys. When not bound to retinol, RBP has a significantly lower affinity for TTR; thus, the TTR⋅apoRBP complex does not form at physiological concentrations (12, 14). Genes influencing the exact composition of the TTR4⋅holoRBPn=0–2⋅thyroxinem=0–2 complex provide a starting point to investigate the multigenic hypothesis of TTR amyloid disease.
Previous work has shown that binding of T4 dramatically stabilizes the TTR tetramer and consequently inhibits amyloid formation (15). Two equivalents of T4 can bind in the central cavity of the TTR tetramer; each T4 molecule makes contacts with two monomers of TTR (16, 17). Typically, only 10–15% of this capacity is used in vivo, thus moderate changes in T4 availability would alter the exact stoichiometry of TTR and T4 and influence TTR amyloidogenicity.
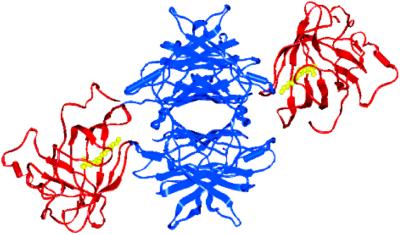
Tetrameric TTR presents four symmetry-related RBP⋅all-trans-retinol complex (holoRBP) binding sites (18); however, only two are concurrently accessible as a result of overlapping footprints, with less than one equivalent of holoRBP bound per TTR tetramer in plasma. Crystal structures of the TTR⋅(holoRBP)2 complex show that each holoRBP monomer makes contacts with three of the four TTR subunits, across both dimer interfaces (Fig. 1). The holoRBP binding sites on TTR are positioned orthogonal to the nonoverlapping T4 binding sites (19, 20), allowing formation of a complex composed of up to 10 molecules.
Figure 1.
Image of human TTR⋅holoRBP2 complex. TTR is shown in blue, RBP in red, and retinol in yellow. Coordinates are from the Research Collaboratory for Structural Bioinformatics protein data bank, ID code 1QAB, and the figure is produced by using INSIGHT II. Two equiv of T4, not present in this structure, would bind in the central cavity of TTR shown in the center of the image.
Because holoRBP makes contacts with three subunits of TTR (19, 20), we predicted that formation of the TTR⋅holoRBP complex would reduce amyloid formation through TTR tetramer stabilization. Typically, only one-half equivalent of holoRBP is bound to TTR in plasma, leaving open the possibility that increased holoRBP secretion could suppress amyloid formation whereas abnormally low expression could enhance TTR amyloidogenicity. To date, all in vitro studies of TTR amyloidogenicity have been conducted in the absence of RBP. The affinity between holoRBP and TTR is highest at neutral pH, decreasing under both acidic and alkaline conditions (13, 21); however, over the pH range that facilitates TTR amyloid fibril formation, the binding constant is still 80–90% of the value measured at neutral pH (Kd = 160–200 nM) (13, 21). In principle, T4 and RBP should function in concert because the binding of T4 to TTR at neutral pH is not affected by the presence of bound holoRBP (21). We demonstrated that the binding stoichiometry of three interacting molecules, RBP, vitamin A, and T4, markedly influenced TTR amyloidogenicity in vitro.
Materials and Methods
Protein Preparation of holoRBP and TTR.
HoloRBP was prepared as described (22) with a few modifications. After addition of all-trans-retinol to the refolding reaction, the protein was kept isolated from light to minimize oxidation of retinol. Only 1 liter of induced Escherichia coli was processed at a time to work more quickly and reduce degradation from proteases during purification. To increase purity, holoRBP was chromatographed on a Superdex75 (Amersham Pharmacia Biotech) gel filtration column before use in experiments.
Wild-type and L55P TTR were prepared as described (23) with a few modifications to enhance expression levels and purity. The starter culture was grown until cell growth was visible before inoculating 15 ml into 1.5 liters of LB media with 100 μg/ml of ampicillin in 2.8-liter Fernbach flasks. Cells were grown at 37°C with vigorous shaking until an OD600 of 1.0–1.2 a.u. was reached, at which point they were induced with 1 mM isopropyl β-d-thiogalactoside (IPTG) and grown overnight at 37°C with vigorous shaking. In the purification, the resuspended ammonium sulfate pellet was desalted by dialysis vs. 25 mM Tris (pH 8.0) rather than using a desalting column, and the heating step was eliminated from the purification. To increase purity and remove soluble aggregates, TTR was chromatographed on a Superdex75 gel filtration column before use in experiments.
Isothermal Titration Calorimetry of HoloRBP and TTR.
A filtered solution of holoRBP (980 μM) was titrated into 1.3407 ml of wild-type TTR (50 μM)‡ at 20°C by using a Microcal MCS Isothermal Titration Calorimeter (Northampton, MA). Both solutions were dialyzed vs. 10 mM sodium phosphate/100 mM KCl/1 mM EDTA (pH 7.6) to ensure an accurate buffer match. An initial injection of 2 μl was followed by 25 injections of 10 μl with a 4-min equilibration period between injections. Six independent titrations were performed as well as one control of holoRBP titrated into buffer to obtain the heat of holoRBP dilution. Integration of the thermogram and subtraction of a line fit to the control data yielded a binding isotherm that was fit to a model of one set of sites by using the variables Ka, ΔH, and the number of sites n with the isothermal titration calorimetry (ITC) data analysis module in ORIGIN 5.0 (Microcal Software). Models of two sets of sites or subsequent binding events did not fit the data as well, as determined by χ2 analysis.
Analysis of the Sedimentation Velocity Profiles of HoloRBP and TTR.
Solutions of wild-type or L55P TTR (14.4 μM)‡ were incubated with holoRBP (14.4 μM) for 2 h at 37°C in 10 mM sodium phosphate/100 mM KCl/1 mM EDTA (pH 7.6) and diluted to 7.2 μM with the same buffer. Solutions of wild-type TTR (14.4 μM)‡ were incubated with holoRBP (14.4 μM) for 1 h at 37°C in 10 mM sodium phosphate/100 mM KCl/1 mM EDTA (pH 7.6); the pH was lowered to 5.5, 5.0, or 4.4 with an equal volume of 200 mM sodium acetate/100 mM KCl/1 mM EDTA (pH 5.3, 4.8, or 4.2, respectively).
Sedimentation velocity profiles were obtained on a temperature-controlled Beckman Coulter XL-I analytical ultracentrifuge equipped with an An50Ti rotor and a photoelectric scanner. A standard double-sector cell, equipped with a 12-mm Epon centerpiece and quartz windows, was loaded with 400–420 μl of sample by using a blunt-end microsyringe. Data at 330 nm were collected at rotor speeds of 3,000 rpm initially and 50,000 rpm in a continuous mode at 20°C, with a step size of 0.003 cm.
A time derivative method was applied to interpret the sedimentation velocity data. The program DCDT+ was used in which multiple data sets (concentration vs. radial position) taken at various times during the experiment were used to calculate the time derivative (24), which was used to determine the sedimentation coefficient distribution function g(s*). By fitting Gaussian functions to the g(s*) distribution, the sedimentation and diffusion coefficients, and therefore molecular weights, were determined.
The data were fit to one, two, or three noninteracting species. Because the proteins did not absorb at 330 nm, the only species observed were those that contained retinol. For wild-type TTR at all pH values, the best fit was with TTR⋅holoRBP as the major species and with TTR⋅holoRBP2 and holoRBP monomer as minor species. For L55P TTR at pH 7.6, the best fit was with TTR⋅holoRBP as the major species and with TTR⋅holoRBP2 as the minor species.
In Vitro Fibril Formation Assay.
The fibril formation assays were adapted from previous work (15, 25, 26). Wild-type and L55P TTR fibril formation was investigated at the pH of maximum fibril formation, 4.4 and 5.0, respectively. Although holoRBP had a small pH-dependent increase in turbidity as a result of precipitation, we minimized this complication by performing assays at the pH maximum of TTR fibril formation.
The first set of experiments focused on the concentration-dependent effect of holoRBP on TTR fibril formation. Wild-type or L55P TTR (7.2 μM)‡ solutions were prepared with and without holoRBP (3.6, 7.2, or 14.4 μM) in 10 mM sodium phosphate/100 mM KCl/1 mM EDTA (pH 7.6) and incubated at 37°C for 2 h. The pH was lowered to 4.4 or 5.0 for wild-type and L55P TTR, respectively, with 495 μl of 200 mM sodium acetate/100 mM KCl/1 mM EDTA (pH 4.2 or 4.8, respectively). These samples, with a final TTR concentration of 3.6 μM‡, were incubated for 72 h at 37°C.
The second set of experiments examined the effect of holoRBP on the kinetics of TTR fibril formation. Wild-type or L55P TTR (7.2 μM)‡ solutions were prepared with and without holoRBP (14.4 μM) in 10 mM sodium phosphate/100 mM KCl/1 mM EDTA (pH 7.6) and incubated at 37°C for 2 h. The pH was lowered to 4.4 or 5.0 for wild-type and L55P TTR, respectively, with 495 μl of 200 mM sodium acetate/100 mM KCl/1 mM EDTA (pH 4.2 or 4.8, respectively). These samples, with a final TTR concentration of 3.6 μM‡, were incubated at 37°C for 15, 24, 39, 48, 63, 72, 96, or 120 h.
The third set of experiments examined the effect of holoRBP on small molecule inhibition of TTR fibril formation. Solutions of wild-type or L55P TTR (7.2 μM)‡ with and without holoRBP (7.2 μM) were prepared in 10 mM sodium phosphate/100 mM KCl/1 mM EDTA (pH 7.6) and incubated at 37°C for 2 h. Aliquots (500 μl) of these mixtures were incubated in triplicate with 5 μl of T4, flufenamic acid, or diclofenac in DMSO (360, 720, or 1440 μM) or 5 μl of DMSO without any inhibitor for 1 h at 37°C. The pH was lowered to 4.4 or 5.0 for wild-type and L55P TTR, respectively, with 495 μl of 200 mM sodium acetate/100 mM KCl/1 mM EDTA (pH 4.2 or 4.8, respectively). These samples, with a final TTR concentration of 3.6 μM‡, were incubated for 72 h at 37°C.
To measure the amount of fibrils formed, samples were vortexed for 5 sec to resuspend the precipitate, and the turbidity at 400 nm was measured by using a Hewlett–Packard UV spectrometer. The amount of amyloid formed was also quantified by the amount of Congo red bound (26). Of each vortexed suspension, 50 μl was added to 1150 μl of 10 μM Congo red in 5 mM sodium phosphate/150 mM NaCl (pH 7.5). The absorbance was measured at 477 and 540 nm, and the amount of Congo red bound to amyloid fibrils was calculated to determine the quantity of fibrils in the suspension: moles of Congo red bound per liter of amyloid suspension = A540 nm/25295 − A477 nm/46306. For the endpoint studies, turbidity caused by holoRBP precipitation was subtracted, and values were normalized to the values obtained for TTR alone after 72 h.
Results
HoloRBP Binds TTR at both Neutral and Low pH.
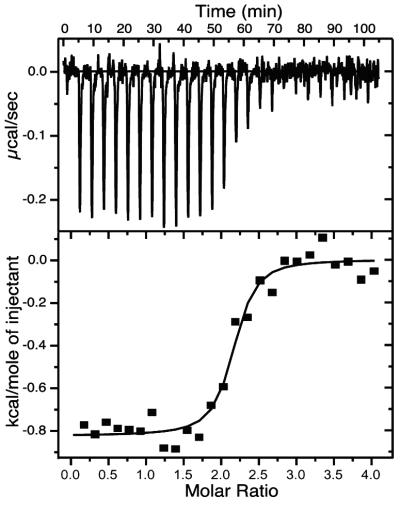
Previous experiments evaluating the TTR⋅holoRBP binding constant and stoichiometry used holoRBP isolated from human plasma. We performed ITC experiments to confirm that recombinant holoRBP exhibited similar affinity for TTR. Each of six ITC runs with wild-type TTR and holoRBP were individually fit to calculate Ka, ΔH, and the number of sites n (Fig. 2, Kd was determined as the inverse of Ka). Averaging the results from six runs yielded a Kd of 294 ± 165 nM (ΔG = −8.837 ± 0.337 kcal/mol), ΔH = −0.884 ± 0.191 kcal/mol, and n = 2.110 ± 0.048. The dissociation constant measured by ITC was in the middle of the broad literature range (Kd = 70–700 nM) derived from various methods (12, 14, 21, 27–30) for plasma holoRBP.
Figure 2.
Isothermal calorimetry data for holoRBP (980 μM) titrated into wild-type TTR (50 μM)‡. The isotherm was fit to a model of equivalent sites by using the variables Ka, ΔH, and n (Kd is determined as the inverse of Ka). Values from 6 titrations were averaged to yield Kd = 294 ± 165 nM (ΔG = −8.837 ± 0.337 kcal/mol), ΔH = −0.884 ± 0.191 kcal/mol, and the number of sites n = 2.110 ± 0.048.
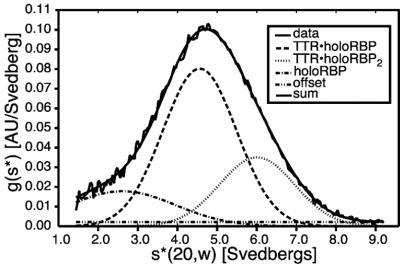
We also demonstrated binding of holoRBP to TTR at low pH where holoRBP inhibition of TTR fibril formation was evaluated. ITC experiments were not possible at low pH, however, because TTR fibril formation occurred rapidly at the concentration required for ITC measurements (50 μM TTR)‡, impeding data collection. To evaluate binding at low pH, we used analytical ultracentrifugation (AUC) studies at the high end of the physiological TTR concentration range. Sedimentation velocity studies on the TTR⋅holoRBP mixture (7.2 μM)‡ were performed with wild-type TTR at pH 7.6, 5.5, 5.0, and 4.4. Absorbance was measured at 330 nm, where only species containing retinol were observed. The best fit to the data included three species: TTR⋅holoRBP, TTR⋅holoRBP2, and holoRBP monomer (Fig. 3). Only a modest decrease was observed in the mole fraction of the TTR⋅holoRBP complexes at low pH relative to neutral pH (Table 1), agreeing with earlier studies using holoRBP isolated from plasma (13, 21). Because more than half of the RBP was complexed to TTR, we determined that the Kd was lower than 7.2 μM over the pH range of 4.4–7.6.
Figure 3.
Sedimentation velocity data for wild-type TTR (7.2 μM)‡ and holoRBP (7.2 μM) at pH 7.6. The data were fit to a three-species model of TTR⋅holoRBP, TTR⋅holoRBP2, and holoRBP monomer. More than 80% of holoRBP was complexed at pH 7.6, yielding a Kd lower than 7.2 μM.
Table 1.
Sedimentation velocity experiments (monitored at 330 nm) evaluating binding of wild-type (WT) or L55P TTR (7.2 μM)† to holoRBP (7.2 μM)
| Sample description | TTR⋅holoRBP2 complex MW = 97 kDa | TTR⋅holoRBP complex MW = 76 kDa | HoloRBP monomer MW = 21 kDa |
|---|---|---|---|
| WT TTR and holoRBP (pH 4.4) | Mole fraction = 0.19 | Mole fraction = 0.54 | Mole fraction = 0.27 |
| SC = 6.060 ± 0.076 S | SC = 4.492 ± 0.039 S | SC = 2.935 ± 0.081 S | |
| WT TTR and holoRBP (pH 5.0) | Mole fraction = 0.23 | Mole fraction = 0.68 | Mole fraction = 0.09 |
| SC = 6.122 ± 0.057 S | SC = 4.458 ± 0.043 S | SC = 2.249 ± 0.360 S | |
| WT TTR and holoRBP (pH 5.5) | Mole fraction = 0.30 | Mole fraction = 0.62 | Mole fraction = 0.08 |
| SC = 5.700 ± 0.053 S | SC = 4.318 ± 0.040 S | SC = 2.539 ± 0.446 S | |
| WT TTR and holoRBP (pH 7.6) | Mole fraction = 0.25 | Mole fraction = 0.57 | Mole fraction = 0.18 |
| SC = 6.007 ± 0.053 S | SC = 4.562 ± 0.044 S | SC = 2.609 ± 0.230 S | |
| L55P TTR and holoRBP (pH 7.6) | Mole fraction = 0.28 | Mole fraction = 0.72 | Not included in fit |
| SC = 6.288 ± 0.044 S | SC = 4.592 ± 0.026 S |
Binding of wild-type TTR to holoRBP was studied at pH 4.4, 5.0, 5.5, and 7.6. Binding of L55P TTR to holoRBP was studied at pH 7.6. The time-dependent concentration vs. radial distance data were fit to a three-species model of TTR⋅holoRBP, TTR⋅holoRBP2, and holoRBP monomer (described in Materials and Methods and shown in Fig. 3). The relative mole fractions and sedimentation coefficients (SC, in Svedberg units) were obtained from Gaussian curves fit to the g(s*) sedimentation coefficient distribution by using the molecular weights (MW) of the three species. More than half of the holoRBP was complexed to TTR, implying that the Kd was lower than 7.2 μM.
We also confirmed that L55P TTR binds holoRBP at pH 7.6 (Table 1), comparable to the wild-type TTR⋅holoRBP interaction. The best fit included two species, TTR⋅holoRBP and TTR⋅holoRBP2, yielding a Kd lower than 7.2 μM. Low pH experiments with L55P TTR and holoRBP were not practical because measurements of absorbance at 330 nm were compromised by the rapid increase in TTR turbidity.
HoloRBP Inhibits TTR Fibril Formation.
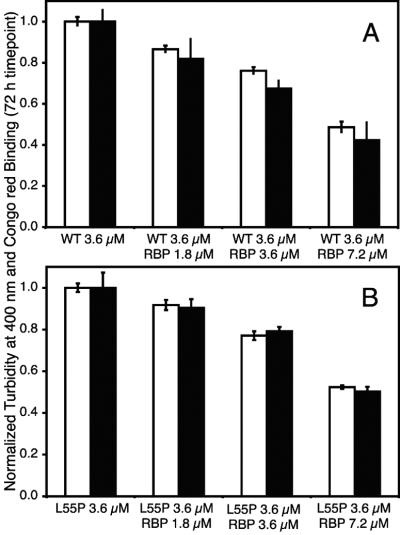
The wild-type and L55P TTR (3.6 μM)‡ amyloidogenicity as a function of added holoRBP (0, 1.8, 3.6, or 7.2 μM) was evaluated under acidic conditions by turbidity and Congo red binding (Fig. 4). Wild-type and L55P TTR amyloid fibril formation was reduced in the presence of holoRBP in a concentration-dependent manner to very similar extents. When two equivalents of holoRBP were added, fibril formation was reduced ≈50%. This concentration-dependent reduction of amyloidogenicity clearly demonstrated that bound holoRBP reduced TTR fibril formation in vitro. Similar experiments with BSA did not show an inhibitory effect (data not shown). Because fibril formation is thought to occur in the acidic environment of the lysosome during protein turnover, we expect these results to be relevant in vivo.
Figure 4.
Bar graph depicting the extent of wild-type (pH 4.4) (A) and L55P TTR (pH 5.0) (B) fibril formation after 72 h. TTR (3.6 μM)‡ was incubated with increasing concentrations of holoRBP (0, 1.8, 3.6, and 7.2 μM) from left to right. Fibril formation was quantified by two techniques at each holoRBP concentration: turbidity at 400 nm (white bars) and Congo red binding (black bars). Values were normalized to fibril formation of TTR alone.
HoloRBP Slows Rate of TTR Fibril Formation.
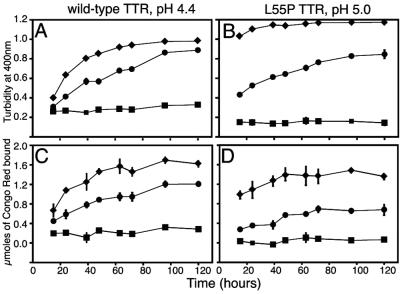
We performed time course studies to complement the single timepoint data described previously. The rates of wild-type and L55P TTR fibril formation were strikingly slower with holoRBP present (Fig. 5). In the absence of holoRBP, wild-type and L55P TTR amyloid fibril formation reached a maximum after 72 and 48 h, respectively (Fig. 5, diamonds). In the presence of holoRBP, wild-type and L55P TTR required more than 100 h to reach a maximum in fibril formation (Fig. 5, circles). The maximum fibril formation was reduced by 15–25% for wild-type TTR (Fig. 5 A and C) and by 33–50% for L55P TTR (Fig. 5 B and D). The steady increase throughout the time course was likely a result of dissociation of holoRBP, allowing TTR to dissociate to monomer and form fibrils.
Figure 5.
Time course of wild-type (pH 4.4) (A and C) and L55P TTR (pH 5.0) (B and D) fibril formation. TTR (3.6 μM)‡ was incubated with holoRBP (7.2 μM). Fibril formation was quantified by two techniques at each timepoint: turbidity at 400 nm (A and B) and Congo red binding (C and D). Fibril formation from TTR alone is shown by diamonds, fibril formation from the TTR⋅holoRBP complex is shown by circles, and precipitation from holoRBP is shown by squares.
HoloRBP Enhances T4 and Small Molecule Inhibitor Activity.
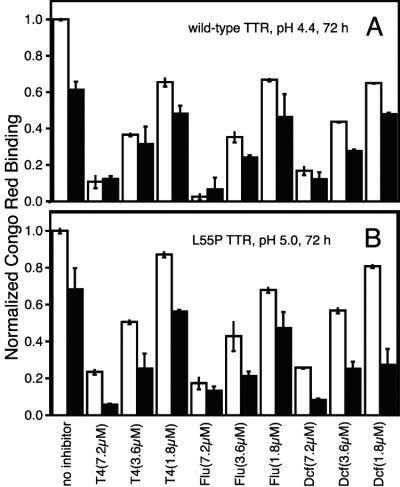
Previous work demonstrates that the affinity of T4 for TTR at neutral pH is unaffected by bound holoRBP (21). Our goal was to evaluate the effect of holoRBP, if any, on the ability of T4 and other small molecules to bind tetrameric TTR and inhibit fibril formation under slightly acidic conditions. The inhibitory effect of T4 was investigated over a range of concentrations (1.8, 3.6, 7.2 μM) for wild-type and L55P TTR fibril formation (3.6 μM)‡ with and without holoRBP (3.6 μM) added. Congo red binding (Fig. 6) and turbidity (similar, data not shown) were used to quantify amyloidogenicity. The combination of T4 and holoRBP was more efficacious than either one alone with respect to inhibiting L55P TTR amyloidogenicity (Fig. 6B). Although T4 decreased the amyloidogenicity of the wild-type TTR⋅holoRBP complex (Fig. 6A), this reduction was not as pronounced as the inhibition seen for wild-type TTR without holoRBP. The same trends observed for T4 were also seen with the small molecules flufenamic acid and diclofenac, known to inhibit TTR fibril formation through stabilizing the TTR tetramer (31, 32).
Figure 6.
Bar graph depicting the extent of wild-type (pH 4.4) (A) and L55P TTR (pH 5.0) (B) fibril formation after 72 h. TTR (3.6 μM)‡ alone (white bars) or with equimolar holoRBP added (black bars) was incubated in the presence of three small molecule fibril formation inhibitors (flu, flufenamic acid; dcf, diclofenac) at three concentrations (1.8, 3.6, and 7.2 μM). Fibril formation was quantified by using Congo red binding and normalized to fibril formation of TTR alone.
Discussion
The binding of recombinant holoRBP to wild-type TTR at neutral pH was indistinguishable from that of holoRBP isolated from plasma, with a Kd of 294 ± 165 nM determined by ITC (Fig. 2). Similar affinity under the acidic conditions used for fibril formation was demonstrated by sedimentation velocity experiments (Table 1), consistent with previous results obtained with the plasma protein (13, 21). Retention of the binding interaction between holoRBP and TTR under acidic conditions provides a mechanism for holoRBP to affect TTR fibril formation.
HoloRBP inhibited both wild-type and L55P TTR fibril formation in vitro in a concentration-dependent manner, with ≈50% inhibition observed at a stoichiometry of two equivalents of holoRBP bound per TTR tetramer (Fig. 4). HoloRBP binding to TTR stabilized the tetramer and prevented its dissociation to the alternatively folded monomer required for TTR fibril formation. Mass spectrometry experiments also demonstrated that holoRBP stabilized the TTR tetramer (33). In the presence of bound holoRBP, the rate of TTR fibril formation was slowed and the yield of fibril formation was decreased by up to 50% in the case of L55P TTR (Fig. 5). This evidence suggested that variability in the holoRBP concentration in plasma should influence the course of senile systemic amyloidosis and familial amyloid polyneuropathy, providing support for the multigenic hypothesis. Because holoRBP levels in plasma are affected by retinol levels (34–37), enzymes that impact retinol metabolism and transport would also affect TTR fibril formation.
We demonstrated that T4 dramatically inhibited TTR fibril formation in the context of both the TTR⋅holoRBP complex and the TTR tetramer (Fig. 6). Although T4 is a native ligand for TTR, only 5–15% of the TTR binding capacity is typically used in plasma as T4 is primarily bound to thyroid-binding globulin (TBG). Therefore, genes controlling the biosynthesis, transport, and degradation of T4 and genes encoding other T4 binding proteins will affect plasma T4 concentrations. In fact, 15 single-site variants of TBG are already known (38). Variations in plasma T4 concentration will influence the T4 binding stoichiometry to TTR, which strongly influenced TTR amyloidogenicity as demonstrated within this article. The observation that small molecule inhibitors acted synergistically with holoRBP to inhibit L55P TTR fibril formation was not surprising (Fig. 6B). It was surprising that even though the small molecule inhibitors further reduced wild-type TTR amyloidogenicity in the context of the TTR⋅holoRBP complex, the inhibitors were more effective in acting on wild-type TTR not bound to RBP (Fig. 6A).
We estimate that at least 70 genes (Table 2) are responsible for controlling holoRBP and T4 binding stoichiometry to TTR (38–47). Biophysical studies presented in this article demonstrated that the stoichiometry of the TTR4⋅holoRBPn=0–2⋅ thyroxinem=0–2 complex markedly influenced TTR amyloidogenicity in vitro, which may influence the course of senile systemic amyloidosis and familial amyloid polyneuropathy in vivo and explain the variations in clinical phenotypes. Having identified the obvious modifier genes, there will undoubtedly be numerous others that are now easier to identify given the emerging human genome sequence and clinical information.
Table 2.
Tabulation of 70 proteins that could impact the stoichiometry of the TTR4⋅holoRBPn=0−2⋅thyroxinem=0−2 quaternary structure
| Function | Selected proteins |
|---|---|
| TTR regulation | Hepatocyte nuclear factor-3 (HNF-3α, HNF-3β, HNF-3γ); hepatocyte nuclear factor-6 (HNF-6) |
| Activating protein 1 (AP-1); C/EBPα, C/EBPβ, C/EBPδ | |
| Thyroid hormone synthesis | Thyroglobin (Tg); thyroid peroxidase (TPO); Na+/I− symporter (NIS) |
| Thyroid stimulating hormone (thyrotropin, TSH); TSH receptor | |
| Thyrotropin-releasing hormone (TRH); TRH receptor | |
| Thyroid asialoglycoprotein receptor; N-acetylglucosamine receptor | |
| Transcription factors (TTF-1, TTF-2, Pax-8) | |
| Chaperones (BiP, GRP94, Erp72, calnexin, GRP72, GRP170, ER60, calreticulin) | |
| Proteases (cathepsin B, D, and L, lysosomal dipeptidase I) | |
| Thyroid hormone degradation | Type I, II, and III 5′iodothyronine deiodinase |
| l-amino acid oxidase; thyroid hormone aminotransferase | |
| Thyroid hormone binding proteins | Thyroxine binding globulin (TBG); albumin; high-density lipoproteins (HDL) |
| RBP regulation | Retinoic acid receptor (RARα, RARβ, RARγ); retinoid X receptor (RXRα, RXRβ, RXRγ) |
| cAMP response element binding protein (CREBs); basal transcription factor TFIIB | |
| Retinoid binding proteins | Cellular retinol-binding protein (CRBP, CRBP(II)) |
| Cellular retinoic acid-binding protein (CRABP, CRABP(II)) | |
| Epididymal retinoic acid-binding protein (ERABP) | |
| Interphotoreceptor retinol-binding protein (IRBP) | |
| Cellular retinal-binding protein (CRALBP); β-lactoglobin | |
| Retinoid synthesis and metabolism | β-carotene-15,15′-dioxygenase; short-chain alcohol dehydrogenases (SCAD) |
| Pancreatic non-specific lipase; retinyl palmitate hydrolase (RPH) | |
| Acyl-CoA:retinol acyltransferase (ARAT); lecithin:retinol acyltransferase (LRAT) | |
| Bile-salt-dependent retinyl ester hydrolase (BSDREH) | |
| Bile-salt-independent retinyl ester hydrolase (BSIREH) | |
| Intestinal cytosolic retinal reductase; intestinal microsomal retinal reductase | |
| Retinol dehydrogenase (RoDH-1, RoDH-2); retinal dehydrogenase (RalDH-1, RalDH-2) |
Proteins that regulate TTR expression and metabolism, RBP expression and metabolism, T4 synthesis and metabolism, and retinol metabolism directly impact the amount of each compound available for complex formation. Other binding proteins for retinol and T4 affect the amount of each molecule available by sequestering the molecules into different protein complexes or locations.
Acknowledgments
We acknowledge primary financial support from the National Institutes of Health Grant R01 DK46335 and secondary support from the Skaggs Institute of Chemical Biology, the Lita Annenberg Hazen Foundation, the National Science Foundation, and the William and Sharon Bauce Foundation. We thank Dr. Peter Kim for providing the pMMHA vector for TTR expression. We thank Dr. Y. Xie, Dr. H. M. Petrassi, S. Deechongkit, H. E. Purkey, and K. P. Chiang for helpful discussions about experiments.
Abbreviations
- RBP
retinol-binding protein
- holoRBP
RBP⋅all-trans-retinol complex
- TTR
transthyretin
- T4
l-thyroxine (thyroid hormone)
- ITC
isothermal titration calorimetry
Footnotes
This paper was submitted directly (Track II) to the PNAS office.
The molar concentration for TTR is given for the tetrameric form. The concentration of the equivalent subunits is 4 times the given concentration.
References
- 1.Kelly J W. Curr Opin Struct Biol. 1996;6:11–17. doi: 10.1016/s0959-440x(96)80089-3. [DOI] [PubMed] [Google Scholar]
- 2.Blake C, Serpell L. Structure (London) 1996;4:989–998. doi: 10.1016/s0969-2126(96)00104-9. [DOI] [PubMed] [Google Scholar]
- 3.Jacobson D R, Buxbaum J N. Adv Hum Genet. 1991;20:69–123. doi: 10.1007/978-1-4684-5958-6_2. [DOI] [PubMed] [Google Scholar]
- 4.Kelly J W, Lansbury P T., Jr Amyloid. 1994;1:186–205. [Google Scholar]
- 5.Selkoe D J. Science. 1997;275:630–631. doi: 10.1126/science.275.5300.630. [DOI] [PubMed] [Google Scholar]
- 6.Selkoe D J. Nature (London) 1999;399:A23–A31. doi: 10.1038/399a023. [DOI] [PubMed] [Google Scholar]
- 7.Misu K-i, Hattori N, Nagamatsu M, Ikeda S-i, Ando Y, Nakazato M, Takei Y-i, Hanyu N, Usui Y, Tanaka F, et al. Brain. 1999;122:1951–1962. doi: 10.1093/brain/122.10.1951. [DOI] [PubMed] [Google Scholar]
- 8.Holmgren G, Costa P M P, Andersson C, Asplund K, Steen L, Beckman L, Nylander P-O, Teixeira A, Saraiva M J M, Costa P P. J Med Genet. 1994;31:351–354. doi: 10.1136/jmg.31.5.351. [DOI] [PMC free article] [PubMed] [Google Scholar]
- 9.Saraiva M J M. J Peripher Nerv Syst. 1996;1:179–188. [PubMed] [Google Scholar]
- 10.Jacobson D R, Pastore R D, Yaghoubian R, Kane I, Gallo G, Buck F S, Buxbaum J N. N Engl J Med. 1997;336:466–473. doi: 10.1056/NEJM199702133360703. [DOI] [PubMed] [Google Scholar]
- 11.Robbins J. In: Werner and Ingbar's The Thyroid: A Fundamental and Clinical Text. Braverman L E, Utiger R D, editors. Philadelphia: Lippincott; 1996. pp. 96–110. [Google Scholar]
- 12.Goodman D S. Ann NY Acad Sci. 1980;348:378–390. doi: 10.1111/j.1749-6632.1980.tb21314.x. [DOI] [PubMed] [Google Scholar]
- 13.Peterson P A. J Biol Chem. 1971;246:44–49. [PubMed] [Google Scholar]
- 14.Noy N, Slosberg E, Scarlata S. Biochemistry. 1992;31:11118–11124. doi: 10.1021/bi00160a023. [DOI] [PubMed] [Google Scholar]
- 15.Miroy G J, Lai Z, Lashuel H A, Peterson S A, Strang C, Kelly J W. Proc Natl Acad Sci USA. 1996;93:15051–15056. doi: 10.1073/pnas.93.26.15051. [DOI] [PMC free article] [PubMed] [Google Scholar]
- 16.Blake C C F, Oatley S J. Nature (London) 1977;268:115–120. doi: 10.1038/268115a0. [DOI] [PubMed] [Google Scholar]
- 17.Wojtczak A, Cody V, Luft J R, Pangborn W. Acta Crystallogr D. 1996;52:758–765. doi: 10.1107/S0907444996003046. [DOI] [PubMed] [Google Scholar]
- 18.Nilsson S F, Rask L, Peterson P A. J Biol Chem. 1975;250:8554–8563. [PubMed] [Google Scholar]
- 19.Monaco H L, Rizzi M, Coda A. Science. 1995;268:1039–1041. doi: 10.1126/science.7754382. [DOI] [PubMed] [Google Scholar]
- 20.Naylor H M, Newcomer M E. Biochemistry. 1999;38:2647–2653. doi: 10.1021/bi982291i. [DOI] [PubMed] [Google Scholar]
- 21.Raz A, Goodman D S. J Biol Chem. 1969;244:3230–3237. [PubMed] [Google Scholar]
- 22.Xie Y, Lashuel H A, Miroy G J, Dikler S, Kelly J W. Protein Expression Purif. 1998;14:31–37. doi: 10.1006/prep.1998.0944. [DOI] [PubMed] [Google Scholar]
- 23.Lashuel H A, Wurth C, Woo L, Kelly J W. Biochemistry. 1999;38:13560–13573. doi: 10.1021/bi991021c. [DOI] [PubMed] [Google Scholar]
- 24.Philo J S. Anal Biochem. 2000;279:151–163. doi: 10.1006/abio.2000.4480. [DOI] [PubMed] [Google Scholar]
- 25.Petrassi H M, Klabunde T, Sacchettini J, Kelly J W. J Am Chem Soc. 2000;122:2178–2192. [Google Scholar]
- 26.Lai Z, Colon W, Kelly J W. Biochemistry. 1996;35:6470–6482. doi: 10.1021/bi952501g. [DOI] [PubMed] [Google Scholar]
- 27.Heller J, Horwitz J. J Biol Chem. 1974;249:5933–5938. [PubMed] [Google Scholar]
- 28.Kopelman M, Cogan U, Mokady S, Shinitzky M. Biochim Biophys Acta. 1976;439:449–460. doi: 10.1016/0005-2795(76)90082-9. [DOI] [PubMed] [Google Scholar]
- 29.Peterson P A, Rask L. J Biol Chem. 1971;246:7544–7550. [PubMed] [Google Scholar]
- 30.Van Jaarsveld P P, Edelhoch H, Goodman D S, Robbins J. J Biol Chem. 1973;248:4698–4705. [PubMed] [Google Scholar]
- 31.Baures P W, Peterson S A, Kelly J W. Bioorg Med Chem. 1998;6:1389–1401. doi: 10.1016/s0968-0896(98)00130-8. [DOI] [PubMed] [Google Scholar]
- 32.Peterson S A, Klabunde T, Lashuel H A, Purkey H, Sacchettini J C, Kelly J W. Proc Natl Acad Sci USA. 1998;95:12956–12960. doi: 10.1073/pnas.95.22.12956. [DOI] [PMC free article] [PubMed] [Google Scholar]
- 33.Rostom A A, Sunde M, Richardson S J, Schreiber G, Jarvis S, Bateman R, Dobson C M, Robinson C V. Proteins Struct Funct Genet. 1998;2:3–11. doi: 10.1002/(sici)1097-0134(1998)33:2+<3::aid-prot2>3.3.co;2-8. [DOI] [PubMed] [Google Scholar]
- 34.Marinari L, Lenich C M, Ross A C. J Lipid Res. 1987;28:941–948. [PubMed] [Google Scholar]
- 35.Muto Y, Smith J E, Milch P O, Goodman D S. J Biol Chem. 1972;247:2542–2550. [PubMed] [Google Scholar]
- 36.Peterson P A, Rask L, Östberg L, Andersson L, Kamwendo F, Pertoft H. J Biol Chem. 1973;248:4009–4022. [PubMed] [Google Scholar]
- 37.Smith J E, Borek C, Goodman D S. Cell. 1978;15:865–873. doi: 10.1016/0092-8674(78)90271-4. [DOI] [PubMed] [Google Scholar]
- 38.DeGroot L J, Jameson J L. Endocrinology. Vol. 2. Philadelphia: Saunders; 2001. pp. 1279–1326. [Google Scholar]
- 39.Blaner W S, Hendriks H F J, Brouwer A, de Leeuw A M, Knook D L, Goodman D S. J Lipid Res. 1985;26:1241–1251. [PubMed] [Google Scholar]
- 40.Blomhoff R, Berg T, Norum K R. Chem Scr. 1987;27:169–177. [Google Scholar]
- 41.Jessen K A, Satre M A. Arch Biochem Biophys. 1998;357:126–130. doi: 10.1006/abbi.1998.0821. [DOI] [PubMed] [Google Scholar]
- 42.Marino M, McCluskey R T. Am J Physiol. 2000;279:C1295–C1306. doi: 10.1152/ajpcell.2000.279.5.C1295. [DOI] [PubMed] [Google Scholar]
- 43.Napoli J L. Semin Cell Dev Biol. 1997;8:403–415. doi: 10.1006/scdb.1997.0164. [DOI] [PubMed] [Google Scholar]
- 44.Panariello L, Quadro L, Trematerra S, Colantuoni V. J Biol Chem. 1996;271:25524–25532. doi: 10.1074/jbc.271.41.25524. [DOI] [PubMed] [Google Scholar]
- 45.Qian X, Samadani U, Porcella A, Costa Robert H. Mol Cell Biol. 1995;15:1364–1376. doi: 10.1128/mcb.15.3.1364. [DOI] [PMC free article] [PubMed] [Google Scholar]
- 46.Samadani U, Qian X, Costa R H. Gene Expression. 1996;6:23–33. [PMC free article] [PubMed] [Google Scholar]
- 47.Samadani U, Costa R H. Mol Cell Biol. 1996;16:6273–6284. doi: 10.1128/mcb.16.11.6273. [DOI] [PMC free article] [PubMed] [Google Scholar]


