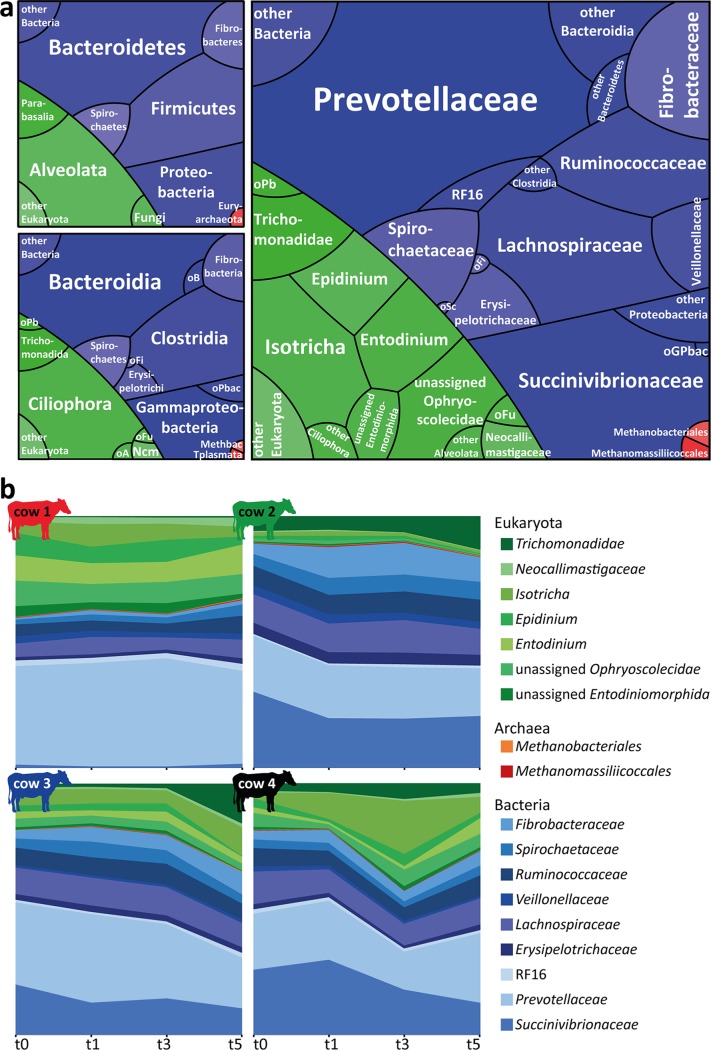
FIG 2 .
Rumen microbiome community composition and temporal dynamics. (a) Three domain profiles showing the overall rumen microbial community composition on the phylum (upper left panel), class (lower left panel), and family (right panel) levels. Tile sizes reflect the average relative abundances of eukaryotic (green), bacterial (blue), and archaeal (red) taxa observed in the 16 rumen metatranscriptomes. Taxa which could not be assigned on the family level and/or showed relative abundance levels of ≤1% are shown on higher taxonomic levels. oB, other Bacteroidetes; oPb, other Parabasalia; oFi, other Firmicutes; oPbac, other Proteobacteria; oFu, other fungi; oA, other Alveolata; Ncm, Neocallimastigomycota; Methbac, Methanobacteria; Tplasmata, Thermoplasmata; oSc, other Spirochaetes; oGPbac, other Gammaproteobacteria. (b) Microbial communities within each cow over time (low-abundance taxa were excluded). All taxa detected in the rumen microbiomes and their relative abundances are listed in Table S4.

