

Abstract
An important topic in contemporary auditory science is supra-threshold hearing. Difficulty hearing at conversational speech levels in background noise has long been recognized as a problem of sensorineural hearing loss, including that associated with aging (presbyacusis). Such difficulty in listeners with normal thresholds has received more attention recently, especially associated with descriptions of synaptopathy, the loss of auditory nerve (AN) fibers as a result of noise exposure or aging. Synaptopathy has been reported to cause a disproportionate loss of low- and medium-spontaneous rate (L/MSR) AN fibers. Several studies of synaptopathy have assumed that the wide dynamic ranges of L/MSR AN fiber rates are critical for coding supra-threshold sounds. First, this review will present data from the literature that argues against a direct role for average discharge rates of L/MSR AN fibers in coding sounds at moderate to high sound levels. Second, the encoding of sounds at supra-threshold levels is examined. A key assumption in many studies is that saturation of AN fiber discharge rates limits neural encoding, even though the majority of AN fibers, high-spontaneous rate (HSR) fibers, have saturated average rates at conversational sound levels. It is argued here that the cross-frequency profile of low-frequency neural fluctuation amplitudes, not average rates, encodes complex sounds. As described below, this fluctuation-profile coding mechanism benefits from both saturation of inner hair cell (IHC) transduction and average rate saturation associated with the IHC-AN synapse. Third, the role of the auditory efferent system, which receives inputs from L/MSR fibers, is revisited in the context of fluctuation-profile coding. The auditory efferent system is hypothesized to maintain and enhance neural fluctuation profiles. Lastly, central mechanisms sensitive to neural fluctuations are reviewed. Low-frequency fluctuations in AN responses are accentuated by cochlear nucleus neurons which, either directly or via other brainstem nuclei, relay fluctuation profiles to the inferior colliculus (IC). IC neurons are sensitive to the frequency and amplitude of low-frequency fluctuations and convert fluctuation profiles from the periphery into a phase-locked rate profile that is robust across a wide range of sound levels and in background noise. The descending projection from the midbrain (IC) to the efferent system completes a functional loop that, combined with inputs from the L/MSR pathway, is hypothesized to maintain “sharp” supra-threshold hearing, reminiscent of visual mechanisms that regulate optical accommodation. Examples from speech coding and detection in noise are reviewed. Implications for the effects of synaptopathy on control mechanisms hypothesized to influence supra-threshold hearing are discussed. This framework for understanding neural coding and control mechanisms for supra-threshold hearing suggests strategies for the design of novel hearing aid signal-processing and electrical stimulation patterns for cochlear implants.
Keywords: auditory, neural coding, speech, computational models
INTRODUCTION
Significant effort in auditory science has recently been directed to the phenomenon of hidden hearing loss, a term coined by Schaette and McAlpine (2011) to refer to synaptopathy, or loss of auditory nerve (AN) fibers as a result of noise exposure or aging (reviewed in Kujawa and Liberman 2015; Liberman and Kujawa 2017). A benefit of this effort has been the direction of attention to problems of supra-threshold hearing. Historically, considerable focus in both clinical and basic science has been on detection thresholds, ranging from audiograms, to studies of cochlear mechanisms for sharp tuning and sensitivity, to the measurement of threshold tuning curves at all levels of the auditory pathway. The recognition that many people, not just those with measurable changes in thresholds, have difficulty understanding supra-threshold speech makes it clear that the challenges of supra-threshold hearing—that is, practical everyday hearing—are separable from sensitivity to low-level stimuli.
Particular attention has been placed on the question “Which neurons of the peripheral auditory system encode supra-threshold stimuli?” A popular answer has been that low- and medium-spontaneous rate (L/MSR) AN fibers have a special role. The crux of this argument is the difference in dynamic range of average discharge rate for different AN types, measured in response to pure tones in quiet at the fibers’ characteristic frequency (CF) (Fig. 1a). Because many L/MSR fibers have higher thresholds and larger dynamic ranges than high-spontaneous rate (HSR) fibers, it has been widely concluded that the former must support coding of sounds at levels for which HSR fibers have saturated average rates (e.g., Liberman 1978; Schalk and Sachs 1980; Viemeister 1988; Winter et al. 1990; Winter and Palmer 1991; Bharadwaj et al. 2014; Huet et al. 2016; review: Delgutte 1996, Kujawa and Liberman 2015). The first part of this review compiles evidence from the literature that provides a counter argument to the role of average rates of L/MSR fibers in coding of mid- to high-level stimuli.
Fig. 1.

Properties of AN average discharge rate vs. sound level functions. a Schematic rate-level functions for low- (cyan), medium- (blue), and high- (red) spontaneous rate AN fibers. (from Bharadwaj et al. 2014; permission requested). b Synchronization to the envelope of SAM tones vs. sound level for LSR (blue) and HSR (red) AN fibers (from Bharadwaj et al. 2014, after Joris and Yin 1992; reprinted with permission). c Rate-level functions for three AN fibers with different spontaneous rates, all with CF near 1 kHz (from Liberman 1978; reprinted with permission). Arrow: Saturated discharge rate of low-CF LSR AN fiber. d Schematic illustration of the dependence of the shapes of AN rate-level functions with different thresholds on basilar membrane compression (from Yates et al. 1992; reprinted with permission). The threshold levels (gray lines) of the three different types of AN fibers fall at different points along the compressive curve describing the basilar membrane input-output function, thus compression affects the rate-level functions in varying degrees: the dynamic range of HSR fibers are largely confined to levels below compression, whereas LSR fibers are affected by compression throughout the dynamic range of their rate-level functions. e Dynamic range adaptation (DRA) in a HSR AN fiber. The black symbols and line represent a typical rate-level function based on responses to tones at CF that were evenly distributed across the full range of SPLs. Other symbols and lines were based on responses to different level contexts, or sets of tones at CF in which 80 % of the tones were in the SPL range highlighted by the matching color bar, and the remaining 20 % covered the remainder of the level range. Note that the response rates to the lowest SPLs also depend on overall context. (from Wen et al. 2009; reprinted with permission). f Variation in spontaneous rate over time. This HSR AN fiber’s spontaneous rate varies between ~ 35 and 85 sp/s. Solid: average rate estimated using 0.5 s windows, over a period of 15 s. Dashed: average rate estimated using 5 s windows, over a period of 150 s. (from Teich et al. 1990; reprinted with permission)
A different but related question is “Why are conversational speech levels (~ 65–75 dB SPL), in the middle of the “supra-threshold” hearing range, so important?” Given the wide range of audible sound levels, why do humans converse, listen to music, etc. at these levels, even when ambient noise levels are very low? And why do deficits in hearing so adversely affect hearing at conversational sound levels? The second part of this Commentary presents the argument that this supra-threshold range of sound levels is special because, in the healthy ear, complex sounds at these levels yield robust profiles across peripheral frequency channels in the amplitudes of low-frequency neural fluctuations (Fig. 2). Even AN fibers that are nominally saturated, in terms of average rate, convey information in response fluctuations. These fluctuations are shaped in different ways by saturation of IHC transduction and by adaptation of the IHC-AN synapse. The neural fluctuation profiles that are established in the periphery are mapped into a representation at the level of the midbrain (inferior colliculus, IC) (Fig. 3), where neurons have response rates that vary systematically with the frequency and amplitude of low-frequency fluctuations on their inputs (Joris et al. 2004).
Fig. 2.

From vowel spectrum to AN fluctuation profile. The spectrum of the vowel /æ/ is in the foreground. Model HSR AN PSTHs are for several CFs spanning two spectral peaks in the vowel, the two formant frequencies F1 (700 Hz) and F2 (1800 Hz). The slow fluctuations in the AN PSTHs are highlighted in red. AN fluctuation amplitudes are plotted as a profile across CFs in the background (blue). Note that HSR AN average discharge rates in response to the 65 dB SPL vowel are saturated across all channels, but the profile of fluctuation amplitudes code the spectral peaks. Dips in the fluctuation amplitude profile are aligned with spectral peaks
Fig. 3.

From peripheral fluctuation profile to midbrain rate profile. Top: The spectrum of the vowel /æ/ (from “had,” black line) is dominated by harmonics of the fundamental (F0 = 115 Hz) and has an overall shape that is determined by resonances of the vocal tract (Fant 1960). The spectral envelope (dashed line) highlights spectral peaks at the formant frequency locations. Responses of model AN fibers with CF = 500 Hz (below F1), 700 Hz (near F1), 1200 Hz (between F1 and F2), and 1800 Hz (near F2). Responses of AN fibers tuned near formant peaks have small low-frequency fluctuations because they are dominated by a single harmonic (synchrony capture). Fibers tuned away from spectral peaks have responses that fluctuate strongly at F0, in addition to phase-locking to harmonics near CF. Bottom: responses of a simple IC model consisting of a bandpass filter centered at 100 Hz with a bandwidth of 100 Hz (i.e., Q = 1). Model IC neurons have large differences in rate due to the differences in fluctuation amplitudes in each channel. The fluctuation amplitude profile across AN frequency channels is thus converted into a rate profile across IC neurons with bandpass modulation transfer functions (MTFs). IC neurons phase-lock to low-frequency fluctuations (review: Rees and Langner 2005). Vowel waveform is from the Hillenbrand et al. (1995) database
Discussions of AN coding tend to focus on synaptic saturation rather than IHC saturation, which is actually omitted in many peripheral models. Saturation of the synapse affects the average discharge rates of the AN fibers but does not prevent the AN responses from fluctuating (e.g., all of the responses in Figs. 2 and 3 are for rate-saturated HSR AN fibers). Rather than limiting the coding ability of AN fibers, saturation of the IHC-AN synapse, especially for HSR fibers, may benefit coding by normalizing average rates while preserving or even enhancing the amplitudes of fluctuations, which convey spectral information.
The fluctuation profiles described here are affected by saturation of IHC transduction. Therefore, control of the operating point of nonlinear IHC transduction is important to maintain fluctuation profiles in different acoustic settings. The third part of this Commentary presents the hypothesis that the function of the auditory efferent system is to enhance fluctuation profiles by controlling cochlear gain across frequency.
Fluctuation profiles are degraded by sensorineural hearing loss. The final section of this review considers strategies for clinical correction of supra-threshold fluctuation profiles using new hearing aid processing strategies. Considerations for cochlear implant stimulation strategies based on the concept of fluctuation profiles are also discussed, as they differ considerably from stimulation paradigms in current use.
An Aside: Lessons from the Visual System?
Peripheral neural fluctuation profiles, and the resulting response profiles at the level of the auditory midbrain, can be compared to representations of images in the responses of the retina. The IC and the output neurons of the retina (retinal ganglion cells) are at comparable stages of sensory processing, with both projecting directly to the sensory thalamus (Harrison and Howe 1974; Sherman and Spear 1982; Cant and Oliver 2018). Thus, the goal of “correcting” responses to supra-threshold sounds by sharpening response profiles in the auditory midbrain may benefit from a consideration of clinical correction of vision and the representation of visual images in retinal ganglion cells.
Presbyopia, or age-related loss of near vision (Helmholtz 1909; Weale 1962; Pierscionek 1993), is problematic because it affects a range of vision that is so useful in everyday life, e.g., detection of visual objects, including faces, at typical proximities and the ability to read typed print at a short distance. (The importance of the printing press in world history is certainly related to the facility of the young, healthy visual system in discriminating small shapes at a close distance.) One could think of reading printed material as “conversational-level vision,” and this ability is strongly affected by presbyopia. The source of presbyopia is mechanical and peripheral: central “blur”-driven mechanisms respond to features of the retinal output and influence the circuits that control the shape of the biological lens. When the lens loses elasticity with age, the ability of the feedback system to change the shape of the lens is diminished, and presbyopia results.
Clinical correction of vision for presbyopia requires sharpening the changes in luminance of the image on the retina. Typical presbyopia does not involve problems comparable to audibility, because visual thresholds in the aged eye remain well below the light levels experienced in daily life. Additionally, typical presbyopia is not accompanied by the auditory problem of recruitment of level (Moore 2012); a similar visual phenomenon might be unusual brightness experienced with cataracts. Correction of auditory images differs in at least three important aspects from vision: sounds must often be amplified to insure audibility, loud sounds must be avoided, and the filtering and transduction in the impaired auditory periphery has reduced nonlinearity as compared to the healthy ear. Correcting auditory responses to supra-threshold sounds requires an explicit identification and understanding of how the response profiles associated with these sounds are established and maintained in the healthy auditory system. What is the supra-threshold auditory equivalent of a “focused optical image?” Is there an auditory equivalent of the visual system’s blur-driven control system that “focuses” or enhances the auditory profiles? Is it possible that damage to, or normal aging of, mechanical effectors in the inner ear produce a diminished ability to actively “focus” supra-threshold auditory images, similar to the changes that result in presbyopia?
PART I: AUDITORY-NERVE DYNAMIC RANGES AND SUPRA-THRESHOLD HEARING
The common assumption that L/MSR fibers code supra-threshold sounds is based on the fact that many L/MSR fibers have wide average rate dynamic ranges for tones in quiet (Liberman 1978; Yates 1990; Yates et al. 1992) (Fig. 1a). It is assumed that these AN fibers code sounds at levels for which HSR fibers have saturated average rates. Furthermore, it is assumed that non-saturated dynamic ranges of AN average rates are critical for coding fluctuating sound levels, based on the level-dependence of the synchronization coefficient to sinusoidally amplitude-modulated (SAM) tones at CF (e.g., Joris and Yin 1992; Bharadwaj et al. 2014) (Fig. 1b). This section will argue that the responses of L/MSR AN fibers, based on either average rates in response to pure tones or synchrony to SAM tones at CF, cannot explain normal or impaired supra-threshold hearing of complex sounds. The evidence will be drawn from anatomical and physiological studies of the AN and more central regions, as well as from psychophysical predictions based on physiological models.
The loss of L/MSR AN fibers associated with cochlear synaptopathy in experimental animals has been hypothesized in several studies to be associated with problems in supra-threshold hearing in humans (e.g., Kujawa and Liberman 2009; Furman et al. 2013; Bharadwaj et al. 2014; Kujawa and Liberman 2015; Liberman and Kujawa 2017; but see Plack et al. 2014, 2016). Note that the focus here is on coding of supra-threshold sounds or more generally the spectral amplitudes of complex sounds at supra-threshold levels. The special case of explaining the lack of measurable changes in threshold for hidden hearing loss, despite loss of large numbers of AN fibers associated with synaptopathy, is nicely explained by signal detection theory (Oxenham 2016; Oxenham and Wojtczak 2016) and supported by recent experimental work demonstrating low behavioral thresholds despite extensive inner hair cell (Lobarinas et al. 2013) or AN fiber (Wong and Henry 2018) loss.
The fact that the average discharge rates of LSR/MSR fibers change at supra-threshold levels is not sufficient to conclude that these fibers support perception at these sound levels. Encoding sound level with average rates involves several requirements, listed here with the counter-evidence against each:
-
To code changes in level, changes in average rate must be larger than the variance of the rate. Because rate variability increases as the rate increases (Siebert 1965; Viemeister 1988; Delgutte 1996; Winter and Palmer 1991; Heinz et al. 2001a; Colburn et al. 2003), a simple code based on the rate of a single fiber, or a group of fibers with similar CFs, necessarily requires not only that the rate changes with sound level but that rate-level functions accelerate upwards as a function of level to compensate for increasing rate variability. Such rate-level curves are not observed for any type of AN fiber. Simple models for level coding based on average rates of AN fibers over a limited range of CFs show decreasing sensitivity (i.e., larger Weber fractions) as level increases and the discharge rate vs. level functions saturate.
Models that combine AN fibers with a wide range of thresholds and dynamic ranges, or models that combine fibers with a wide range of CFs, have been proposed to explain psychophysical level discrimination, which is roughly constant for wideband sounds over a wide range of levels (Viemeister 1988; Delgutte 1987; Winter and Palmer 1991; review: Delgutte 1996). These models are forced to make problematic assumptions. For example, the wide dynamic range LSRs are heavily weighted in these models, even for CFs below 1500 Hz where LSR AN fibers do not have wide dynamic ranges (Winter and Palmer 1991). Figure 1c shows “typical rate-level functions” for fibers with CF ~ 1 kHz (from Liberman 1978, cat), illustrating a limited dynamic range of a low-CF LSR fiber (arrow). The limited dynamic range for low-CF LSR AN fibers is consistent with the importance of cochlear compression in creating the wide dynamic range of AN fibers (Yates et al. 1992) (Fig. 1d) and with physiological evidence based on AN responses suggesting that cochlear gain is relatively low for low CFs (Sewell 1984, cat; Cooper and Yates 1994, guinea pig).
Two limiting extremes of spectral coding are important when considering rate-based models for level coding. For the special case of pure tones in quiet, the improvement in psychophysical level discrimination at higher levels, referred to as the “near miss to Weber’s Law” (McGill and Goldberg 1968), can be explained by spread of excitation, because the entire population of fibers is available for this task (Florentine and Buus 1981; Delgutte 1987; Heinz et al. 2001a). When bands of noise are introduced in an effort to limit spread of excitation, level discrimination of tones is frequency-dependent and more complex, described as a “severe departure from Weber’s law” (Carlyon and Moore 1984; Florentine et al. 1987), but can still be explained by the rate and timing cues available on populations of AN fibers (Heinz et al. 2001b). In general, level discrimination of pure tones over a wide range of levels and frequencies can be explained quantitatively using AN models that describe the variability of spike counts and times, as well as realistic compression.
The opposite extreme, the task of coding the overall level of wideband sounds, has been addressed in some of the models mentioned above by devoting the rate profile across the entire population of AN fibers to the task and tailoring a weighted combination of fiber types to achieve the desired performance across a wide range of sound levels. However, for the important real-world task of coding spectral amplitudes that differ across frequencies within complex sounds, such as speech, it would not be useful to combine the responses of the entire population into a single decision variable.
Level discrimination of either pure tones or wideband noises differs, both perceptually and quantitatively, from the problem of spectral coding of complex sounds. Encoding complex sounds such as speech, for which changes in spectral magnitude across frequency are critical, requires rate profiles that are robust across a wide range of sound levels. The limitations of rate profiles across AN fibers for encoding vowels, due to both saturation and variance of the rates, has been extensively reported (e.g., Sachs and Young 1979; Sachs et al. 1983; Delgutte and Kiang 1984a, b; Delgutte 1987). An analysis strategy that normalized each fiber’s rate in response to vowels to eliminate inter-fiber variability showed that predicted vowel discrimination based on HSR fibers succeeds at low levels but fails at higher levels, where predictions based on L/MSR rate profiles are closer to behavioral performance (Sachs et al. 2006). A proposed solution to the limitations of AN dynamic ranges for vowel coding was a “selective listening” strategy, in which HSR responses dominate at low sound levels and L/MSR fibers dominate at higher levels (Winslow et al. 1987). Although the neural mechanisms for such a strategy would be complex, responses of one sub-type of brainstem neurons (onset choppers, see below) have rate profiles with relatively wide dynamic ranges, consistent with this model (Blackburn and Sachs 1990). However, as described in more detail below, this group of brainstem neurons does not provide an excitatory projection to higher auditory centers. In addition to these limitations in coding complex sounds in quiet across a wide range of levels, for all SR types, the AN rate profiles in response to vowel sounds are severely limited in the presence of background noise, even at signal-to-noise ratios for which speech is highly intelligible (e.g., + 9 dB SNR, Sachs et al. 1983; + 10 dB SNR, Delgutte and Kiang 1984b).
To code level, average rates must be consistent in different stimulus contexts. Dynamic range adaptation (DRA) is a context-dependent shifting of the range of levels over which a neuron’s average rate varies (Fig. 1e). For auditory neurons, DRA was first described in the midbrain (Dean et al. 2005) and was later demonstrated at the level of the AN (Wen et al. 2009). The dynamic range of an AN fiber shifts continuously, depending upon recent activity of that neuron; this DRA can be explained by a model for the IHC-AN synapse with power-law adaptation (Zilany and Carney 2010). Because the dynamic range is continually changing, there is no simple correspondence between a fiber’s average rate and the stimulus level. A code that maps average rates to specific sound levels would have to be very complex, with a detailed memory of past discharge rates, to compensate for DRA.
If level were coded by the change in rate with respect to spontaneous rate, then the spontaneous rate must be stable over time. Average-rate-based models for level coding not only assume a consistent dynamic range (see above) but that an AN fiber has a constant “assigned” spontaneous rate. However, spontaneous rates fluctuate continuously, randomly, and by a considerable amount (Teich et al. 1990; Teich and Lowen 1994; Lowen and Teich 1996; Jackson and Carney 2005) (Fig. 1f). Note also that the spontaneous rates of AN fibers change depending upon context (see rate at low sound pressure levels (SPLs) in Fig. 1e) due to the combined effects of DRA and classic firing-rate adaptation (Wen et al. 2009).
-
A rate-based code for sound level must be maintained along the ascending pathway. For the wide dynamic ranges of L/MSR fibers to explain perception of supra-threshold spectral amplitudes, this representation must be maintained along the ascending auditory pathway. However, in the cochlear nucleus (CN), just one synapse along the ascending pathway towards the major brainstem and midbrain targets essential for perception (MSO, LSO, IC; e.g., Jenkins and Masterton 1982; Cant and Oliver 2018), there is no evidence for a population of high-threshold, wide-dynamic-range neurons that project a rate-based code for complex sounds to the midbrain.
The principal cell types in the antero-ventral cochlear nucleus (AVCN), the primary-like and chopper response types, have a relatively small range of thresholds, clustered near behavioral thresholds and nearly all below 25 dB SPL (May and Sachs 1992). These cells also have a relatively tight distribution of dynamic ranges (30–35 dB for tones, 35–45 dB for noise) (May and Sachs 1992). The thresholds, dynamic ranges, and SRs of AVCN cells are influenced by numbers and types of converging fibers, as well as synaptic properties and inhibitory inputs to these cells (review: Manis et al. 2012). A few examples of pairs of AN inputs with similar morphologies, and thus presumed similar SRs, terminating on AVCN bushy cells have been reported (Ryugo and Sento 1991); there are regional differences in the numbers and patterns of AN SR types into the AVCN (Liberman 1991; Spirou et al. 1990; Tsuji and Liberman 1997; Spirou et al. 2005). However, the low thresholds and limited dynamic ranges of average discharge rates of AVCN principal cells suggest that, at this early point in the auditory pathway, average rates do not code sound level over the perceptually relevant range, suggesting that spectral amplitude must be coded in a different form by neurons at this stage.
Onset neurons in the posterior ventral cochlear nucleus (PVCN) have large average rate dynamic ranges and very broad tuning (Rhode and Greenberg 1992); these cells project to regions in the lateral lemniscus that provide inhibition to the IC (Rhode et al. 1983; Smith and Rhode 1989; Schofield and Cant 1997; Nayagam et al. 2005). Onset choppers in the PVCN have rate profiles in response to vowels that are relatively robust over a wide range of sound levels (Blackburn and Sachs 1990); however, these neurons provide inhibitory inputs to the ipsilateral VCN and dorsal cochlear nucleus (DCN) (Oertel et al. 1990; Arnott et al. 2004; Doucet and Ryugo 2006) as well as inhibitory projections to the contralateral CN (Babalian et al. 1999; Palmer et al. 2003; Smith et al. 2005; review: Cant and Benson 2003). Thus, the rate profiles of onset choppers are not conveyed as excitatory inputs to higher auditory centers. The other major nucleus in the CN, the DCN, is characterized by rate-level functions that differ between tone and noise stimuli and are often nonmonotonic (Young and Davis 2002). Neurons in the PVCN and DCN do not appear to carry a simple rate-based code for spectral amplitudes that is conveyed to the midbrain. However, these neurons potentially influence response profiles in the IC directly or indirectly and may influence sensitivity to fluctuations in the IC.
A notable and important exception to the generally limited dynamic ranges in the CN are neurons in the small cell cap, or shell region, which receive exclusive AN input from the L/MSR fibers (Leake and Snyder 1989; Liberman 1991; Ryugo 2008; reviewed in Cant 1993) and have wide dynamic ranges (Ghoshal and Kim 1996). These cells are not part of the ascending “perceptual” pathway but rather project to the medial and lateral olivocochlear (MOC and LOC) efferent neurons (Ye et al. 2000). The potentially important role of L/MSR fibers as an input to the efferent system will be revisited below.
-
The code should be robust in background noise, and in a context of time-varying level, including roving-level paradigms. Rate-based codes for spectral amplitude are motivated by the power spectrum model of hearing (review: Patterson and Moore 1986). However, this model fails to explain the results of key experiments, such as the ability to detect tones in noise in a roving-level paradigm (Kidd Jr et al. 1989). In a roving-level detection paradigm, the level of the tone-plus-noise stimulus is randomly varied across stimulus intervals within each trial, and the listener’s task is to determine which stimulus interval contains a tone. If the listener depended upon the energy near the target frequency, as assumed by the power spectrum model, detection thresholds would increase because the roving-level paradigm renders this cue unreliable. In contrast, listeners’ thresholds are minimally impacted, even by stimulus levels that are randomly varied over a wide range (e.g., 32 dB, Kidd Jr et al. 1989; 40 dB, Green 1988). Psychophysical performance in roving-level paradigms is also robust for detection of tones in notched noise, for profile analysis (Green 1988; Lentz et al. 1999), and for forward masking (Jesteadt et al. 2005), among other tasks.
Even if neural strategies existed to compensate for the problems outlined above, such that average rates or rate profiles across AN fibers did accurately reflect the sound level or spectral profile, an average rate-based (effectively a power spectrum-based) code could not explain masked detection in tasks with random level variations. Of course, hearing in noise and understanding stimuli with time-varying levels are highly relevant tasks in real-world hearing at supra-threshold levels. As described below, temporal responses of AN fibers to stimulus envelopes contain information that can solve the detection problem in roving-level contexts (Richards 1992; Mao et al. 2013). Temporal responses of AN fibers also encode features of complex sounds such as vowels over a wide range of levels and in background noise, even when limited to the rate-saturated AN HSR fibers (Carney et al. 2015).
L/MSR fibers have been hypothesized to be critical not only for coding tone level but also for coding fluctuations in supra-threshold fluctuating sounds (e.g., Bharadwaj et al. 2014; Liberman and Kuwada 2017), based on their higher synchronization coefficients to SAM tones at CF (Joris and Yin 1992) (Fig. 1b). The synchronization coefficient is a metric influenced by the shape of the period histogram, which becomes “squared off” for all AN fibers as level increases (see histograms in Joris and Yin 1992). The lower thresholds of HSR fibers result in spread of the period histograms over a larger portion of each period of the SAM stimulus; thus, sensitive HSR fibers have lower AM synchronization coefficients as compared to L/MSR fibers. However, Fig. 1b illustrates that changes in fluctuation amplitudes of both rate-saturated HSR fibers and unsaturated L/MSR fibers convey level-dependent information in response to time-varying stimuli over a wide range of supra-threshold levels. That is, fluctuation amplitudes in response to time-varying stimuli decrease with increasing SPL in response to tones at CF over a wide range of levels (Fig. 1b). However, the spread of excitation of SAM responses across frequency channels can be especially large in sensitive HSR fibers (Encina-Llamas et al. 2017); thus, the level dependence of the AM synchronization coefficient for responses to CF tones can be misleading.
PART II: WHAT IS SPECIAL ABOUT CONVERSATIONAL-SPEECH LEVELS?
Arguing that average rates of L/MSR AN fibers cannot explain perception of supra-threshold stimuli does not address the very real problems for communication at these sound levels in both hidden and sensorineural hearing loss. As mentioned above, a different approach is to ask why conversational speech level (e.g., ~ 55–65 dB SPL, Olsen 1998) is so effective for communication. That is, what response features emerge in this range of levels, and how do they differ from responses at lower or higher sound levels? Answers to this question provide new insight into both normal and impaired hearing. This section focuses on this question to outline key features of both peripheral and central responses that may be important for supra-threshold hearing.
IHC transduction results in interesting differences in responses to stimuli below and above conversational levels. The electrical responses of IHCs drive neurotransmitter release at all IHC-AN synapses. For low-level signals, or low-level spectral regions in complex sounds, the time waveform of the IHC response is affected relatively little by IHC saturation. The envelope of the IHC inputs is determined by the stimulus envelope of narrowband sounds or by the cochlea-induced envelope for wideband sounds (Joris 2003). As sound level increases, IHC responses begin to saturate (Fig. 4) (Russell and Sellick 1983; Dallos 1985, 1986; Russell et al. 1986; Cheatham and Dallos 2000; reviews: Fettiplace and Ricci 2006; Roberts and Rutherford 2008). IHC saturation gradually “flattens” the envelope of the response as sound levels increase. The “knee” in the input/output curves for both AC and DC components of the IHC response occurs in the range of conversational sound levels (Fig. 4). There are qualitative and quantitative differences in the amplitude of low-frequency fluctuations in response to sound levels below or above the knee (Figs. 2 and 3). Changes in the amplitudes of fluctuations are not only determined by the sound level in a given frequency channel but are further influenced in the healthy ear by cochlear amplification, which contributes to synchrony capture, as discussed below. Specifically, in a quiet acoustic setting, the degree of saturation of IHCs increases substantially at sound levels in the middle of the conversational speech range (Fig. 4).
Fig. 4.
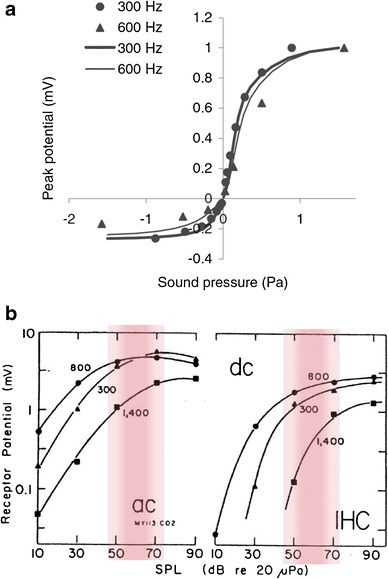
IHC response properties. a Normalized input/output nonlinearity, with 300-Hz data from Russell and Sellick (1983) and 600-Hz data from Russell et al. (1986). Lines are responses of an IHC model that includes the transduction nonlinearity and K+-channels (from Lopez-Poveda and Eustaquio-Martín 2006; reprinted with permission). b AC and DC response components of in vivo IHC responses to several tone frequencies. The red bands indicate the SPL range of conversational speech; this range of levels is near the bend in the response curves, above which the IHC responses become considerably saturated (modified from Dallos 1985)
At higher sound levels, the envelopes of IHC responses, and thus the peristimulus time (PST) histograms of AN fibers, are increasingly flattened by IHC saturation. Additionally, for some complex sounds, stimulus components near CF dominate the temporal responses as level increases, which results in an even “flatter” PST histogram. For example, in response to vowels at conversational levels, AN fibers tuned near spectral peaks have responses that are dominated by a single harmonic of the vowel’s fundamental frequency, F0 (Delgutte and Kiang 1984a), a phenomenon referred to as synchrony capture (Fig. 5b) (Deng and Geisler 1987; Deng et al. 1987; Miller et al. 1997; Sachs et al. 2002; Zilany and Bruce 2007). In contrast, fibers tuned away from spectral peaks have responses that fluctuate at the vowel’s F0 (Fig. 5c) (Delgutte and Kiang 1984a). Thus, the profile of fluctuation amplitudes across peripheral frequency channels codes the frequencies of the vowel formants (Carney et al. 2015).
Fig. 5.

Illustration of fluctuation profiles and a vowel coding hypothesis, for IC neurons with both bandpass and band-suppressed modulation transfer functions (MTFs). a Vowel spectrum. b Responses of model AN fibers tuned near formants have small pitch-related rate fluctuations. c Model fibers tuned between formants have strong rate fluctuations at F0 (see examples of actual AN recordings in Delgutte and Kiang 1984a). d Band-pass MTF from rabbit IC with a BMF near a typical male F0. e Band-reject MTF with a notch near a typical F0. f Band-pass midbrain neurons have reduced rates in frequency channels with weak fluctuations (green arrow) and increased rates in channels with strong fluctuations (see c, orange arrow); therefore, dips in the rate profile of bandpass neurons encode F1 and F2. g Rate profile for a population of band-reject neurons has peaks at F1 and F2; band-reject neurons respond more strongly to stimuli that yield reduced neural fluctuations (see b, green arrow). (from Carney et al. 2015; reprinted with permission)
Analysis of temporal responses of AN fibers tends to focus on phase-locking to the fine structure of pure tones at CF. However, AN fibers at all CFs phase-lock to all low-frequency fluctuations, including both fine structure and envelope fluctuations, in tones or in peripherally filtered complex sounds (review: Joris et al. 2004). The PST histograms of all types of AN fibers mirror the low-frequency fluctuations of IHC responses, and these fluctuations are affected by saturation of the IHCs. Overall, the trend in the fluctuations of AN responses with changes in spectral amplitude is simple: as spectral level increases, the time-varying responses of AN fibers tuned near spectral peaks tend to “flatten.” The differences in amplitudes of fluctuations between responses of AN fibers tuned to frequencies near spectral peaks and those tuned away from spectral peaks are referred to here as a fluctuation profile (Fig. 2). These differences in the AN responses across frequency channels set the stage for representations of spectral features in the central nervous system (CNS), where many neurons are sensitive to the amplitudes of low-frequency fluctuations.
Figure 6 illustrates the fluctuation profile associated with single spectral peak at the first formant frequency (F1) of the vowel /æ/. Panel 6A shows the responses of three model AN fibers with CFs that straddle the spectral peak; these are responses to a 65 dB SPL vowel in quiet, for a model of the normal ear. In comparison, the differences in fluctuation amplitudes across these three frequency channels are much reduced in responses of model AN fibers with impairment introduced to both IHC and outer hair cell (OHC) sensitivity (Fig. 6b). The addition of long-term averaged speech-spectrum shaped (LTASS) noise reduces the changes in fluctuation amplitudes across channels for both the healthy (Fig. 6c) and impaired (Fig. 6d) models.
Fig. 6.
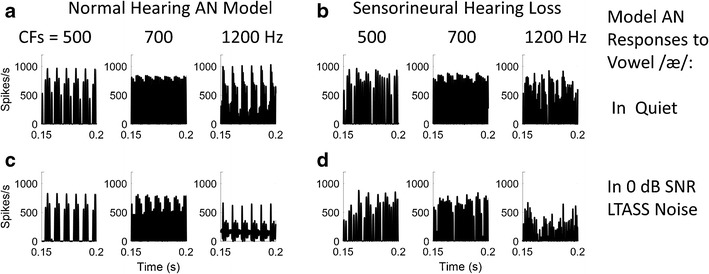
Fluctuation profiles associated with F1 in the vowel /æ/, illustrated with AN model responses for CFs below (500 Hz), near (700 Hz), and above (1200 Hz) the first formant frequency. HSR fibers; 65 dB SPL. a Responses of model with normal hearing, for vowel in quiet. b Responses of AN model with moderate sensorineural hearing loss (SNHL; COHC and CIHC = 0.2 in Zilany et al. 2014, AN model). c Normal hearing and d SNHL model responses to vowel with additive 0 dB signal-to-noise ratio (SNR) LTASS noise. Both addition of noise and SNHL reduce the changes in fluctuation amplitudes across these frequency channels that span F1. Vowel waveform is from the Hillenbrand et al. (1995) database
Given its role in establishing fluctuation profiles, the saturation of IHCs is important to examine more closely. The asymmetrical saturation of IHC responses (Russell and Sellick 1983; Russell et al. 1986) (Fig. 4a) has long been recognized as essential for the DC component of IHC responses to high-frequency tones, but IHC saturation also shapes responses to complex sounds. Estimates of the IHC input/output nonlinearity are limited by experimental difficulty, and the penetration of the hair cells by electrodes used for in vivo studies affects their characterization (Zeddies and Siegel 2004). A modeling study based on both in vivo and in vitro recordings suggests that the saturating input/output function of IHCs is affected by both a nonlinear transduction current and by nonlinear, voltage-dependent potassium currents (Lopez-Poveda and Eustaquio-Martín 2006) (Fig. 4a). These nonlinearities affect both the AC and DC components of the IHC response, which show increasingly strong saturation for levels beginning at about 50–60 dB SPL (Dallos 1985; Cheatham and Dallos 2000) (Fig. 4b).
The increasing saturation and “flattening” of IHC responses at moderate sound levels are reflected in the synchrony of AN fibers to CF tones. At low frequencies, synchrony is maximum at about 20-dB above rate threshold and then declines at higher levels (Johnson 1980). IHC saturation also underlies the level dependence of synchrony to the envelope of SAM tones, which declines over a wide range of levels over which average rate (for HSR fibers) stays approximately constant (Fig. 1b) (Joris and Yin 1992). The amplitudes of AM fluctuations in AN responses are also influenced by the power-law properties of the IHC-AN synapse, which explain modulation gain in AN responses (Zilany et al. 2009).
Whereas IHC saturation “flattens” the fluctuations in responses of AN fibers tuned near spectral peaks, the IHC-AN synapse has a very different effect on fluctuation profiles. Synaptic adaptation results in saturation of average discharge rate, but it preserves and even enhances temporal fluctuations. For example, the power-law properties of the IHC-AN synapse explain the wide dynamic range of AN responses to onsets or increments in tone stimuli in comparison to the limited dynamic range of sustained responses (Smith and Zwislocki 1975; Smith and Brachman 1982; Smith et al. 1985; Zilany et al. 2009). Saturation of average discharge rates occurs at different SPLs for different types of AN fibers (Fig. 1d). Saturation of the average rates of HSR fibers at low SPLs results in nearly constant average rates across the levels used for conversational speech (e.g., the model AN responses illustrated in Figs. 2 and 3 have similar rates, despite very different input levels near CF.) The fact that fluctuation profiles are carried by fibers with the same average rates results in a simpler code; the representations of fluctuation amplitudes and contrasts are not confounded by changes in average rate. AN adaptation and rate saturation are both included in the AN model used for the illustrations here (Zilany et al. 2014) and are important for accurately simulating the amplitudes of fluctuations in AN responses (Zilany et al. 2009).
Fluctuation-related cues have been identified as important for numerous psychophysical tasks (e.g., Forrest and Green 1987; Kidd Jr et al. 1989; Richards 1992; Kohlrausch et al. 1992, 1997; van der Heijden and Kohlrausch 1995; Dau et al. 1997a, b; Lyzenga and Horst 1997; Sinex et al. 2002, 2003; Sinex 2008; Henry et al. 2017). For example, for the classic task of detection of tones in noise, addition of a tone reduces the slopes of envelope fluctuations of a narrowband masker, providing a cue for detection (Richards 1992; Mao et al. 2013). For detection of tones in wideband maskers, the amplitude of low-frequency fluctuations in the responses of the peripheral channels tuned to the tone frequency are reduced by addition of the tone (Mao et al. 2013). These cues were described based on the stimulus waveforms, but saturation of IHCs tuned to the tone frequency further attenuate fluctuations in the tone frequency channel and thus increase the fluctuation differences across channels associated with these cues (Fig. 7). This envelope-related cue explains patterns of detection across an ensemble of reproducible narrowband and wideband noise waveforms (Mao et al. 2013; Mao and Carney 2015). Ongoing work is testing the ability of fluctuation cues to describe detection thresholds across a wide range of tone frequencies and masker bandwidths, based only on HSR AN model responses (Carney and Richards 2016) and IC responses to stimuli used in psychophysical detection tasks (Fan and Carney 2017). The work described above focused on cross-frequency profiles in amplitude fluctuations; other sources of fluctuation, such as rapid periodic frequency transitions, are also affected by cochlear nonlinearities and IHC transduction (Carney et al. 2017).
Fig. 7.
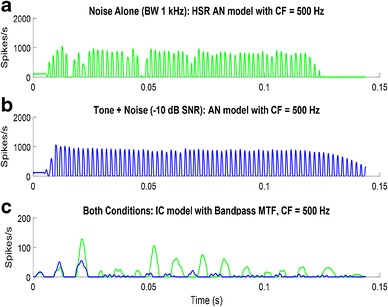
Responses of AN Model for a 500-Hz CF HSR fiber to a noise-alone stimulus (1 kHz bandwidth low-pass Gaussian noise) at 70 dB SPL and b tone-plus-noise, the same noise as in a, with a 500-Hz, 60 dB SPL tone added. c Responses of a simple model IC cell (bandpass filter with BMF = 100 Hz) to both stimuli. Green: response to the noise-alone. Blue: response to tone-plus-noise. The addition of the tone flattens the envelope and decreases the response of a model IC cell that is driven by amplitude fluctuations
The amplitudes of low-frequency fluctuations in AN fibers are conveyed to the principal neurons in all areas of the CN. In the AVCN, envelope-related fluctuations are enhanced by inhibitory-excitatory interactions for both primary-like and chopper response types (Gai and Carney 2006, 2008). Neurons in the DCN also receive convergent excitatory and inhibitory inputs from several sources, and many DCN neurons phase-lock more strongly than AN fibers to AM stimuli (Rhode and Greenberg 1992, 1994). Principal cell types from all regions in the CN convey low-frequency fluctuations to the major nuclei in the ascending auditory pathways, including the superior olive and IC (Harrison and Howe 1974; Cant 2005; Cant and Oliver 2018). In the midbrain, the average rates of IC cells are almost always sensitive to the frequency and amplitudes of low-frequency fluctuations, as characterized by modulation transfer functions (MTFs). IC discharge rates vary, sometimes many-fold, as a function of modulation frequency (Langner and Schreiner 1988; Krishna and Semple 2000; Nelson and Carney 2007; review: Joris et al. 2004). Thus, the fluctuation profiles that are set up in the AN by IHC saturation are represented in the average rate response profile of the IC population (Figs. 3 and 5f, g).
Many IC neurons have responses that are enhanced by fluctuations near a best modulation frequency, others are strongly suppressed, and a smaller number display both enhancement and suppression (Nelson and Carney 2007; Krishna and Semple 2000; Kim et al. 2015). Enhancement and suppression of responses to low-frequency fluctuations may represent two “channels” in the auditory midbrain (Fig. 5f, g), similar to the ON and OFF channels in the early visual system (recall that the midbrain resides at a position in the ascending pathway comparable to the retinal output.) The benefits of having two opponent channels for coding complex stimuli have been explored in theoretical and computational studies of visual processing (e.g., Victor and Nirenberg 2013).
The fluctuation profiles across peripheral channels and the resulting midbrain rate profiles in response to vowels are perhaps counter-intuitive: responses of peripheral frequency channels tuned to spectral peaks have smaller amplitude fluctuations, because IHC saturation increasingly “flattens” the envelopes of higher-amplitude signals (Figs. 2 and 3). Therefore, central nervous system (CNS) neurons that are excited by fluctuations have reduced responses when the CF is near a spectral peak (Fig. 5f). However, CNS neurons with band-suppressed responses to fluctuations (i.e., cells with low-pass or band-reject MTFs) respond best to inputs with “flattened” envelopes (Fig. 5g) (perhaps due to dis-inhibition, Carney et al. 2015). The rate responses of band-suppressed neurons to spectral peaks agree with our intuition of how the spectrum “should” map onto a rate-based neural representation (Fig. 5g), although the responses of these neurons are governed by fluctuations rather than by energy. The representation of the peripheral fluctuation profile in the rates of midbrain neurons is robust not only across a wide range of sound levels, including randomly varying levels, but also in the presence of background noise (Carney et al. 2015).
Fluctuation profiles are especially interesting in response to complex sounds such as running speech (Fig. 8). Fluctuation profiles can be identified in model IC responses for cells with BFs straddling formant frequencies during vowels (Fig. 8, bottom panel, white circles). These profiles provide information that would allow identification of formant frequencies and the associated vowels. Fluctuations are also strong in the responses of neurons tuned to frequency ranges with spectral slopes, for example during fricative sounds (Fig. 8, red circles).
Fig. 8.
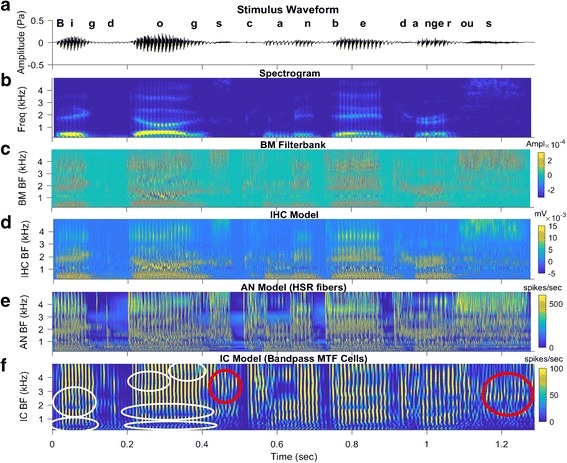
Several stages of AN and IC model outputs in response to a sentence from the Hearing In Noise Test (HINT, Nilsson et al. 1994), “Big dogs can be dangerous.” Overall sound level = 65 dB SPL. a Stimulus time waveform. b Spectrogram. c–e Responses of stages in the Zilany et al. (2014) AN model, for a population of 50 HSR fibers with CFs from 150 to 5000 Hz. c Basilar membrane filter bank response. d IHC voltage. e AN synapse output (related to probability of firing). f Simple IC model based on a modulation filter (Mao et al. 2013), for IC cells with bandpass modulation transfer functions tuned to 100 Hz with Q = 1 (i.e., bandwidth = 100 Hz). Bright vertical striations are IC responses that are phase-locked to F0 periods during voiced portions of the sentence. Horizontal blue streaks indicate dips in the cross-frequency fluctuation profiles that are associated with formants during voiced sounds (several are indicated by white circles). Vertical blue streaks are pauses between words. Note that the model IC responses during fricatives (red circles) are in response to strong AN fluctuations at frequencies where the spectrum is sloping, not at spectral peaks (cf. response to final /s/ in panels b–d with panel f). (Figure created using UR_Ear_v2.1 tool)
Fluctuation profiles in response to vowels are strongest for speech at conversational levels (Fig. 9) (Carney et al. 2015). For speech sounds in this range of levels, the spectral peaks are significantly more saturated by the IHCs than are spectral valleys. At very low sound levels, below IHC saturation, there are differences across frequency channels in the average rates of AN responses, but these differences depend upon stimulus energy and would thus be more vulnerable to noise and level fluctuation. At high sound levels, IHC saturation affects the responses of all frequency channels, reducing the differences in fluctuation amplitudes across frequency channels. The change in amplitude differences in the fluctuation profile across the range of sound levels is reflected in changes in speech intelligibility. Percent correct scores on vowel and word tests, in quiet or in noise, increase from speech reception threshold to maximum values at about 4–5 %/dB over an approximately 20-dB range (Hirsh et al. 1952; Pickett 1956; Beattie et al. 1977). Intelligibility stays constant over the approximately 20 dB range of conversational levels, and then “rolls over,” with intelligibility decreasing at higher sound levels (Pickett 1956; Beattie and Raffin 1985; Studebaker et al. 1999). Conversational levels, where the highest speech intelligibility scores occur, are thus near the “sweet spot” for the most salient fluctuation profiles across the AN population response.
Fig. 9.
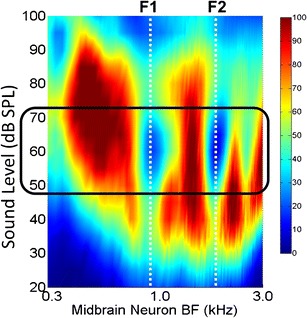
The differences in fluctuation amplitude across frequency channels are greatest at conversational speech levels (box.) This image shows amplitudes of low-frequency fluctuations across the population (BF) over a wide range of sound levels (dB SPL). The responses are for simple model IC cells that have band-enhanced modulation tuning, with best modulation frequency of 100 Hz (color bar, average rate in spikes/s). The inputs to the model IC cells were provided by the Zilany et al. (2014) AN model for HSR AN fibers. The stimulus waveform was the vowel /æ/ in “had” from the Hillenbrand et al. (1995) database. (from Carney et al. 2015; reprinted with permission)
Two interesting modifications of speech are consistent with the hypothesized importance of fluctuation profiles for high intelligibility. Sine wave speech is created by replacing broadband speech energy by two or three time-varying sine waves with frequencies matched to spectral peaks. These stimuli, which would elicit reduced fluctuation profiles in AN responses, are not immediately perceived as being speech-like or intelligible, although with instruction and training, they can become intelligible to some listeners (Remez et al. 1981). At the other extreme, whispered speech has a broad spectrum with relatively low voiced energy. Whispered speech would elicit AN fluctuation profiles due to changes in level across frequency and to cochlea-induced envelopes, but the cross-frequency differences in the fluctuation profiles would be reduced by the lack of synchrony capture, which is driven by harmonics of F0. Intelligibility of whispered speech is reduced with respect to voiced speech, especially in noise (Freyman et al. 2012; Ruggles et al. 2014).
In addition to a strong rate profile that encodes changes in fluctuation amplitudes across frequency channels, many IC neurons have exceptional phase-locking to the fluctuation frequency (Joris et al. 2004). Midbrain rate profiles may be adequate to encode spectral peaks for mid-level sounds in quiet. However, in background noise, the phase-locked responses may improve coding of complex sounds. For example, the phase-locking thresholds of budgerigar midbrain neurons to fluctuations provide the best neural correlate for their human-like behavioral thresholds for formant frequency discrimination in background noise (Henry et al. 2017).
If cross-frequency fluctuation profiles convey important information about speech and other complex sounds, then it is interesting to consider whether the auditory system has profile-driven mechanisms to maintain, accentuate, or perhaps “sharpen” such profiles. Because these profiles involve the level-dependence of IHC transduction, enhancing them would require control of gain in the cochlea. The auditory efferent system provides just such a control system.
PART III: HOW DOES COCHLEAR GAIN AFFECT FLUCTUATION CONTRAST? IS THE AUDITORY EFFERENT SYSTEM DRIVEN BY FLUCTUATION PROFILES?
The auditory efferent system has typically been considered to be an SPL-driven gain control system that modulates cochlear amplification via MOC projections to outer hair cells and manipulates afferent sensitivity via the LOCs. However, if fluctuation profiles “matter,” then it is reasonable to ask whether there exists a feedback system in the auditory system that is (i) driven by fluctuation profiles and (ii) acts to enhance the profiles. If so, then a functional goal of the efferent system would be to adjust cochlear gain to pull the overall operating point of the system towards the “sweet spot,” to increase differences in fluctuation amplitudes across the profile. This hypothesis differs from the usual functions ascribed to the efferent system: protection from loud sounds (e.g., Fuente 2015; but see Smith and Keil 2015) or shifting of the dynamic ranges of AN rates (e.g., Winslow and Sachs 1988).
The auditory efferent system has only been shown to modulate cochlear gain by approximately 20 dB using electrical stimulation (e.g., Winslow and Sachs 1988). Therefore, this system cannot provide precise gain control for rate-based coding across a significant portion of the auditory dynamic range. However, by always pulling the operating point of IHC transduction towards the sweet spot, the efferent system could enhance fluctuation profiles over a relatively wide range of levels.
The proposed function for the auditory efferent system is consistent with evidence that it may improve detection in noise (e.g., May and McQuone 1995; May et al. 2004; Hienz et al. 1998), for which fluctuation contrast would be essential. To enhance fluctuation profiles, the MOC system would function as follows: in the presence of high-level stimuli or background noise, where differences in fluctuation amplitudes across frequency channels would be reduced by increased IHC saturation, the MOC signals act to reduce cochlear gain. Reducing the gain would reduce the amount of IHC saturation in frequency channels with relatively low spectral amplitudes, acting to increase the fluctuation amplitude differences across channels. In the presence of very low-level sounds, maximal cochlear gain is the best strategy for increasing fluctuation differences.
If the efferent system acts to maintain or enhance fluctuation profiles, especially in the presence of background noise and changes in overall level, then deficits to this system could explain reported problems in supra-threshold speech intelligibility in background noise. Reduction of the differences in fluctuation amplitude across frequency channels would decrease the information encoded in fluctuation profiles. This deficit would apply to listeners with reduced numbers of AN fibers due to synaptopathy, whether due to age or noise exposure. Identification of a deficit related to cochlear gain control would require a paradigm that explicitly stresses this control system, perhaps explaining the difficulty of identifying synaptopathy using standard psychophysical tasks.
Broadly speaking, the hypothesized efferent mechanism requires the known ascending and descending anatomical connections (Fig. 10). The L/MSR AN fibers carry level information that is sufficient for gross adjustment of cochlear gain based on overall sound level. These fibers provide a major input to the MOC system, via the small cell cap of the AVCN (Ye et al. 2000). Neurons in the small cell cap in the cat AVCN have very wide dynamic ranges (Ghoshal and Kim 1996), consistent with the fact that their AN inputs arise exclusively from L/MSR AN fibers (Leake and Snyder 1989; Liberman 1991; Ryugo 2008).
Fig. 10.
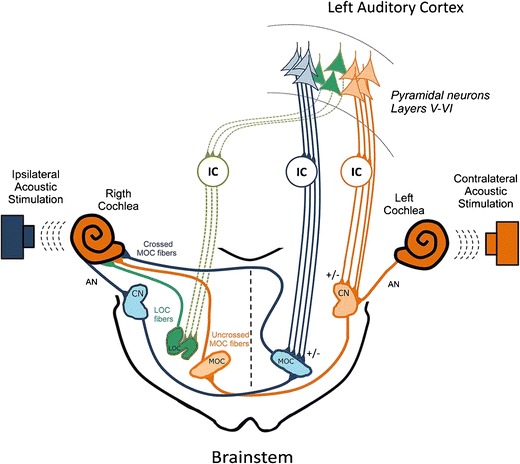
Schematic of auditory efferent pathways, illustrating descending connections from the IC and auditory cortex onto the regions of the brainstem where MOC and LOC cell bodies are clustered (from Terreros and Delano 2015; reprinted with permission). Uncrossed projections descending from the auditory cortex are indicated by solid lines and crossed projections by dotted lines. Descending projections from the IC terminate in both MOC and LOC regions, as well as in the cochlear nucleus (CN). MOC and LOC neurons project into the cochlea; MOC fibers terminate on the OHCs of both cochleae and influence the cochlear amplifier. LOC fibers project to the ipsilateral cochlea where they terminate directly on AN fibers, near the IHC-AN synapse
For the efferent system to act as a profile-driven feedback system requires not only information about the overall stimulus sound level but also signals representing the fluctuation profile itself. Indeed, the IC, with discharge rates that are sensitive to low-frequency fluctuations, provides a major input to the MOC region of the brainstem (Thompson and Thompson 1993; Schofield and Cant 1999; Terreros and Delano 2015; Cant and Oliver 2018, reviews: Warr 1992; Schofield 2011). MOC neurons have bandpass modulation transfer functions (Gummer et al. 1988), suggesting that they are excited by descending inputs from IC neurons with bandpass MTFs. These inputs carry signals appropriate to enhance fluctuation profiles, as described above: frequency channels with strong fluctuations would excite MOC neurons and decrease cochlear amplification, and channels driven by weak fluctuations would result in greater cochlear amplification. These two actions would tend to increase the differences across channels in fluctuation amplitudes, enhancing fluctuation profiles. Thus, although much detail about the specifics of projection neurons and brainstem targets remains unknown, the general circuitry is in place for the MOC component of the efferent system to act as a fluctuation profile-driven system.
The effects of the efferent system on fluctuation profiles during running speech are constrained by the dynamics of this system. Efferent effects on AN responses, estimated from contralateral suppression, have onset and offset latencies ranging from 20 to 400 ms (Warren and Liberman 1989). Durations of phonemes vary considerably, e.g., durations of consonants vary from 80 to 130 ms (Umeda 1977) and vowel durations from approximately 100–250 ms, depending on context and dialect (Jacewicz et al. 2007). Thus, the efferent system could affect fluctuation profiles within the timecourse of the phoneme, especially for longer phonemes, and changes in cochlear gain in response to any phoneme would be expected to affect fluctuation profiles in response to the subsequent phoneme.
Most tests of the auditory efferent system have used electrical stimulation, tones, or noise (review: Guinan 2011), and these stimuli would elicit relatively impoverished fluctuation profiles. Several psychophysical studies have used precursor stimuli to explore the relatively long-latency effect of the efferent system on detection or discrimination tasks (e.g., Zwicker 1965; Carlyon 1987, 1989; Strickland and Krishnan 2005; Jennings et al. 2009). A few of these studies have used notched noise precursors in studies of masked detection (Carlyon 1987; Strickland 2008) or amplitude modulation (AM) detection (Almishaal and Jennings 2016). In the latter, the effect of the precursor on AM detection thresholds was relatively strong (3–5 dB change in AM detection thresholds). Another strategy for testing the efferent system takes advantage of the ability of contralateral stimuli to suppress otoacoustic emissions via the efferent system. Suppression studies using AM noise (Maison et al. 1999) or harmonic stimuli (Micheyl et al. 1999) suggest that stimuli with fluctuation profiles are effective suppressors. These effects are strongest for stimuli with periodicities near 100 Hz, matching typical best modulation frequencies of MOC fibers (Gummer et al. 1988). Testing the hypothesis that the efferent system is driven by and/or acts to enhance fluctuation profiles will require further study with stimuli designed for this purpose.
The influence of attention on the action of the efferent system has been suggested in several studies (e.g., Delano et al. 2007; reviews: Guinan Jr 1996; Guinan 2011). As in vision, the ability to consciously “focus” on auditory objects is intuitively understood, but the neural mechanisms that underlie attention are not known. Fluctuation profiles provide a new framework for approaching this topic. The anatomical pathways are in place: in addition to direct projections from cortex to brainstem, the cortex also projects to the IC and thus could potentially gate or modulate the response profiles in the midbrain that in turn descend to the brainstem-level efferent system (e.g., Schofield and Cant 1999; Huffman and Henson 1990; Schofield 2011; Mellott et al. 2014; Dragicevic et al. 2015; Cant and Oliver 2018).
The ability to “focus” on fluctuation profiles that are centered at different modulation frequencies, such as those associated with the F0s of different speakers, is a natural extension of a general representation of complex sounds in terms of fluctuation profiles. That is, the presence of different modulation frequency channels, consistent with both psychophysical (e.g., Dau et al. 1997a, b) and physiological (review: Joris et al. 2004) descriptions, provides the substrate for segregating the fluctuation profiles associated with different voices (Carney 2018). Further work is required to test hypotheses related to the interactions of fluctuation profiles in attention and speech segregation. Such studies are especially challenging as they require systematic manipulation of attention.
EFFECTS OF HEARING LOSS ON FLUCTUATION PROFILES AND PROFILE-DRIVEN CONTROL MECHANISMS
As described above, deficits in the L/MSR pathway that impair efferent control may result in reduced effectiveness of a fluctuation profile-driven system and thus produce difficulty understanding speech in real-world situations that include background noise and time-varying levels. Indeed, commonly occurring hearing deficits would be expected to influence fluctuation profiles in different ways (Fig. 11). Reduced cochlear sensitivity would reduce the differences in fluctuation amplitudes across channels in the peripheral representation of sounds (Carney et al. 2016). Loss of L/MSR fibers would impact profile-driven control systems. Finally, central mechanisms at the midbrain level that convert fluctuation profiles into rate and envelope-locked representations likely involve interactions between excitation and inhibition (Nelson and Carney 2004; Gai and Carney 2006, 2008; review: Davis et al. 2010), and the balance of inhibition and excitation in central pathways is affected by aging (review: Caspary et al. 2008). Further deficits due to loss of both L/MSR and HSR fibers resulting from aging and/or synaptopathy may be expected due to a general loss of AN fibers and the resultant undersampling of the peripheral representation, described by the stochastic sampling model (Lopez-Poveda 2014).
Fig. 11.
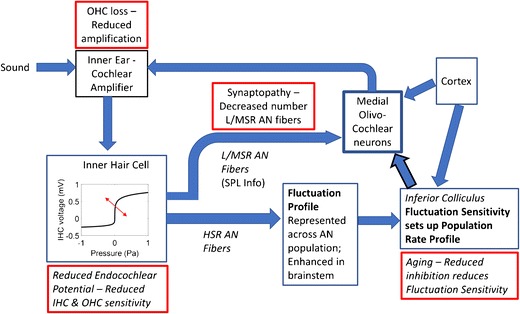
Schematic illustration of hypothesized fluctuation-profile-driven gain control system. Effects of various impairments are indicated in red boxes. Bold arrow highlights path of fluctuation-profile feedback signal from IC to MOC. All projections would be tonotopically organized (not shown). Details of crossed and uncrossed MOC projections are not shown (see Fig. 10)
While challenges in supra-threshold hearing for listeners with normal thresholds have received recent attention, it has long been known that listeners with measurably elevated thresholds, as in sensorineural hearing loss (SNHL), have difficulty with supra-threshold sounds, especially speech in background noise. Fluctuation profiles are vulnerable to several aspects of SNHL (Fig. 11). For example, SNHL would reduce differences in fluctuation amplitudes across channels in peripheral responses: for a stimulus at a given level, decreased cochlear gain due to OHC impairment would decrease the degree of IHC saturation near spectral peaks and thus reduce the differences across channels tuned near spectral peaks. Reduced endocochlear potential (EP) would result in decreased sensitivity of both OHCs and IHCs, further reducing cochlear gain and shifting the operating point of the IHC saturating nonlinearity to higher sound levels, again reducing the differences in fluctuation amplitudes across frequency channels (Fig. 6).
The result of shifting the IHC nonlinearity operating point to higher levels (and thus reducing the effect of IHC saturation) is an increase in the fluctuation amplitudes in responses of AN fibers tuned near spectral peaks. As a result, the differences in fluctuation amplitudes between channels tuned near spectral peaks and those tuned to spectral valleys are reduced. The overall increase in fluctuation amplitudes in the response of the impaired ear (e.g., Fig. 6c) is consistent with a recent report by Millman et al. (2017) of enhanced envelope coding in cortical EEGs of SNHL listeners that was correlated with poorer performance recognizing speech in noise. Previous psychophysical and physiological studies have also concluded that enhanced envelope coding associated with SNHL does not benefit speech intelligibility (Moore and Glasberg 1993; Kale and Heinz 2010; Zhong et al. 2014; Henry et al. 2014).
Any factors that reduce the differences in fluctuation amplitudes across peripheral channels, such as background noise or SNHL (Fig. 6), would handicap a system that is driven by these profiles. Without an effective profile to “work on,” a profile-driven system could not control the system at the best operating point to maintain or enhance the profile. Visual-contrast-driven mechanisms are ineffective without some image on the retina; similarly, the auditory system may suffer from the lack of sufficient differences in fluctuation amplitudes across peripheral channels to drive a profile-based control system.
Descending signals from the midbrain, potentially gated or modulated by the auditory cortex, provide a substrate for fluctuation profile-driven feedback via the efferent system. A profile-driven feedback system also requires information about overall sound level because differences in amplitudes of fluctuation are reduced for both very low and high sound levels (Fig. 9); such information is provided to the efferent system by the L/MSR AN fibers.
PART IV: FLUCTUATION PROFILES, HEARING AIDS, AND COCHLEAR IMPLANTS—CAN SOUND BE “CORRECTED” TO RESTORE FLUCTUATION PROFILES?
Fluctuation profiles across frequency channels convey important features of complex sounds, and in the normal ear, these profiles are strongest at conversational speech levels (Carney et al. 2015). As described above, SNHL would affect the fluctuation profiles in the peripheral response and thus distort the fundamental input to a profile-driven system. Aging or synaptopathy potentially affect the feedback system that controls fluctuation profiles. Could signal-processing approaches address these deficits?
Sensorineural hearing loss is associated with reduced sensitivity of the basilar membrane and/or reduced endocochlear potential. Both of these factors would reduce the effective sensitivity of the IHCs, shifting the operating point further down the IHC nonlinearity. In this condition, conversational speech levels will no longer push the IHCs tuned near spectral peaks as far into the saturated range, resulting in a general reduction in the fluctuation differences across frequencies (Fig. 6c, d). For small losses, amplification should restore these differences to some extent. However, for some sounds, such as voiced speech, contrasts are accentuated in the normal ear by synchrony capture, which results from the interaction of local changes in cochlear amplification and the sensitivity of the IHCs (Miller et al. 1997; Zilany and Bruce 2007). External amplification cannot recreate fluctuation profiles that depend on these nonlinearities, possibly explaining the lack of clarity described by many listeners with hearing loss, even when using high-quality hearing aids. However, fluctuation profiles can potentially be restored by manipulating the shape of the spectrum to increase the differences in fluctuation amplitudes across channels. For example, a model-based signal-processing strategy that identifies formant frequencies in vowel sounds and amplifies a single harmonic near each spectral peak could enhance fluctuation profiles in ears with or without SNHL in noise (Rao and Carney 2014). Initial test results of this strategy in a group of listeners with a range of SNHL or normal hearing demonstrated increased intelligibility of vowels in noise for nearly all listeners (unpublished, Carney and Schwarz 2014). Further work is required to generalize the strategy to running speech. It should be noted that the proposed strategy is very different, and almost antithetical, to the wide-dynamic-range compression typically implemented in hearing aids.
The fluctuation profile hypothesis is particularly interesting to consider in the context of cochlear implant (CI) stimulation strategies. Briefly, these systems typically pass sound through a filter bank and stimulate electrodes based on the envelope at the output of each filter (Wilson and Dorman 2008). The largest envelope fluctuations are associated with frequency channels near the peaks in the spectrum. This pattern is the “opposite” of the pattern of fluctuations observed in the normal ear at conversational speech levels: in the healthy AN, fluctuations are attenuated at spectral peaks and are largest at the spectral minima (Figs. 2, 3, 5, and 8). The envelope energy-based strategy currently used in CIs is prone to interference by noise energy, a well-known problem for CI listeners. The large range of performance in CI listeners (Wilson and Dorman 2008) suggests that there is room for improvement in CI strategies, with the fluctuation profile framework providing an alternative strategy. Such a strategy suggests processing the envelope of signals through an IHC-like saturating nonlinearity before stimulation. Envelope fluctuations used to drive the amplitudes of electrical stimulus pulses would be based on the neural fluctuations expected in each frequency channel in the healthy periphery, rather than on the envelope of each frequency channel of the stimulus. Specifically, frequency channels near spectral peaks elicit weak (“flattened”) neural fluctuations, and channels near spectral valleys elicit strong fluctuations. In response to voiced sounds, these fluctuations are at F0, whereas for wideband unvoiced sounds such as fricatives, the frequency range of low-frequency neural fluctuations is determined by the bandwidth of cochlear filtering. Tests of CI stimulation strategies based on auditory nerve model responses that included some aspects of fluctuation profiles have shown promising early results (Swaminathan et al. 2014).
SUMMARY
This review describes the representation of supra-threshold complex sounds in terms of fluctuation profiles, defined as cross-channel differences in the amplitudes of low-frequency fluctuations. In the response of the periphery, fluctuation profiles depend upon the interaction of cochlear gain and the saturation of sensitive IHCs. This IHC saturation shapes the fluctuations that drive AN responses. Adaptation of the IHC-AN synapse preserves the fluctuations in AN responses while, for HSR fibers, holding the average discharge rates nearly constant across a wide range of sound levels. Centrally, modulation enhancement in the brainstem and modulation tuning in the midbrain convert fluctuation profiles into a rate-based neural representation at the midbrain level. This representation provides an input that is appropriate for contrast-based mechanisms at higher levels of the auditory pathway. Strong phase-locking of central neurons to the low-frequency fluctuations provides another aspect of the fluctuation profile representation that may be especially important in noise (Henry et al. 2017a). New insights related to representations of complex sounds in rate and timing profiles across central neural populations suggest novel strategies for processing sounds to restore and enhance these profiles in background noise. These strategies are also applicable for assisting listeners with SNHL or to modify CI stimulation strategies.
Acknowledgements
The writing of this review was supported by NIH-DC-R01-001641, NIH-DC-R01-010813, by a sabbatical fellowship at Hanse Wissenschaftskolleg, Delmenhorst, Germany, and further inspired by conversations with colleagues in the Hearing Systems Group during a sabbatical visit to Technical University of Denmark. The manuscript was improved by helpful comments from Drs. David Cameron, Kenneth Henry, Joseph C. Holt, Brian Madden, Virginia Richards, Elizabeth Strickland, and the reviewers and by the editorial guidance of Dr. George Spirou.
References
- Almishaal A, Jennings SG. Effects of a precursor on amplitude modulation detection are consistent with efferent feedback. J Acoust Soc Am. 2016;139:2155–2155. [Google Scholar]
- Arnott RH, Wallace MN, Shackleton TM, Palmer AR. Onset neurones in the anteroventral cochlear nucleus project to the dorsal cochlear nucleus. J Assoc Res Otolaryngol. 2004;5:153–170. doi: 10.1007/s10162-003-4036-8. [DOI] [PMC free article] [PubMed] [Google Scholar]
- Babalian AL, Ryugo DK, Vischer MW, Rouiller EM. Inhibitory synaptic interactions between cochlear nuclei: evidence from an in vitro whole brain study. Neuroreport. 1999;10:1913–1917. doi: 10.1097/00001756-199906230-00022. [DOI] [PubMed] [Google Scholar]
- Beattie RC, Raffin MJ. Reliability of threshold, slope, and PB max for monosyllabic words. J Speech Hear Disord. 1985;50:166–178. doi: 10.1044/jshd.5002.166. [DOI] [PubMed] [Google Scholar]
- Beattie RC, Edgerton BJ, Svihovec DV. A comparison of the Auditec of St. Louis cassette recordings of NU-6 and CID W-22 on a normal-hearing population. J Speech Hear Disord. 1977;42:60–64. doi: 10.1044/jshd.4201.60. [DOI] [PubMed] [Google Scholar]
- Bharadwaj HM, Verhulst S, Shaheen L, Liberman MC, Shinn-Cunningham BG. Cochlear neuropathy and the coding of supra-threshold sound. Front Syst Neurosci. 2014;8:26. doi: 10.3389/fnsys.2014.00026. [DOI] [PMC free article] [PubMed] [Google Scholar]
- Blackburn CC, Sachs MB. The representations of the steady-state vowel sound /Ɛ/ in the discharge patterns of cat anteroventral cochlear nucleus neurons. J Neurophysiol. 1990;63:1191–1212. doi: 10.1152/jn.1990.63.5.1191. [DOI] [PubMed] [Google Scholar]
- Cant NB. The synaptic organization of the ventral cochlear nucleus of the cat: the peripheral cap of small cells. In: Merchán MA, Juiz JM, Godfrey DA, Mugnaini E, editors. The mammalian cochlear nuclei: organization and function. New York: Springer; 1993. pp. 91–105. [Google Scholar]
- Cant NB. Projections from the cochlear nuclear complex to the inferior colliculus. In: Winer JA, Schreiner CE, editors. The inferior colliculus. New York: Springer; 2005. pp. 115–131. [Google Scholar]
- Cant NB, Benson CG. Parallel auditory pathways: projection patterns of the different neuronal populations in the dorsal and ventral cochlear nuclei. Brain Res Bull. 2003;60:457–474. doi: 10.1016/s0361-9230(03)00050-9. [DOI] [PubMed] [Google Scholar]
- Cant NB, Oliver DL. Overview of the organization of the mammalian auditory pathways: projection pathways and intrinsic microcircuits. In: Oliver DL, Cant NB, Fay RR, Popper AN, editors. The mammalian auditory pathways: synaptic organization and microcircuits. Springer handbook of auditory research. New York: Springer; 2018. [Google Scholar]
- Carlyon RP. A release from masking by continuous, random, notched noise. J Acoust Soc Am. 1987;81:418–426. doi: 10.1121/1.395117. [DOI] [PubMed] [Google Scholar]
- Carlyon R. Changes in the masked thresholds of brief tones produced by prior bursts of noise. Hear Res. 1989;41:223–235. doi: 10.1016/0378-5955(89)90014-2. [DOI] [PubMed] [Google Scholar]
- Carlyon RP, Moore BC. Intensity discrimination: a severe departure from Weber’s law. J Acoust Soc Am. 1984;76:1369–1376. doi: 10.1121/1.391453. [DOI] [PubMed] [Google Scholar]
- Carney LH. Fluctuation contrast and speech-on-speech masking: model midbrain responses to simultaneous speech. In: Santurette S, Dau T, Dalsgaard JC, Tranebjærg L, Andersen T, Poulsen T, editors. Adaptive Processes in Hearing, Proceedings of the International Symposium on Auditory and Audiological Research (ISAAR) Ballerup: The Danavox Jubilee Foundation; 2018. pp. 75–82. [Google Scholar]
- Carney LH, Schwarz DM (2014) A Speech Enhancement Strategy based on Midbrain Response Properties, Abstract IHCON meeting.
- Carney LH, Richards VM. Predicting masked thresholds based on physiological models of auditory nerve and inferior colliculus population responses. J Acoust Soc Am. 2016;140:3272. [Google Scholar]
- Carney LH, Li T, McDonough JM (2015) Speech coding in the brain: representation of vowel formants by midbrain neurons tuned to sound fluctuations. eNeuro 2 [DOI] [PMC free article] [PubMed]
- Carney LH, Kim DO, Kuwada S (2016) Speech coding in the midbrain: effects of sensorineural hearing loss. In Physiology, psychoacoustics and cognition in normal and impaired hearing, Springer. Advances in experimental medicine and biology. 894:427–435 [DOI] [PMC free article] [PubMed]
- Carney LH, Oetjen H, Klump G. Discrimination of Schroeder-phase complex stimuli: physiological, behavioral, and modeling studies in the Mongolian gerbil. J Acoust Soc Am. 2017;141:3827. [Google Scholar]
- Caspary DM, Ling L, Turner JG, Hughes LF. Inhibitory neurotransmission, plasticity and aging in the mammalian central auditory system. J Exp Biol. 2008;211:1781–1791. doi: 10.1242/jeb.013581. [DOI] [PMC free article] [PubMed] [Google Scholar]
- Cheatham MA, Dallos P. The dynamic range of inner hair cell and organ of Corti responses. J Acoust Soc Am. 2000;107:1508–1520. doi: 10.1121/1.428437. [DOI] [PubMed] [Google Scholar]
- Colburn HS, Carney LH, Heinz MG. Quantifying the information in auditory-nerve responses for level discrimination. J Assoc Res Otolaryngol. 2003;4:294–311. doi: 10.1007/s10162-002-1090-6. [DOI] [PMC free article] [PubMed] [Google Scholar]
- Cooper NP, Yates GK. Nonlinear input-output functions derived from the responses of guinea-pig cochlear nerve fibres: variations with characteristic frequency. Hear Res. 1994;78:221–234. doi: 10.1016/0378-5955(94)90028-0. [DOI] [PubMed] [Google Scholar]
- Dallos P. Response characteristics of mammalian cochlear hair cells. J Neurosci. 1985;5:1591–1608. doi: 10.1523/JNEUROSCI.05-06-01591.1985. [DOI] [PMC free article] [PubMed] [Google Scholar]
- Dallos P. Neurobiology of cochlear inner and outer hair cells: intracellular recordings. Hear Res. 1986;22:185–198. doi: 10.1016/0378-5955(86)90095-x. [DOI] [PubMed] [Google Scholar]
- Dau T, Kollmeier B, Kohlrausch A. Modeling auditory processing of amplitude modulation. I. Detection and masking with narrow-band carriers. J Acoust Soc Am. 1997;102:2892–2905. doi: 10.1121/1.420344. [DOI] [PubMed] [Google Scholar]
- Dau T, Kollmeier B, Kohlrausch A. Modeling auditory processing of amplitude modulation. II. Spectral and temporal integration. J Acoust Soc Am. 1997;102:2906–2919. doi: 10.1121/1.420345. [DOI] [PubMed] [Google Scholar]
- Davis KA, Hancock KE, Delgutte B. Computational models of inferior colliculus neurons. In: Meddis R, Lopez-Poveda E, Fay RR, Popper AN, editors. Computational models of the auditory system. New York: Springer; 2010. pp. 129–176. [Google Scholar]
- Dean I, Harper NS, McAlpine D. Neural population coding of sound level adapts to stimulus statistics. Nat Neurosci. 2005;8:1684–1689. doi: 10.1038/nn1541. [DOI] [PubMed] [Google Scholar]
- Delano PH, Elgueda D, Hamame CM, Robles L. Selective attention to visual stimuli reduces cochlear sensitivity in chinchillas. J Neurosci. 2007;27:4146–4153. doi: 10.1523/JNEUROSCI.3702-06.2007. [DOI] [PMC free article] [PubMed] [Google Scholar]
- Delgutte B. Peripheral auditory processing of speech information: implications from a physiological study of intensity discrimination. In: Schouten ME, editor. The psychophysics of speech perception. Netherlands: Springer; 1987. pp. 333–353. [Google Scholar]
- Delgutte B. Physiological models for basic auditory percepts. In: Hawkins HL, McMullen TA, Fay RR, editors. Auditory computation. New York: Springer; 1996. pp. 157–220. [Google Scholar]
- Delgutte B, Kiang NY. Speech coding in the auditory nerve: I. Vowel-like sounds. J Acoust Soc Am. 1984;75:866–878. doi: 10.1121/1.390596. [DOI] [PubMed] [Google Scholar]
- Delgutte B, Kiang NY. Speech coding in the auditory nerve: V. Vowels in background noise. J Acoust Soc Am. 1984;75:908–918. doi: 10.1121/1.390537. [DOI] [PubMed] [Google Scholar]
- Deng L, Geisler CD. Responses of auditory-nerve fibers to nasal consonant–vowel syllables. J Acoust Soc Am. 1987;82:1977–1988. doi: 10.1121/1.395642. [DOI] [PubMed] [Google Scholar]
- Deng L, Geisler CD, Greenberg S. Responses of auditory-nerve fibers to multiple-tone complexes. J Acoust Soc Am. 1987;82:1989–2000. doi: 10.1121/1.395643. [DOI] [PubMed] [Google Scholar]
- Doucet JR, Ryugo DK. Structural and functional classes of multipolar cells in the ventral cochlear nucleus. Anat Rec. 2006;288:331–344. doi: 10.1002/ar.a.20294. [DOI] [PMC free article] [PubMed] [Google Scholar]
- Dragicevic CD, Aedo C, León A, Bowen M, Jara N, Terreros G, Robles L, Delano PH. The olivocochlear reflex strength and cochlear sensitivity are independently modulated by auditory cortex microstimulation. J Assoc Res Otolaryngol. 2015;16:223–240. doi: 10.1007/s10162-015-0509-9. [DOI] [PMC free article] [PubMed] [Google Scholar]
- Encina-Llamas G, Aravindakshan P, Harte JM, Dau T, Kujawa SG, Shinn-Cunningham B, Epp B. Hidden hearing loss with envelope following responses (EFRs): the off-frequency problem. ARO Abstracts. 2017;40:4. [Google Scholar]
- Fan L, Carney LH (2017) Neural responses in the inferior colliculus to diotic tone-in-noise stimuli support detection based on envelope and neural fluctuation, Abstract, Association for Research in Otolaryngology 40:250
- Fant G. Acoustic theory of speech perception. The Hague: Mouton; 1960. [Google Scholar]
- Fettiplace R, Ricci AJ. Mechanoelectrical transduction in auditory hair cells. In: Eatock RA, Fay RR, editors. Vertebrate hair cells. New York: Springer; 2006. pp. 154–203. [Google Scholar]
- Florentine M, Buus SR. An excitation-pattern model for intensity discrimination. J Acoust Soc Am. 1981;70:1646–1654. [Google Scholar]
- Florentine M, Buus SR, Mason CR. Level discrimination as a function of level for tones from 0.25 to 16 kHz. J Acoust Soc Am. 1987;81:1528–1541. doi: 10.1121/1.394505. [DOI] [PubMed] [Google Scholar]
- Forrest TG, Green DM. Detection of partially filled gaps in noise and the temporal modulation transfer function. J Acoust Soc Am. 1987;82:1933–1943. doi: 10.1121/1.395689. [DOI] [PubMed] [Google Scholar]
- Freyman RL, Griffin AM, Oxenham AJ. Intelligibility of whispered speech in stationary and modulated noise maskers. J Acoust Soc Am. 2012;132:2514–2523. doi: 10.1121/1.4747614. [DOI] [PMC free article] [PubMed] [Google Scholar]
- Fuente A. The olivocochlear system and protection from acoustic trauma: a mini literature review. Front Syst Neurosci. 2015;9(94):1–6. doi: 10.3389/fnsys.2015.00094. [DOI] [PMC free article] [PubMed] [Google Scholar]
- Furman AC, Kujawa SG, Liberman MC. Noise-induced cochlear neuropathy is selective for fibers with low spontaneous rates. J Neurophysiol. 2013;110:577–586. doi: 10.1152/jn.00164.2013. [DOI] [PMC free article] [PubMed] [Google Scholar]
- Gai Y, Carney LH. Temporal measures and neural strategies for detection of tones in noise based on responses in anteroventral cochlear nucleus. J Neurophysiol. 2006;96:2451–2464. doi: 10.1152/jn.00471.2006. [DOI] [PMC free article] [PubMed] [Google Scholar]
- Gai Y, Carney LH. Influence of inhibitory inputs on rate and timing of responses in the anteroventral cochlear nucleus. J Neurophysiol. 2008;99:1077–1095. doi: 10.1152/jn.00708.2007. [DOI] [PMC free article] [PubMed] [Google Scholar]
- Ghoshal S, Kim DO. Marginal shell of the anteroventral cochlear nucleus: intensity coding in single units of the unanesthetized, decerebrate cat. Neurosci Lett. 1996;205:71–74. doi: 10.1016/0304-3940(96)12386-7. [DOI] [PubMed] [Google Scholar]
- Green DM. Profile analysis: auditory intensity discrimination (no. 13) Oxford: Oxford University Press; 1988. [Google Scholar]
- Guinan JJ. Physiology of the medial and lateral olivocochlear systems. In: Ryugo DK, Fay RR, Popper AN, editors. Auditory and vestibular efferents. New York: Springer; 2011. pp. 39–81. [Google Scholar]
- Guinan Jr JJ. Physiology of olivocochlear efferents. In: Dallos P, Fay RR, editors. The cochlea. New York: Springer; 1996. pp. 435–502. [Google Scholar]
- Gummer M, Yates GK, Johnstone BM. Modulation transfer function of efferent neurones in the guinea pig cochlea. Hear Res. 1988;36:41–51. doi: 10.1016/0378-5955(88)90136-0. [DOI] [PubMed] [Google Scholar]
- Harrison JM, Howe ME. Anatomy of the afferent auditory nervous system of mammals. In: Keidel WD, Neff WD, editors. Auditory system. Berlin Heidelberg: Springer; 1974. pp. 283–336. [Google Scholar]
- Heinz MG, Colburn HS, Carney LH. Evaluating auditory performance limits: I. One-parameter discrimination using a computational model for the auditory nerve. Neural Comput. 2001;13:2273–2316. doi: 10.1162/089976601750541804. [DOI] [PubMed] [Google Scholar]
- Heinz MG, Colburn HS, Carney LH. Rate and timing cues associated with the cochlear amplifier: level discrimination based on monaural cross-frequency coincidence detection. J Acoust Soc Am. 2001;110:2065–2084. doi: 10.1121/1.1404977. [DOI] [PubMed] [Google Scholar]
- Helmholtz HV. In: Physiological optics. JPC S, editor. Washington, DC: Optical Society of America; 1909. [Google Scholar]
- Henry KS, Kale S, Heinz MG. Noise-induced hearing loss increases the temporal precision of complex envelope coding by auditory-nerve fibers. Front Syst Neurosci. 2014;8:1–10. doi: 10.3389/fnsys.2014.00020. [DOI] [PMC free article] [PubMed] [Google Scholar]
- Henry KS, Abrams KS, Forst J, Mender MJ, Neilans EG, Idrobo F, Carney LH. Midbrain synchrony to envelope structure supports behavioral sensitivity to single-formant vowel-like sounds in noise. J Assoc Res Otolaryngol. 2017;18:165–181. doi: 10.1007/s10162-016-0594-4. [DOI] [PMC free article] [PubMed] [Google Scholar]
- Hienz RD, Stiles P, May BJ. Effects of bilateral olivocochlear lesions on vowel formant discrimination in cats. Hear Res. 1998;116:10–20. doi: 10.1016/s0378-5955(97)00197-4. [DOI] [PubMed] [Google Scholar]
- Hillenbrand J, Getty LA, Clark MJ, Wheeler K. Acoustic characteristics of American English vowels. J Acoust Soc Am. 1995;97:3099–3111. doi: 10.1121/1.411872. [DOI] [PubMed] [Google Scholar]
- Hirsh IJ, Davis H, Silverman SR, Reynolds EG, Eldert E, Benson RW. Development of materials for speech audiometry. Journal of Speech and Hearing Disorders. 1952;17:321–337. doi: 10.1044/jshd.1703.321. [DOI] [PubMed] [Google Scholar]
- Huet A, Batrel C, Tang Y, Desmadryl G, Wang J, Puel JL, Bourien J. Sound coding in the auditory nerve of gerbils. Hear Res. 2016;338:32–39. doi: 10.1016/j.heares.2016.05.006. [DOI] [PubMed] [Google Scholar]
- Huffman RF, Henson OW. The descending auditory pathway and acousticomotor systems: connections with the inferior colliculus. Brain Res Rev. 1990;15:295–323. doi: 10.1016/0165-0173(90)90005-9. [DOI] [PubMed] [Google Scholar]
- Jacewicz E, Fox RA, Salmons J. Vowel duration in three American English dialects. American Speech. 2007;82:367–385. doi: 10.1215/00031283-2007-024. [DOI] [PMC free article] [PubMed] [Google Scholar]
- Jackson BS, Carney LH. The spontaneous-rate histogram of the auditory nerve can be explained by only two or three spontaneous rates and long-range dependence. J Assoc Res Otolaryngol. 2005;6:148–159. doi: 10.1007/s10162-005-5045-6. [DOI] [PMC free article] [PubMed] [Google Scholar]
- Jenkins WM, Masterton RB. Sound localization: effects of unilateral lesions in central auditory system. J Neurophysiol. 1982;47:987–1016. doi: 10.1152/jn.1982.47.6.987. [DOI] [PubMed] [Google Scholar]
- Jennings SG, Strickland EA, Heinz MG. Precursor effects on behavioral estimates of frequency selectivity and gain in forward masking. J Acoust Soc Am. 2009;125:2172–2181. doi: 10.1121/1.3081383. [DOI] [PMC free article] [PubMed] [Google Scholar]
- Jesteadt W, Schairer KS, Neff DL. Effect of variability in level on forward masking and on increment detection. J Acoust Soc Am. 2005;118:325–337. doi: 10.1121/1.1928709. [DOI] [PubMed] [Google Scholar]
- Johnson DH. The relationship between spike rate and synchrony in responses of auditory-nerve fibers to single tones. J Acoust Soc Am. 1980;68:1115–1122. doi: 10.1121/1.384982. [DOI] [PubMed] [Google Scholar]
- Joris PX. Interaural time sensitivity dominated by cochlea-induced envelope patterns. J Neurosci. 2003;23:6345–6350. doi: 10.1523/JNEUROSCI.23-15-06345.2003. [DOI] [PMC free article] [PubMed] [Google Scholar]
- Joris PX, Yin TC. Responses to amplitude-modulated tones in the auditory nerve of the cat. J Acoust Soc Am. 1992;91:215–232. doi: 10.1121/1.402757. [DOI] [PubMed] [Google Scholar]
- Joris PX, Schreiner CE, Rees A. Neural processing of amplitude-modulated sounds. Physiol Rev. 2004;84:541–577. doi: 10.1152/physrev.00029.2003. [DOI] [PubMed] [Google Scholar]
- Kale S, Heinz MG. Envelope coding in auditory nerve fibers following noise-induced hearing loss. J Assoc Res Otolaryngol. 2010;11:657–673. doi: 10.1007/s10162-010-0223-6. [DOI] [PMC free article] [PubMed] [Google Scholar]
- Kidd Jr G, Mason CR, Brantley MA, Owen GA. Roving-level tone-in-noise detection. J Acoust Soc Am. 1989;86:1310–1317. doi: 10.1121/1.398745. [DOI] [PubMed] [Google Scholar]
- Kim DO, Zahorik P, Carney LH, Bishop BB, Kuwada S. Auditory distance coding in rabbit midbrain neurons and human perception: monaural amplitude modulation depth as a cue. J Neurosci. 2015;35:5360–5372. doi: 10.1523/JNEUROSCI.3798-14.2015. [DOI] [PMC free article] [PubMed] [Google Scholar]
- Kohlrausch A, Püschel D, Alphei H. Temporal resolution and modulation analysis in models of the auditory system. The Auditory Processing of Speech: From Sounds to Words. 1992;10:85–98. [Google Scholar]
- Kohlrausch A, Fassel R, van der Heijden M, Kortekaas R, van de Par S, Oxenham AJ, Püschel D. Detection of tones in low-noise noise: further evidence for the role of envelope fluctuations. Acta Acustica United with Acustica. 1997;83:659–669. [Google Scholar]
- Krishna BS, Semple MN. Auditory temporal processing: responses to sinusoidally amplitude-modulated tones in the inferior colliculus. J Neurophysiol. 2000;84:255–273. doi: 10.1152/jn.2000.84.1.255. [DOI] [PubMed] [Google Scholar]
- Kujawa SG, Liberman MC. Adding insult to injury: cochlear nerve degeneration after “temporary” noise-induced hearing loss. J Neurosci. 2009;29:14077–14085. doi: 10.1523/JNEUROSCI.2845-09.2009. [DOI] [PMC free article] [PubMed] [Google Scholar]
- Kujawa SG, Liberman MC. Synaptopathy in the noise-exposed and aging cochlea: primary neural degeneration in acquired sensorineural hearing loss. Hear Res. 2015;330:191–199. doi: 10.1016/j.heares.2015.02.009. [DOI] [PMC free article] [PubMed] [Google Scholar]
- Langner G, Schreiner CE. Periodicity coding in the inferior colliculus of the cat. I. Neuronal mechanisms. J Neurophysiol. 1988;60:1799–1822. doi: 10.1152/jn.1988.60.6.1799. [DOI] [PubMed] [Google Scholar]
- Leake PA, Snyder RL. Topographic organization of the central projections of the spiral ganglion in cats. J Comp Neurol. 1989;281:612–629. doi: 10.1002/cne.902810410. [DOI] [PubMed] [Google Scholar]
- Lentz JJ, Richards VM, Matiasek MR. Different auditory filter bandwidth estimates based on profile analysis, notched noise, and hybrid tasks. J Acoust Soc Am. 1999;106:2779–2792. doi: 10.1121/1.428137. [DOI] [PubMed] [Google Scholar]
- Liberman MC. Auditory-nerve response from cats raised in a low-noise chamber. J Acoust Soc Am. 1978;63:442–455. doi: 10.1121/1.381736. [DOI] [PubMed] [Google Scholar]
- Liberman MC. Central projections of auditory-nerve fibers of differing spontaneous rate. I. Anteroventral cochlear nucleus. J Comp Neurol. 1991;313:240–258. doi: 10.1002/cne.903130205. [DOI] [PubMed] [Google Scholar]
- Liberman MC, Kujawa SG. Cochlear synaptopathy in acquired sensorineural hearing loss: manifestations and mechanisms. Hear Res. 2017;349:138–147. doi: 10.1016/j.heares.2017.01.003. [DOI] [PMC free article] [PubMed] [Google Scholar]
- Lobarinas E, Salvi R, Ding D. Insensitivity of the audiogram to carboplatin induced inner hair cell loss in chinchillas. Hear Res. 2013;302:113–120. doi: 10.1016/j.heares.2013.03.012. [DOI] [PMC free article] [PubMed] [Google Scholar]
- Lopez-Poveda EA. Why do I hear but not understand? Stochastic undersampling as a model of degraded neural encoding of speech. Front Neurosci. 2014;8:1–7. doi: 10.3389/fnins.2014.00348. [DOI] [PMC free article] [PubMed] [Google Scholar]
- Lopez-Poveda EA, Eustaquio-Martín A. A biophysical model of the inner hair cell: the contribution of potassium currents to peripheral auditory compression. J Assoc Res Otolaryngol. 2006;7:218–235. doi: 10.1007/s10162-006-0037-8. [DOI] [PMC free article] [PubMed] [Google Scholar]
- Lowen SB, Teich MC. The periodogram and Allan variance reveal fractal exponents greater than unity in auditory-nerve spike trains. J Acoust Soc Am. 1996;99:3585–3591. doi: 10.1121/1.414979. [DOI] [PubMed] [Google Scholar]
- Lyzenga J, Horst JW. Frequency discrimination of stylized synthetic vowels with a single formant. J Acoust Soc Am. 1997;102:1755–1767. doi: 10.1121/1.420085. [DOI] [PubMed] [Google Scholar]
- Maison S, Micheyl C, Collet L. Sinusoidal amplitude modulation alters contralateral noise suppression of evoked otoacoustic emissions in humans. Neuroscience. 1999;91:133–138. doi: 10.1016/s0306-4522(98)00608-3. [DOI] [PubMed] [Google Scholar]
- Manis PB, Xie R, Wang Y, Marrs GS, Spirou GA. The endbulbs of held. In: Trussell L, Popper A, Fay R, editors. Synaptic mechanisms in the auditory system. Springer handbook of auditory research. New York: Springer; 2012. pp. 61–93. [Google Scholar]
- Mao J, Carney LH. Tone-in-noise detection using envelope cues: comparison of signal-processing-based and physiological models. J Assoc Res Otolaryngol. 2015;16:121–133. doi: 10.1007/s10162-014-0489-1. [DOI] [PMC free article] [PubMed] [Google Scholar]
- Mao J, Vosoughi A, Carney LH. Predictions of diotic tone-in-noise detection based on a nonlinear optimal combination of energy, envelope, and fine-structure cues. J Acoust Soc Am. 2013;134:396–406. doi: 10.1121/1.4807815. [DOI] [PMC free article] [PubMed] [Google Scholar]
- May BJ, McQuone SJ. Effects of bilateral olivocochlear lesions on pure-tone intensity discrimination in cats. Audit Neurosci. 1995;1:385–400. [PMC free article] [PubMed] [Google Scholar]
- May BJ, Sachs MB. Dynamic range of neural rate responses in the ventral cochlear nucleus of awake cats. J Neurophysiol. 1992;68:1589–1602. doi: 10.1152/jn.1992.68.5.1589. [DOI] [PubMed] [Google Scholar]
- May BJ, Budelis J, Niparko JK. Behavioral studies of the olivocochlear efferent system: learning to listen in noise. Arch Otolaryngol Head Neck Surg. 2004;130:660–664. doi: 10.1001/archotol.130.5.660. [DOI] [PubMed] [Google Scholar]
- McGill WJ, Goldberg JP. A study of the near-miss involving Weber’s law and pure-tone intensity discrimination. Atten Percept Psychophys. 1968;4:105–109. [Google Scholar]
- Mellott JG, Bickford ME, Schofield BR. Descending projections from auditory cortex to excitatory and inhibitory cells in the nucleus of the brachium of the inferior colliculus. Front Syst Neurosci. 2014;8(188):1–15. doi: 10.3389/fnsys.2014.00188. [DOI] [PMC free article] [PubMed] [Google Scholar]
- Micheyl C, Maison S, Carlyon RP, Andéol G, Collet L. Contralateral suppression of transiently evoked otoacoustic emissions by harmonic complex tones in humans. J Acoust Soc Am. 1999;105:293–305. doi: 10.1121/1.424525. [DOI] [PubMed] [Google Scholar]
- Miller RL, Schilling JR, Franck KR, Young ED. Effects of acoustic trauma on the representation of the vowel /ε/ in cat auditory nerve fibers. J Acoust Soc Am. 1997;101:3602–3616. doi: 10.1121/1.418321. [DOI] [PubMed] [Google Scholar]
- Millman RE, Mattys SL, Gouws AD, Prendergast G. Magnified neural envelope coding predicts deficits in speech perception in noise. J Neurosci. 2017;37(32):7727–7736. doi: 10.1523/JNEUROSCI.2722-16.2017. [DOI] [PMC free article] [PubMed] [Google Scholar]
- Moore BC. An introduction to the psychology of hearing. Leiden: Brill; 2012. [Google Scholar]
- Moore BC, Glasberg BR. Simulation of the effects of loudness recruitment and threshold elevation on the intelligibility of speech in quiet and in a background of speech. J Acoust Soc Am. 1993;94:2050–2062. doi: 10.1121/1.407478. [DOI] [PubMed] [Google Scholar]
- Nayagam DA, Clarey JC, Paolini AG. Powerful, onset inhibition in the ventral nucleus of the lateral lemniscus. J Neurophysiol. 2005;94:1651–1654. doi: 10.1152/jn.00167.2005. [DOI] [PubMed] [Google Scholar]
- Nelson PC, Carney LH. A phenomenological model of peripheral and central neural responses to amplitude-modulated tones. J Acoust Soc Am. 2004;116(4):2173–2186. doi: 10.1121/1.1784442. [DOI] [PMC free article] [PubMed] [Google Scholar]
- Nelson PC, Carney LH. Neural rate and timing cues for detection and discrimination of amplitude-modulated tones in the awake rabbit inferior colliculus. J Neurophysiol. 2007;97:522–539. doi: 10.1152/jn.00776.2006.. [DOI] [PMC free article] [PubMed] [Google Scholar]
- Nilsson M, Soli SD, Sullivan JA. Development of the hearing in noise test for the measurement of speech reception thresholds in quiet and in noise. J Acoust Soc Am. 1994;95:1085–1099. doi: 10.1121/1.408469. [DOI] [PubMed] [Google Scholar]
- Oertel D, Wu SH, Garb MW, Dizack C. Morphology and physiology of cells in slice preparations of the posteroventral cochlear nucleus of mice. J Comp Neurol. 1990;295:136–154. doi: 10.1002/cne.902950112. [DOI] [PubMed] [Google Scholar]
- Olsen WO. Average speech levels and spectra in various speaking/listening conditions: a summary of the Pearson, Bennett, & Fidell (1977) report. Am J Audiol. 1998;7:21–25. doi: 10.1044/1059-0889(1998/012). [DOI] [PubMed] [Google Scholar]
- Oxenham AJ. Predicting the perceptual consequences of hidden hearing loss. Trends in Hearing. 2016;20:1–6. doi: 10.1177/2331216516686768. [DOI] [PMC free article] [PubMed] [Google Scholar]
- Oxenham AJ, Wojtczak M. Predicting effects of hidden hearing loss using signal detection theory. J Acoust Soc Am. 2016;140:3150–3150. [Google Scholar]
- Palmer AR, Wallace MN, Arnott RH, Shackleton TM. Morphology of physiologically characterised ventral cochlear nucleus stellate cells. Exp Brain Res. 2003;153:418–426. doi: 10.1007/s00221-003-1602-6. [DOI] [PubMed] [Google Scholar]
- Patterson RD, Moore BCJ. Auditory filters and excitation patterns as representations of frequency resolution. In: Moore BCJ, editor. Frequency selectivity in hearing. London: Academic; 1986. pp. 123–177. [Google Scholar]
- Pickett JM. Effects of vocal force on the intelligibility of speech sounds. J Acoust Soc Am. 1956;28:902–905. [Google Scholar]
- Pierscionek BK. What we know and understand about presbyopia. Clin Exp Optom. 1993;76:83–90. [Google Scholar]
- Plack CJ, Barker D, Prendergast G. Perceptual consequences of “hidden” hearing loss. Trends Hear. 2014;18:1–11. doi: 10.1177/2331216514550621. [DOI] [PMC free article] [PubMed] [Google Scholar]
- Plack CJ, Léger A, Prendergast G, Kluk K, Guest H, Munro KJ. Toward a diagnostic test for hidden hearing loss. Trends Hear. 2016;20:1–9. doi: 10.1177/2331216516657466. [DOI] [PMC free article] [PubMed] [Google Scholar]
- Rao A, Carney LH. Speech enhancement for listeners with hearing loss based on a model for vowel coding in the auditory midbrain. IEEE Trans Biomed Eng. 2014;61:2081–2091. doi: 10.1109/TBME.2014.2313618. [DOI] [PMC free article] [PubMed] [Google Scholar]
- Rees A, Langner G. Temporal coding in the auditory midbrain. In: Winer JA, Schreiner CE, editors. The inferior colliculus. New York: Springer; 2005. pp. 346–376. [Google Scholar]
- Remez RE, Rubin PE, Pisoni DB, Carrell TD. Speech perception without traditional speech cues. Science. 1981;212:947–949. doi: 10.1126/science.7233191. [DOI] [PubMed] [Google Scholar]
- Rhode WS, Greenberg S. Physiology of the cochlear nuclei. In: Popper AN, Fay RR, editors. The mammalian auditory pathway: neurophysiology. New York: Springer; 1992. pp. 94–152. [Google Scholar]
- Rhode WS, Greenberg S. Encoding of amplitude modulation in the cochlear nucleus of the cat. J Neurophysiol. 1994;71:1797–1825. doi: 10.1152/jn.1994.71.5.1797. [DOI] [PubMed] [Google Scholar]
- Rhode WS, Oertel D, Smith PH. Physiological response properties of cells labeled intracellularly with horseradish peroxidase in cat ventral cochlear nucleus. J Comp Neurol. 1983;213:448–463. doi: 10.1002/cne.902130408. [DOI] [PubMed] [Google Scholar]
- Richards VM. The detectability of a tone added to narrow bands of equal-energy noise. J Acoust Soc Am. 1992;91:3424–3435. doi: 10.1121/1.402831. [DOI] [PubMed] [Google Scholar]
- Roberts WM, Rutherford MA. Linear and nonlinear processing in hair cells. J Exp Biol. 2008;211:1775–1780. doi: 10.1242/jeb.017616. [DOI] [PubMed] [Google Scholar]
- Ruggles DR, Freyman RL, Oxenham AJ. Influence of musical training on understanding voiced and whispered speech in noise. PLoS One. 2014;9:e86980. doi: 10.1371/journal.pone.0086980. [DOI] [PMC free article] [PubMed] [Google Scholar]
- Russell IJ, Sellick PM. Low-frequency characteristics of intracellularly recorded receptor potentials in guinea-pig cochlear hair cells. J Physiol. 1983;338:179–206. doi: 10.1113/jphysiol.1983.sp014668. [DOI] [PMC free article] [PubMed] [Google Scholar]
- Russell IJ, Richardson GP, Cody AR. Mechanosensitivity of mammalian auditory hair cells in vitro. Nature. 1986;321:517–519. doi: 10.1038/321517a0. [DOI] [PubMed] [Google Scholar]
- Ryugo DK. Projections of low spontaneous rate, high threshold auditory nerve fibers to the small cell cap of the cochlear nucleus in cats. Neuroscience. 2008;154:114–126. doi: 10.1016/j.neuroscience.2007.10.052. [DOI] [PMC free article] [PubMed] [Google Scholar]
- Ryugo DK, Sento S. Synaptic connections of the auditory nerve in cats: relationship between endbulbs of held and spherical bushy cells. J Comp Neurol. 1991;305:35–48. doi: 10.1002/cne.903050105. [DOI] [PubMed] [Google Scholar]
- Sachs MB, Young ED. Encoding of steady-state vowels in the auditory nerve: representation in terms of discharge rate. J Acoust Soc Am. 1979;66:470–479. doi: 10.1121/1.383098. [DOI] [PubMed] [Google Scholar]
- Sachs MB, Voigt HF, Young ED. Auditory nerve representation of vowels in background noise. J Neurophysiol. 1983;50:27–45. doi: 10.1152/jn.1983.50.1.27. [DOI] [PubMed] [Google Scholar]
- Sachs MB, Bruce IC, Miller RL, Young ED. Biological basis of hearing-aid design. Ann Biomed Eng. 2002;30:157–168. doi: 10.1114/1.1458592. [DOI] [PubMed] [Google Scholar]
- Sachs MB, May BJ, Le Prell GS, Hienz RD. Adequacy of auditory-nerve rate representations of vowels: comparison with behavioral measures in cat. In: Greenberg S, Ainsworth W, editors. Listening to speech: an auditory perspective. Mahwah: Lawrence Erlbaum; 2006. pp. 115–127. [Google Scholar]
- Schaette R, McAlpine D. Tinnitus with a normal audiogram: physiological evidence for hidden hearing loss and computational model. J Neurosci. 2011;31:13452–13457. doi: 10.1523/JNEUROSCI.2156-11.2011. [DOI] [PMC free article] [PubMed] [Google Scholar]
- Schalk TB, Sachs MB. Nonlinearities in auditory-nerve fiber responses to bandlimited noise. J Acoust Soc Am. 1980;67:903–913. doi: 10.1121/1.383970. [DOI] [PubMed] [Google Scholar]
- Schofield BR. Central descending auditory pathways. In: Ryugo DK, Fay RR, Popper AN, editors. Auditory and vestibular Efferents. New York: Springer; 2011. pp. 261–290. [Google Scholar]
- Schofield BR, Cant NB. Ventral nucleus of the lateral lemniscus in guinea pigs: cytoarchitecture and inputs from the cochlear nucleus. J Comp Neurol. 1997;379:363–385. doi: 10.1002/(sici)1096-9861(19970317)379:3<363::aid-cne4>3.0.co;2-1. [DOI] [PubMed] [Google Scholar]
- Schofield BR, Cant NB. Descending auditory pathways: projections from the inferior colliculus contact superior olivary cells that project bilaterally to the cochlear nuclei. J Comp Neurol. 1999;409:210–223. doi: 10.1002/(sici)1096-9861(19990628)409:2<210::aid-cne3>3.0.co;2-a. [DOI] [PubMed] [Google Scholar]
- Sewell WF. Furosemide selectively reduces one component in rate-level functions from auditory-nerve fibers. Hear Res. 1984;15:69–72. doi: 10.1016/0378-5955(84)90226-0. [DOI] [PubMed] [Google Scholar]
- Sherman SM, Spear PD. Organization of visual pathways in normal and visually deprived cats. Physiol Rev. 1982;62:738–855. doi: 10.1152/physrev.1982.62.2.738. [DOI] [PubMed] [Google Scholar]
- Siebert WM. Some implications of the stochastic behavior of primary auditory neurons. Kybernetika. 1965;2:206–215. doi: 10.1007/BF00306416. [DOI] [PubMed] [Google Scholar]
- Sinex DG. Responses of cochlear nucleus neurons to harmonic and mistuned complex tones. Hear Res. 2008;238:39–48. doi: 10.1016/j.heares.2007.11.001. [DOI] [PMC free article] [PubMed] [Google Scholar]
- Sinex DG, Sabes JH, Li H. Responses of inferior colliculus neurons to harmonic and mistuned complex tones. Hear Res. 2002;168:150–162. doi: 10.1016/s0378-5955(02)00366-0. [DOI] [PubMed] [Google Scholar]
- Sinex DG, Guzik H, Li H, Sabes JH. Responses of auditory nerve fibers to harmonic and mistuned complex tones. Hear Res. 2003;182:130–139. doi: 10.1016/s0378-5955(03)00189-8. [DOI] [PubMed] [Google Scholar]
- Smith RL, Brachman ML. Adaptation in auditory-nerve fibers: a revised model. Biol Cybern. 1982;44:107–120. doi: 10.1007/BF00317970. [DOI] [PubMed] [Google Scholar]
- Smith DW, Keil A. The biological role of the medial olivocochlear efferents in hearing: separating evolved function from exaptation. Front Syst Neurosci. 2015;9(12):1–6. doi: 10.3389/fnsys.2015.00012. [DOI] [PMC free article] [PubMed] [Google Scholar]
- Smith PH, Rhode WS. Structural and functional properties distinguish two types of multipolar cells in the ventral cochlear nucleus. J Comp Neurol. 1989;282:595–616. doi: 10.1002/cne.902820410. [DOI] [PubMed] [Google Scholar]
- Smith RL, Zwislocki JJ. Short-term adaptation and incremental responses of single auditory-nerve fibers. Biol Cybern. 1975;17:169–182. doi: 10.1007/BF00364166. [DOI] [PubMed] [Google Scholar]
- Smith RL, Brachman ML, Frisina RD. Sensitivity of auditory-nerve fibers to changes in intensity: a dichotomy between decrements and increments. J Acoust Soc Am. 1985;78:1310–1316. doi: 10.1121/1.392900. [DOI] [PubMed] [Google Scholar]
- Smith PH, Massie A, Joris PX. Acoustic stria: anatomy of physiologically characterized cells and their axonal projection patterns. J Comp Neurol. 2005;482:349–371. doi: 10.1002/cne.20407. [DOI] [PubMed] [Google Scholar]
- Spirou GA, Brownell WE, Zidanic M. Recordings from cat trapezoid body and HRP labeling of globular bushy cell axons. J Neurophysiol. 1990;63:1169–1190. doi: 10.1152/jn.1990.63.5.1169. [DOI] [PubMed] [Google Scholar]
- Spirou GA, Rager J, Manis PB. Convergence of auditory-nerve fiber projections onto globular bushy cells. Neuroscience. 2005;136:843–863. doi: 10.1016/j.neuroscience.2005.08.068. [DOI] [PubMed] [Google Scholar]
- Strickland EA. The relationship between precursor level and the temporal effect. J Acoust Soc Am. 2008;123:946–954. doi: 10.1121/1.2821977. [DOI] [PMC free article] [PubMed] [Google Scholar]
- Strickland EA, Krishnan LA. The temporal effect in listeners with mild to moderate cochlear hearing impairment. J Acoust Soc Am. 2005;118:3211–3217. doi: 10.1121/1.2074787. [DOI] [PubMed] [Google Scholar]
- Studebaker GA, Sherbecoe RL, McDaniel DM, Gwaltney CA. Monosyllabic word recognition at higher-than-normal speech and noise levels. J Acoust Soc Am. 1999;105:2431–2444. doi: 10.1121/1.426848. [DOI] [PubMed] [Google Scholar]
- Swaminathan J, Goldsworthy RL, Zurek PM, Léger AC, Braida LD. Preliminary evaluation of a physiologically inspired signal processing strategy for cochlear implants. J Acoust Soc Am. 2014;135:2410–2410. [Google Scholar]
- Teich MC, Lowen SB. Fractal patterns in auditory nerve-spike trains. IEEE Engineering in Medicine and Biology Magazine. 1994;13:197–202. [Google Scholar]
- Teich MC, Johnson DH, Kumar AR, Turcott RG. Rate fluctuations and fractional power-law noise recorded from cells in the lower auditory pathway of the cat. Hear Res. 1990;46:41–52. doi: 10.1016/0378-5955(90)90138-f. [DOI] [PubMed] [Google Scholar]
- Terreros G, Delano PH. Corticofugal modulation of peripheral auditory responses. Front Syst Neurosci. 2015;9(134):1–8. doi: 10.3389/fnsys.2015.00134. [DOI] [PMC free article] [PubMed] [Google Scholar]
- Thompson AM, Thompson GC. Relationship of descending inferior colliculus projections to olivocochlear neurons. J Comp Neurol. 1993;335:402–412. doi: 10.1002/cne.903350309. [DOI] [PubMed] [Google Scholar]
- Tsuji J, Liberman MC. Intracellular labeling of auditory nerve fibers in guinea pig: central and peripheral projections. J Comp Neurol. 1997;381:188–202. [PubMed] [Google Scholar]
- Umeda N. Consonant duration in American English. J Acoust Soc Am. 1977;61:846–858. doi: 10.1121/1.380688. [DOI] [PubMed] [Google Scholar]
- van der Heijden M, Kohlrausch A. The role of envelope fluctuations in spectral masking. J Acoust Soc Am. 1995;97:1800–1807. doi: 10.1121/1.412056. [DOI] [PubMed] [Google Scholar]
- Victor JD, Nirenberg S. Spike trains as event sequences: fundamental implications. In: DiLorenzo PM, Victor JD, editors. Spike timing: mechanisms and function. Boca Raton: CRC Press; 2013. pp. 3–33. [Google Scholar]
- Viemeister NF. Intensity coding and the dynamic range problem. Hear Res. 1988;34:267–274. doi: 10.1016/0378-5955(88)90007-x. [DOI] [PubMed] [Google Scholar]
- Warr WB. Organization of olivocochlear efferent systems in mammals. In: Webster DB, Fay R, editors. The mammalian auditory pathway: neuroanatomy. New York: Springer; 1992. pp. 410–448. [Google Scholar]
- Warren EH, Liberman MC. Effects of contralateral sound on auditory-nerve responses. I. Contributions of cochlear efferents. Hear Res. 1989;37:89–104. doi: 10.1016/0378-5955(89)90032-4. [DOI] [PubMed] [Google Scholar]
- Weale RA. Presbyopia. Br J Ophthalmol. 1962;46:660–668. doi: 10.1136/bjo.46.11.660. [DOI] [PMC free article] [PubMed] [Google Scholar]
- Wen B, Wang GI, Dean I, Delgutte B. Dynamic range adaptation to sound level statistics in the auditory nerve. J Neurosci. 2009;29:13797–13808. doi: 10.1523/JNEUROSCI.5610-08.2009. [DOI] [PMC free article] [PubMed] [Google Scholar]
- Wilson BS, Dorman MF. Cochlear implants: a remarkable past and a brilliant future. Hear Res. 2008;242:3–21. doi: 10.1016/j.heares.2008.06.005. [DOI] [PMC free article] [PubMed] [Google Scholar]
- Winslow RL, Sachs MB. Single-tone intensity discrimination based on auditory-nerve rate responses in backgrounds of quiet, noise, and with stimulation of the crossed olivocochlear bundle. Hear Res. 1988;35:165–189. doi: 10.1016/0378-5955(88)90116-5. [DOI] [PubMed] [Google Scholar]
- Winslow RL, Barta PE, Sachs MB. Rate coding in the auditory nerve. In: Yost WA, Watson CS, editors. Auditory processing of complex sounds. Hillsdale: Lawrence Erlbaum; 1987. pp. 212–224. [Google Scholar]
- Winter IM, Palmer AR. Intensity coding in low-frequency auditory-nerve fibers of the guinea pig. J Acoust Soc Am. 1991;90:1958–1967. doi: 10.1121/1.401675. [DOI] [PubMed] [Google Scholar]
- Winter IM, Robertson D, Yates GK. Diversity of characteristic frequency rate-intensity functions in guinea pig auditory nerve fibres. Hear Res. 1990;45:191–202. doi: 10.1016/0378-5955(90)90120-e. [DOI] [PubMed] [Google Scholar]
- Wong S, Henry KS. Effects of auditory-nerve damage on behavioral tone detection by budgerigars in quiet and in noise. ARO Abstracts. 2018;41:13. [Google Scholar]
- Yates GK. Basilar membrane nonlinearity and its influence on auditory nerve rate-intensity functions. Hear Res. 1990;50:145–162. doi: 10.1016/0378-5955(90)90041-m. [DOI] [PubMed] [Google Scholar]
- Yates G, Johnstone B, Patuzzi R, Robertson D. Mechanical preprocessing in the mammalian cochlea. Trends Neurosci. 1992;15(2):57–61. doi: 10.1016/0166-2236(92)90027-6. [DOI] [PubMed] [Google Scholar]
- Ye Y, Machado DG, Kim DO. Projection of the marginal shell of the anteroventral cochlear nucleus to olivocochlear neurons in the cat. J Comp Neurol. 2000;420:127–138. [PubMed] [Google Scholar]
- Young ED, Davis KA. Circuitry and function of the dorsal cochlear nucleus. In: Oertel D, Fay RR, Popper AN, editors. Integrative functions in the mammalian auditory pathway. New York: Springer; 2002. pp. 160–206. [Google Scholar]
- Zeddies DG, Siegel JH. A biophysical model of an inner hair cell. J Acoust Soc Am. 2004;116:426–441. doi: 10.1121/1.1755237. [DOI] [PubMed] [Google Scholar]
- Zhong Z, Henry KS, Heinz MG. Sensorineural hearing loss amplifies neural coding of envelope information in the central auditory system of chinchillas. Hear Res. 2014;309:55–62. doi: 10.1016/j.heares.2013.11.006. [DOI] [PMC free article] [PubMed] [Google Scholar]
- Zilany MSA, Bruce IC. Representation of the vowel /ε/ in normal and impaired auditory nerve fibers: model predictions of responses in cats. J Acoust Soc Am. 2007;122:402–417. doi: 10.1121/1.2735117. [DOI] [PubMed] [Google Scholar]
- Zilany MSA, Carney LH. Power-law dynamics in an auditory-nerve model can account for neural adaptation to sound-level statistics. J Neurosci. 2010;30:10380–10390. doi: 10.1523/JNEUROSCI.0647-10.2010. [DOI] [PMC free article] [PubMed] [Google Scholar]
- Zilany MS, Bruce IC, Nelson PC, Carney LH. A phenomenological model of the synapse between the inner hair cell and auditory nerve: long-term adaptation with power-law dynamics. J Acoust Soc Am. 2009;126:2390–2412. doi: 10.1121/1.3238250. [DOI] [PMC free article] [PubMed] [Google Scholar]
- Zilany MS, Bruce IC, Carney LH. Updated parameters and expanded simulation options for a model of the auditory periphery. J Acoust Soc Am. 2014;135:283–286. doi: 10.1121/1.4837815. [DOI] [PMC free article] [PubMed] [Google Scholar]
- Zwicker E (1965) Temporal effects in simultaneous masking by white‐noise bursts. J Acoust Soc Am 37:653–663 [DOI] [PubMed]