

Abstract
The acoustic change complex (ACC) is a scalp-recorded cortical evoked potential complex generated in response to changes (e.g., frequency, amplitude) in an auditory stimulus. The ACC has been well studied in humans, but to our knowledge, no animal model has been evaluated. In particular, it was not known whether the ACC could be recorded under the conditions of sedation that likely would be necessary for recordings from animals. For that reason, we tested the feasibility of recording ACC from sedated cats in response to changes of frequency and amplitude of pure-tone stimuli. Cats were sedated with ketamine and acepromazine, and subdermal needle electrodes were used to record electroencephalographic (EEG) activity. Tones were presented from a small loudspeaker located near the right ear. Continuous tones alternated at 500-ms intervals between two frequencies or two levels. Neurometric functions were created by recording neural response amplitudes while systematically varying the magnitude of steps in frequency centered in octave frequency around 2, 4, 8, and 16 kHz, all at 75 dB SPL, or in decibel level around 75 dB SPL tested at 4 and 8 kHz. The ACC could be recorded readily under this ketamine/azepromazine sedation. In contrast, ACC could not be recorded reliably under any level of isoflurane anesthesia that was tested. The minimum frequency (expressed as Weber fractions (df/f)) or level steps (expressed in dB) needed to elicit ACC fell in the range of previous thresholds reported in animal psychophysical tests of discrimination. The success in recording ACC in sedated animals suggests that the ACC will be a useful tool for evaluation of other aspects of auditory acuity in normal hearing and, presumably, in electrical cochlear stimulation, especially for novel stimulation modes that are not yet feasible in humans.
Keywords: frequency acuity, auditory-evoked potential, level acuity, frequency change, cat
INTRODUCTION
The acoustic change complex (ACC) is a cortical evoked potential complex generated in response to changes (e.g., frequency, amplitude) in an auditory stimulus (Martin and Boothroyd, 1999) and is believed to show sensitivity comparable to perceptual difference limens (Martin et al., 2010). The ACC is characterized in humans by a P1-N1-P2 complex that grows in amplitude in proportion to the magnitude of the acoustic change. The ACC has been recorded in normal-hearing subjects (Arlinger et al., 1976; Kohn et al., 1978; Tietze and Afontshenko, 1978; Yingling and Nethercut, 1983; Martin and Boothroyd, 2000; Harris et al., 2007; Dimitrijevic et al., 2008; Dimitrijevic et al., 2009; Martin et al., 2010; Chen and Small, 2015), in hearing-impaired subjects (Arlinger and Jerlvall, 1979; Martinez et al., 2013), and in cochlear implant users (Martin, 2007; Brown et al., 2008; Han and Dimitrijevic, 2015; Scheperle and Abbas, 2015). A key feature of the ACC is that it can be recorded from subjects that are exposed passively to the stimuli, thus reducing the effect of cognitive factors on the waveform and reducing the need for cooperation from the subject.
The ACC bears some similarity to the mismatch negativity (MMN), which is a scalp-recorded potential that has been described in humans (Näätänen et al., 1978) and animals (Nelken and Ulanovsky, 2007). The MMN is computed as the response to a test stimulus when it is presented at low probability (an “oddball”) in a context of presentations of a standard sound compared to when the same test stimulus is presented at high probability. In contrast, the ACC is measured directly as a response to a change in an ongoing stimulus, potentially between two equal-probability sounds (Martin et al., 2010). The ACC is favorable for some applications because it has higher amplitude and greater test-retest reliability than MMN. In particular, the ACC lends itself to experimental designs that employ parallel electrophysiological and psychophysical discrimination of paired stimuli. Indeed, recent findings (Dimitrijevic et al., 2011; He et al., 2012) have shown that thresholds for the ACC tend to approximate thresholds for psychoacoustic measurements (i.e., frequency and intensity discrimination, speech scores), suggesting that the ACC might be used as a surrogate for time-consuming psychophysical tasks.
In principle, the ACC would seem to be a useful tool for study of auditory function in experimental animals. For instance, it could be used as a way to track ongoing responses to experimental manipulations of auditory experience or as a minimally invasive objective measurement of the performance of novel modes of prosthetic stimulation that are not yet feasible in humans (Middlebrooks and Snyder, 2007, 2008, 2010). A potential difficulty for ACC recording in an animal model, however, is that the animal likely would need to be sedated to eliminate movement artifacts and aversive responses to insertion of subdermal electrodes. That is a concern because some types of auditory-evoked potentials have been shown to be suppressed or eliminated in certain anesthetic conditions (Thornton et al., 1983; Savoia et al., 1988; Haenggi et al., 2004).
The purpose of the current study was to evaluate the ACC under conditions of light sedation. We tested simple acoustic contrasts: abrupt changes in the frequency or level of pure tones. We found that a robust ACC could be recorded in cats under light sedation with ketamine and acepromazine, although the ACC was abolished under surgical levels of anesthesia with isoflurane. Moreover, threshold frequency and level steps measured for eliciting the ACC fell in the range of thresholds reported from previous cat psychophysical studies (Butler et al., 1957; Elliott et al., 1960; Igarashi et al., 1979b; Hienz et al., 1993; Brown et al., 2004), again suggesting that ACC could augment or take the place of challenging animal psychophysical training.
MATERIALS AND METHODS
Animals
All procedures were in accordance with the NIH Animal Welfare Guidelines and with a protocol approved by the Institutional Animal Care and Use Committee at the University of California at Irvine. Five domestic shorthairs (Felis catus) (four females, one male) were obtained from a research breeding colony at the University of California at Davis. No hearing deficits were evident. Ages ranged from 1 to 6 years.
Anesthesia
In each session, a light level of anesthesia was induced with an intramuscular injection of ketamine (20 mg/kg) and acepromazine (1 mg/kg); this was a level at which limb-withdrawal or eye-blink reflexes were present but in which there are no spontaneous movements. A second, occasionally a third, injection of ketamine alone was used during the experiment to maintain the sedation at the stable level. In separate experimental sessions, two of the cats were tested with isoflurane anesthesia alone, inhaled at 1.5 and 2 % in oxygen; concentrations lower than 1.5 % did not produce adequate sedation.
Stimulus Generation
Stimulus generation and data acquisition used System III hardware from Tucker-Davis Technologies (TDT; Alachua, FL) controlled by custom MATLAB software (The Mathworks; Natick, MA) on a Windows-based computer. Sounds were generated with 24-bit precision at a sample rate of 97,656 Hz. All the auditory stimuli were presented at a sound-field level of 75 dB SPL (or in controlled steps around that level) through a speaker (TDT MF1) that was placed ~ 20 cm to the right of the cat’s head. The speaker was calibrated in the absence of the cat using a precision ½″ microphone (ACO Pacific) placed at the location occupied by the cat’s right ear during the experiment; the calibration was used to equalize tone levels across frequencies at known sound pressure levels re 20 μPa (i.e., re 0 dB SPL).
Electroencephalography
Scalp potentials were recorded using TDT hardware with clinical subdermal electrodes. There were two active electrodes, one on each hemisphere, a reference on the mastoid ipsilateral to the stimulus, and a ground on the back of the cat. The sampling frequency was 24,414 Hz. A digital high-pass filter (corner frequency at 1 Hz) was applied online to remove DC voltage and undesired low-frequency fluctuations. Then, the signal was down-sampled in real time to 3052 Hz and stored. Three hundred and one sweeps, lasting a total of 301 s, were collected for each pair of frequencies and levels, where each 1-s “sweep” contained one downward and one upward step of frequency or sound level. There was only one onset and one offset for each 301-s sequence of sweeps.
Stimulus Conditions
Tones were presented continuously in an alternating pattern following the steps described by Martin et al. (2010). The tone frequency or level was held at one value for 500 ms, then stepped downward with a 3-ms ramp and held at a lower value for 500 ms, then stepped upward with a ramp and held for 500 ms, and so on continuously for an overall duration of 301 s for each pair of frequencies or levels. For the frequency discrimination, the frequency steps were spaced in steps centered logarithmically (i.e., in fractional octaves) around one of four different frequencies, 2, 4, 8, and 16 kHz, all at a level of 75 dB SPL. For the level discrimination, level steps were spaced in decibels around 75 dB SPL at 4 or 8 kHz. Tables 1 and 2 show the stimulus-value pairs used for the frequency and the level discriminations, respectively; for comparison, a musical semitone is 0.0833 oct. The 0-oct and 0-dB “steps” were sounds having constant frequency or level used as the baseline. The order of the pairs being presented was randomized to minimize possible effects of gradual drift in anesthesia level. In a few situations (3.8 % of the total conditions tested) in which the anesthetic started to wear off near the end of a condition, an additional dose of anesthetic was administered and then that condition was repeated. In those situations, the set of recordings for those specific conditions were analyzed and the one that best fit the pattern of the other pairs tested was chosen. In each of those cases, that turned out to be the condition with the maximum peak-to-peak amplitude response. An additional 301 sweeps, with 500-ms silent inter-stimulus intervals, were collected to measure the onset response for all the center frequencies tested for the ACC at 75 dB SPL.
Table 1.
Frequency steps for each fundamental base frequency tested
| Frequency step (octave) | Center frequency, 2 kHz | Center frequency, 4 kHz | Center frequency, 8 kHz | Center frequency, 16 kHz |
|---|---|---|---|---|
| 0 | 2000 vs 2000 | 4000 vs 4000 | 8000 vs 8000 | 16,000 vs 16,000 |
| 0.006 | 1996 vs 2004 | 3991 vs 4009 | 7982 vs 8018 | 15,964 vs 16,036 |
| 0.02 | 1987 vs 2013 | 3973 vs 4027 | 7947 vs 8053 | 15,894 vs 16,107 |
| 0.03 | 1978 vs 2022 | 3956 vs 4045 | 7912 vs 8089 | 15,823 vs 16,179 |
| 0.04 | 1969 vs 2031 | 3938 vs 4063 | 7877 vs 8125 | 15,753 vs 16,251 |
| 0.06 | 1960 vs 2040 | 3921 vs 4081 | 7842 vs 8162 | 15,683 vs 16,323 |
| 0.07 | 1952 vs 2049 | 3903 vs 4099 | 7807 vs 8198 | 15,614 vs 16,396 |
Table 2.
Level steps for each fundamental base frequency tested. The central level was constant at 75 dB SPL
| Level step (dB) | Levels (in dB SPL) tested at 4 and 8 kHz |
|---|---|
| 0 | 75 vs 75 |
| 0.5 | 74.75 vs 75.25 |
| 1 | 74.5 vs 75.5 |
| 1.5 | 74.25 vs 75.75 |
| 2 | 74 vs 76 |
| 3 | 73.5 vs 76.5 |
| 5 | 72.5 vs 77.5 |
Data Analysis
Electroencephalography (EEG) data were analyzed offline using custom MATLAB software. An infinite impulse response notch filter was first applied to each waveform to remove 60 Hz and its harmonics, and then, a fourth-order, zero-phase shift, band-pass Butterworth filter (1–30 Hz) was applied. The first sweep was removed from the analysis of each condition to eliminate responses to the stimulus onset, and the final computations were conducted on the remaining 300 sweeps. Two temporal epochs from each sweep were analyzed independently: the descending ACC (D-ACC) epoch from 10 to 100 ms relative to the downward stimulus step and the ascending ACC (A-ACC) from 510 to 600 ms relative to the downward step (i.e., 10 to 100 ms relative to the upward step). Two main analyses were carried out on waveforms in the D-ACC and A-ACC epochs. In the first one, the average of the 300 sweeps was calculated and the amplitudes were extracted for the first major positive peak occurring after 20 ms from the stimulus step in D-ACC and A-ACC epochs (named P1 and P1′, respectively) and for the first major negative peak occurring after 50 ms from the stimulus step for D-ACC and A-ACC (named N1 and N1′, respectively). The extraction of amplitude and latency of the peaks was automated; visual inspection of example waveforms confirmed the accuracy of the automatic procedure. The differences between these two amplitudes (P1 − N1 and P1′ − N1′) were used as a measurement of the magnitude of ACCs in the D-ACC and A-ACC epochs.
The second analysis consisted of a receiver-operating-characteristic (ROC) analysis of sweep-by-sweep values of P1-N1 and P1′-N1′ (Green and Swets, 1966; Macmillan and Creelman, 2005). The ROC analysis was chosen because it incorporates both the mean and the sweep-by-sweep variation in responses and because it yields a dimensionless index of sensitivity, d′, that can be compared with psychophysical results. For that analysis of each stimulus condition, 500 bootstrap samples of peak-to-peak amplitudes were collected, each sample consisting of the mean of 50 random draws with replacement (Efron and Tibshirani, 1991). The 500 samples for a particular stimulus step and the 500 samples for the no-step baseline condition were used to form an empirical ROC curve. The area under the curve gave the proportion of correct discriminations of a particular stimulus step vs baseline. That proportion was expressed as a z-score and then multiplied by √2 to give d′. In instances in which the proportion correct was 0.0 or 1.0 (and the z-score would be undefined), the proportion was changed to 1/2N or 1–1/2N, respectively, for N = 500 (Macmillan and Kaplan, 1985). Given that adjustment, the minimum and maximum possible values of d′ were ± 4.37.
Statistical Analysis
Statistical tests used non-parametric procedures in SPSS (IBM SPSS Statistics, Armonk, NY). Generally, comparisons of pairs of stimulus or recording conditions were made across N = 5 cats. Whenever appropriate, the false discovery rate procedure (Benjamini and Hochberg, 1995) was applied to control for multiple comparisons.
RESULTS
Frequency Discrimination
Grand averages of waveforms across all five cats are shown in Fig. 1 for all the frequency steps around all the center frequencies, and responses from individual cats are displayed in Fig. 2. In most conditions, a downward frequency step (at time 0) elicited a P1-N1 complex in the D-ACC epoch, and an upward frequency step (at time 500 ms) elicited a P1′-N1′ complex in the A-ACC epoch. In the figures, the time origin at 0 ms refers to a frequency step in a continuously repeating sound, not to the onset of a sound. In some occasions, we observed a prominent positive peak following N1 or N1′; however, this late peak was lower in amplitude than the P1-N1 and P1′-N1′ complexes and often was not even clearly visible. For that reason, we restrict the analysis to P1 and N1 and to P1′ and N1′ and omit the late peak from our analysis.
Fig. 1.
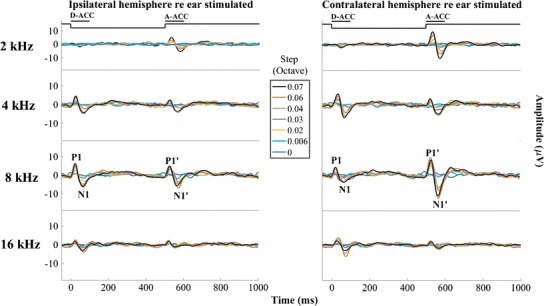
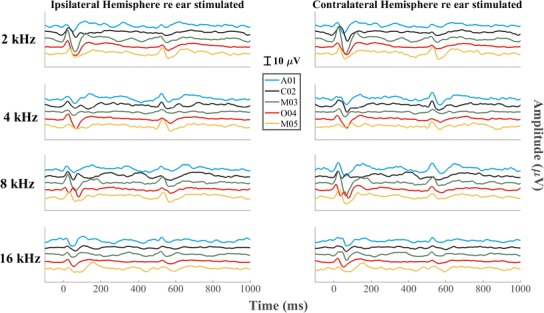
Grand averages of the responses to all the frequency steps for all the center frequencies. Left and right columns show waveform recorded from the right (ipsilateral) and left (contralateral) hemispheres, respectively. Each row represents a different center frequency, with colors representing various frequency steps. Step 0 represents the baseline, which was a tone presented continuously at constant frequency throughout the recording. The continuous solid black line at the top of each column of figures represents the time course of the tone frequency. The peaks of interest in D-ACC and A-ACC have been labeled P1-N1 and P1′-N1′, respectively. The amplitudes of the responses generally increased as the frequency step became larger
Fig. 2.
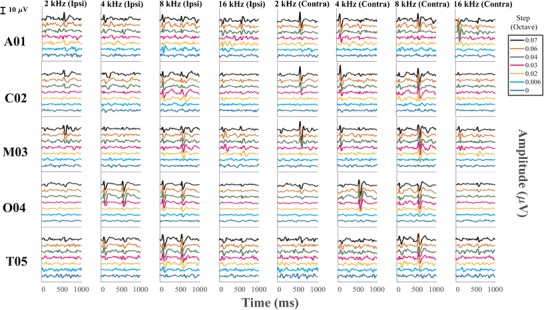
ACC recorded from each individual cat tested across all the frequency steps from the electrode placed both ipsilateral and contralateral re to the ear stimulated
Inspection of the waveforms from individual cats (Fig. 2) shows considerable variation among animals. For instance, the contralateral responses to 4 kHz were stronger in the D-ACC epoch in three cats (A01, C02, M03), were stronger in the A-ACC epoch in cat O04, and were quite weak in both epochs in cat T05. The ipsilateral response to 4 kHz shows robust responses in both D-ACC and A-ACC epochs in cat O04 and relatively small responses in the other cats.
In most conditions, the magnitude of the ACC was equal to or greater in the hemisphere contralateral to the side of the stimulus than in the ipsilateral hemisphere. Specifically, the magnitudes of the A-ACC at 2, 4, and 8 kHz in the contralateral hemisphere were significantly higher than the corresponding responses in the ipsilateral hemisphere (Wilcoxon signed-rank test, p values = 2.4 * 10−5, 0.022, and 2.4 * 10−5 for 2, 4, and 8 kHz, respectively, after correcting for multiple comparisons), while the magnitudes of the D-ACC at 8 kHz in the ipsilateral hemisphere were significantly higher than the corresponding responses in the contralateral hemisphere (Wilcoxon signed-rank test, p = 1.8 * 10−6 after correcting for multiple comparisons); none of the other comparisons was significant (p = 0.36, 0.15, and 0.93 for 2, 4, and 16 kHz of the D-ACC and p = 0.093 for 16 kHz of the A-ACC). Also, the amplitudes of responses to downward and upward frequency steps tended to differ. In this data set, responses to 2-kHz center frequencies were significantly stronger for upward steps in both the ipsilateral and contralateral hemispheres (Wilcoxon signed-rank test, p values = 0.0036 and 0.00095 for the ipsilateral and contralateral hemispheres, respectively, after correcting for multiple comparisons), whereas responses at 8-kHz center frequencies were significantly stronger for upward sweeps only in the contralateral hemisphere (Wilcoxon signed-rank test, p = 0.000012 after correcting for multiple comparisons). The grand average for the contralateral response to 4 kHz seems to show about equal magnitudes in response of downward and upward frequency steps (Fig. 1), whereas as noted the results from individual cats tend to show biases for one or the other direction of frequency step. Preferences for upward or downward steps around 16 kHz were inconsistent. Given the generally greater ACC amplitudes in the contralateral hemisphere, we focused on that hemisphere for the quantitative analysis that follows.
Figure 3 shows the peak-to-peak amplitudes for each cat as a function of magnitude of the frequency step; the values are P1 minus N1 for D-ACC and P1′ minus N1′ for A-ACC. The ACC was elicited in all animals in nearly all conditions, although the amplitudes varied considerably among individuals and conditions. The amplitudes of the ACCs generally increased with increasing magnitudes of frequency steps, although ACC amplitudes sometimes declined at the maximum stimulus steps, as seen for example in O04 (8 kHz, contralateral condition). In some conditions, the amplitude of the ACC grew consistently across most of the range of frequency steps tested, as in the A-ACC at 2 kHz (all animals) (Friedman test, χ2 = 25, p < 1 * 10−6) and the D-ACC at 4 kHz (cats A01, C02, and M03) (Friedman test, χ2 = 25, p < 1 * 10−6). In other conditions, the ACC amplitude rapidly reached a plateau, as did the A-ACC at 8 kHz. At 2 kHz, there was little or no D-ACC for any frequency step in any cat (Friedman test, χ2 = 6.5, p = 0.39).
Fig. 3.

Peak-to-peak amplitude of the response recorded from the hemisphere contralateral to the ear stimulated for all the frequency steps tested re base frequency for each of the five cats. The top row shows the results of the D-ACC, while the bottom one shows the results of the A-ACC. The ACC was elicited in all the cats, with the most reliable growth of amplitude observed at center frequencies below 16,000 Hz
Figure 4 shows the latencies of P1 and N1 peaks for the D-ACC and A-ACC. Across the five animals, latencies for P1 and N1 peaks relative to maximal downward steps averaged 24.2 and 67.3 ms, respectively, and latencies for P1′ and N1′ peaks averaged 28.7 and 67.2 ms relative to maximal upward steps. Latencies tended to vary widely among cats and among magnitudes of frequency steps. In some cases (e.g., 8 kHz, P1; N1′, 8 kHz), latencies for the widest frequency steps tended to converge around a mean value, whereas in other cases, there was considerable variation among cats even at the highest level (e.g., N1, 2 kHz).
Fig. 4.
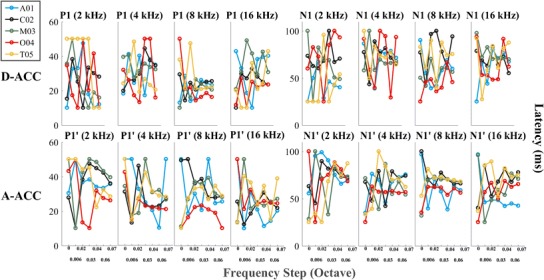
Latencies of the P1, P1′, N1, and N1′ peaks recorded from the hemisphere contralateral to the ear stimulated for all the frequency steps tested re base frequency for each of the five cats. The top row shows the results of the D-ACC, while the bottom one shows the results of the A-ACC. In most cases, latencies tended to converge to a restricted range as the waveform magnitude grew in response to increasing magnitude of the frequency step
The threshold for frequency discrimination by the ACC was estimated by calculating the sensitivity index, d′, for each cat for each frequency condition. The advantage of d′ for this analysis is that it incorporates both the mean and sweep-by-sweep variance in waveform amplitudes between stimulus conditions. Figure 5 plots d′ as a function of frequency step size for each cat for the responses recorded from the hemisphere contralateral to the ear stimulated. Values of d′ reached or surpassed the criterion of 1.0 for all cats at 2 and 8 kHz for the A-ACC and at 8 kHz for the D-ACC. Figure 6 shows thresholds for frequency discrimination, given by the smallest frequency step that produced d′ ≥ 1. In keeping with the observation of greater d′ for the D-ACC for the 4-kHz center frequency, we plot thresholds for the D-ACC for the 4-kHz condition and for the A-ACC for the other center frequencies. Values of d′ for cats T05 and A01 did not reach the criterion of d′ ≥ 1 for center frequencies of 4 and 16 kHz, respectively.
Fig. 5.
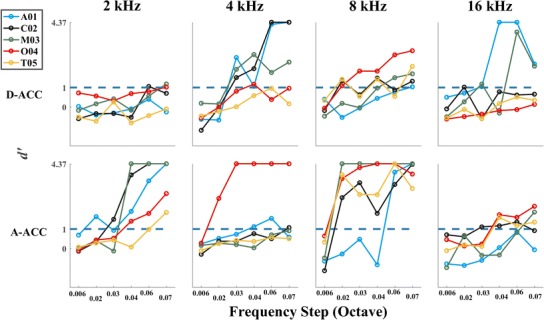
Sensitivity index, d′, of the response recorded from the hemisphere contralateral to the ear stimulated for all the frequency steps tested re center frequency for each of the five cats tested. The top row shows d′ values for the D-ACC, and the bottom shows d′ for the A-ACC. The blue dashed line in each panel represents the criterion for threshold
Fig. 6.
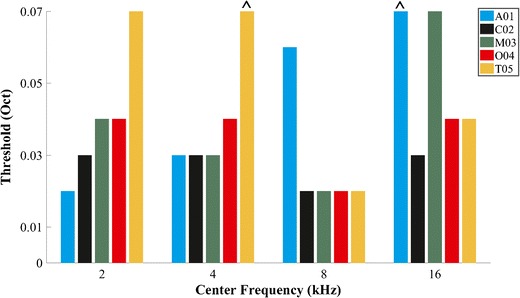
Threshold for each cat and for each center frequency tested based on a criterion of d′ = 1. Frequencies at which d′ did not reach criterion are marked with the circumflex accent symbol
The thresholds given by the d′ analysis of the ACCs were compared with thresholds from previously reported cat psychophysical experiments (Butler et al., 1957; Elliott et al., 1960; Igarashi et al., 1979b; Hienz et al., 1993; Brown et al., 2004); in those experiments, cats were trained to detect an increase in the frequency of a tone above a base frequency. For this comparison, we used the threshold calculated for the D-ACC at 4 kHz and for the A-ACC at the other frequencies. Each threshold is expressed here as a Weber fraction: the width of the threshold frequency step divided by the center frequency. In Fig. 7, the x’s show the Weber fraction calculated for each cat in our experiment, and the lines indicate mean behavioral data from published reports; the two ^’s indicate instances in the present study in which d′ failed to reach the criterion of 1.0 at the greatest tested frequency step. Our results are in good agreement with those reported in most of the behavioral experiments, particularly at 8 kHz, where we observed minimal differences with the values reported by Elliott et al. (1960), Igarashi et al. (1979b), and Butler et al. (1957).
Fig. 7.

Weber fraction calculated in our study for each cat (x’s) plotted along with the mean values obtained from previous behavioral studies in cats (filled symbols and lines). Note that Igarashi et al. (1979a) tested only 8 kHz. The solid black line connects the median of the present data at each frequency tested. The circumflex accent symbol was used for the Weber fraction of the cats in which d′ did not reach criterion
Onset Response
Measurements of the ACC excluded the first sweep of each block of 301 sweeps, thereby excluding the onset response from the analysis. For that reason, onset responses were characterized in a separate set of measurements using 500-ms tone bursts followed by 500 ms of silence for each of the four center frequencies, all tested at 75 dB (Fig. 8). Latencies measured in response to stimulus onsets averaged 22.6 and 61.5 ms for P1 and N1 in the ipsilateral hemisphere and 24.3 and 65.7 ms for P1 and N1 in the contralateral hemisphere. Peak-to-peak amplitudes measured in response to stimulus onsets averaged 12.9 μV in the ipsilateral hemisphere and 16.6 μV in the contralateral hemisphere. No significant differences in latency (Wilcoxon signed-rank test, p values = 0.31, 0.75, 0.69, and 0.63 for P1 latencies at 2, 4, 8, and 16 kHz, respectively, and p values = 0.312, 0.63, 1.0, and 0.188 for N1 latencies at 2, 4, 8, and 16 kHz respectively) or amplitude (Wilcoxon signed-rank test, p values = 0.19, 0.63, 0.13, and 0.063 at 2, 4, 8, and 16 kHz, respectively) were found between the two hemispheres. Responses to the offset of the tone bursts (i.e., after 500 ms) also were evident. Latencies and amplitudes of the offset response measured from the ipsilateral (27.0 ms re tone offset at 500 ms and 8.61 μV, respectively) and the contralateral (26.8 ms and 8.76 μV) hemispheres were not significantly different (Wilcoxon signed-rank test, p values = 0.88, 0.81, 1.0, and 0.32 for P1 latencies at 2, 4, 8, and 16 kHz, respectively, and p values = 0.88, 0.82, 1.0, and 0.31 for P1 latencies at 2, 4, 8, and 16 kHz, respectively, and p values = 0.63, 0.81, 0.13, and 0.63 for N1 latencies at 2, 4, 8, and 16 kHz, respectively; p values = 1.0, 1.0, 0.81 and 1.0 at 2, 4, 8 and 16 kHz respectively for A-ACC).
Fig. 8.
Onset and offset responses elicited from each cat at each of the four center frequencies tested. No significant differences in magnitudes or latencies were seen across hemispheres. Magnitudes and latencies of onset-response peaks were not significantly different from those for ACC peaks
The ACCs recorded in response to the largest frequency steps were comparable in magnitude and latency to the onsets of tones at corresponding center frequencies and levels. The latencies of P1 and P1′ of the ACC recorded under the largest frequency step tested (0.07 octaves) were not significantly different from P1 of the onset response (Wilcoxon signed-rank test, p values = 0.63, 0.063, 0.81, and 0.063 for P1 at 2, 4, 8, and 16 kHz, respectively, and p values = 0.063, 0.063, 1.0, and 0.063 for P1′ at 2, 4, 8, and 16 kHz, respectively, for the ipsilateral hemisphere and p values = 0.063, 0.31, 0.63, and 0.32 for P1 at 2, 4, 8, and 16 kHz, respectively, and p values = 0.13, 0.31, 0.44, and 1.0 for P1′ at 2, 4, 8, and 16 kHz, respectively, for the contralateral hemisphere), nor were latencies of N1 and N1′ of the ACC recorded under the largest frequency step significantly different from N1 of the onset response (Wilcoxon signed-rank test, p values = 0.44, 0.44, 1.0, and 0.44 for N1 at 2, 4, 8, and 16 kHz, respectively, and p values = 0.063, 0.31, 0.63, and 0.31 for N1′ at 2, 4, 8, and 16 kHz, respectively, for the ipsilateral hemisphere and p values = 0.63, 0.25, 1.0, and 1.0 for N1 at 2, 4, 8, and 16 kHz, respectively, and p values = 0.31, 1.0, 1.0, and 1.0 for N1′ at 2, 4, 8, and 16 kHz, respectively, for the contralateral hemisphere). Similarly, peak-to-peak amplitudes were not significantly different between the ACCs and the onset responses (Wilcoxon signed-rank test, p values = 0.063, 0.63, 0.81, and 0.19 for D-ACC at 2, 4, 8, and 16 kHz, respectively, and p values = 0.31, 0.13, 1.0, and 0.31 at 2, 4, 8, and 16 kHz for A-ACC, respectively, in the ipsilateral hemisphere and p values = 0.063, 0.63, and 0.063 for D-ACC at 2, 4, 8, and 16 kHz, respectively, and p values = 0.81, 0.63, 1.0, and 0.13 for A-ACC at 2, 4, 8, and 16 kHz, respectively, in the contralateral hemisphere).
Level Discrimination
The ACC responses to changes in sound level were tested with increments and decrements in level centered on a decibel scale around 75 dB SPL (Table 2). The grand averages of the five cats tested for all the level steps are shown in Fig. 9. Upper and lower rows of panels show responses to 4 and 8 kHz tones, respectively. Responses from each individual cat are displayed in Fig. 10. Analogously to what was seen in the frequency discrimination experiment, a downward level step elicited a D-ACC consisting of a P1-N1 complex in the 10- to 100-ms epoch, and an upward level step elicited an A-ACC consisting of a P1′-N1′ complex in the 510- to 600-ms epoch. Additionally and again similarly to what was observed in the frequency discrimination experiment, the positive peak following N1 and N1′ was unreliable and was omitted from the analysis. The ACC amplitudes tended to grow with increases in the magnitude of the level step. Amplitudes were consistently greater in the contralateral than in the ipsilateral hemisphere at both frequencies tested (Wilcoxon signed-rank test, p values = 0.034, 0.039, 0.0039, and < 1 * 10−6 at 2, 4, 8, and 16 kHz, respectively, after correcting for multiple comparisons), and in both hemispheres, A-ACCs were consistently greater than D-ACCs at both frequencies tested (Wilcoxon signed-rank test, p values = 0.00505 and 0.00032 at 4 and 8 kHz, respectively, in the ipsilateral hemisphere and p values = 0.00041 and p < 1 * 10−6 at 4 and 8 kHz, respectively, in the contralateral hemisphere after correcting for multiple comparisons). That the A-ACC was greater than for the D-ACC for a level step in the 4-kHz tone was noteworthy in that it was the D-ACC that most often was greater in the case of a frequency step centered on 4 kHz.
Fig. 9.
Grand average of the response for all the level steps tested re 75 dB SPL. Step 0 represents the baseline, a tone presented continuously at a constant level. Left and right columns show waveforms recorded from the right (ipsilateral) and left (contralateral) hemispheres, respectively, and upper and lower rows show responses to level steps at constant frequencies of 4 and 8 kHz, respectively
Fig. 10.
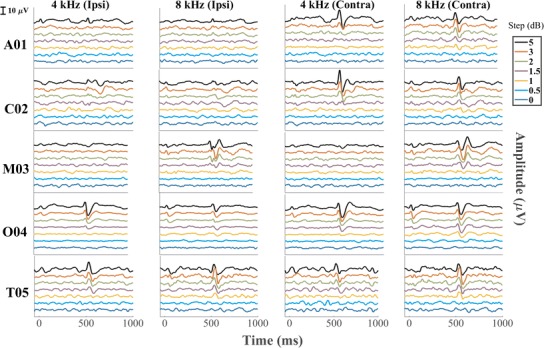
ACC recorded from each individual cat tested across all the level steps from the electrode placed both ipsilateral and contralateral re to the ear stimulated
Peak-to-peak amplitudes of ACCs recorded in the contralateral hemisphere for individual cats are shown in Fig. 11. Consistent with the grand averages and the individual data shown in Figs. 9 and 10, ACC amplitudes were greater for the A-ACC than for the D-ACC at both frequencies (Wilcoxon signed-rank test, p values = 0.00041 and p < 1 * 10−6 at 4 and 8 kHz, respectively). The A-ACC at 4 kHz grew monotonically with increasing level step in all cats across the range of steps that was tested (Friedman test, χ2 = 23, p = 0.00001) whereas the A-ACC at 8 kHz peaked at a step of 3 dB for cats A01, M03, and T05. Cat M03’s amplitude response was weak and the P1′-N1′ peaks were visible only at the 5-dB level change, as seen in Fig. 10.
Fig. 11.
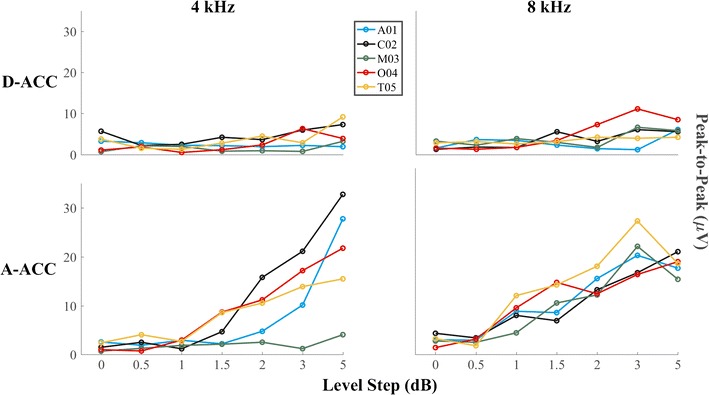
Peak-to-peak amplitude of the response recorded from the hemisphere contralateral to the ear stimulated for all the level steps tested for each of the five cats tested. Top and bottom rows show amplitudes of D-ACC and A-ACC, respectively
Figure 12 shows the peak latency for the D-ACC and A-ACC. Latencies for the smallest level steps varied widely among cats, but tended to converge to a restricted range for the largest steps. Mean latencies for the largest level step, averaged across 4 and 8 kHz, were 26.3 ms for P1, 65.6 ms for N1, 25.7 ms for P1′, and 65 ms for N1′. Latencies tended to vary widely among cats and among magnitudes of frequency steps. In some cases (e.g., 8 kHz, P1; 4 kHz, N1′), latencies for the widest frequency steps tended to converge around a mean value, whereas in other cases, there was considerable variation among cats even at the highest level (e.g., 8 kHz, P1′).
Fig. 12.

Latencies of waveform peaks recorded from the hemisphere contralateral to the ear stimulated for all the level steps tested re 75 dB SPL for each of the five cats. The top row shows the results of the D-ACC, while the bottom one shows the results of the A-ACC. Latencies tend to converge to a restricted value as the magnitude of the response gets stronger (wider frequency step)
The values of d′ for level discrimination by the ACCs in the contralateral hemisphere in each cat are shown in Fig. 13. In most cases, d′ for the D-ACC failed to reach the threshold criterion of d′ = 1 across the range of level steps that was tested. The plots of d′ for the A-ACC, in contrast, crossed the criterion line in every case, with the exception of cat M03 at 4 kHz. The d′ for A-ACC was significantly greater than the d′ for D-ACC for both frequencies tested (Wilcoxon signed-ranks, all p values < 1 * 10−6 at both 4 and 8 kHz). The median level-step thresholds across the cats at 4 and 8 kHz were 2.6 and 1.5 dB, respectively, which was not a significant difference (Wilcoxon signed-ranks, Z = − 1.8, p = 0.13). These threshold values are consistent with the psychophysical thresholds reported by Elliott and McGee (1965): average values in the range of 1.5 to 3.5 dB at 4 and 8 kHz. Igarashi et al. (1979a) reported a somewhat higher average level discrimination of 3.64 dB at 10 kHz.
Fig. 13.
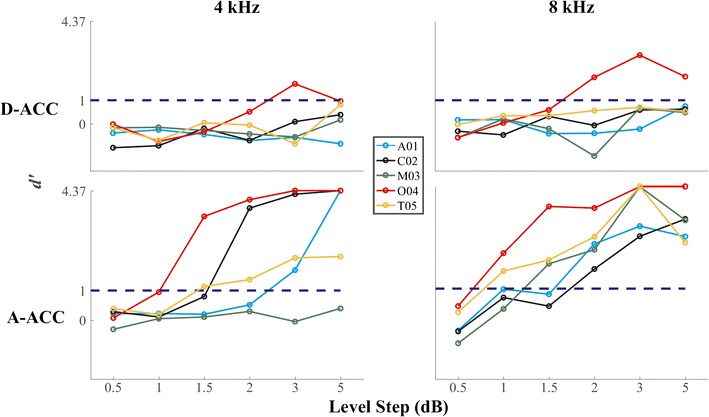
d′ of the responses to level steps recorded from the left (contralateral) hemisphere. Top and bottom rows show d′ for D-ACC and A-ACC, respectively. Left and right columns show values obtained with frequencies of 4 and 8 kHz, respectively. The blue dashed line represents the criterion for threshold
Effect of Isoflurane on ACC
Isoflurane was tested as an example of a general anesthetic that might be used for invasive surgical procedures. The isoflurane was administered for inhalation at concentrations of 1.5 and 2.0 % in oxygen; no ketamine was present in those sessions. We attempted to record the ACC in two cats (A01 and O04) at a frequency step of 0.07 octaves around a center frequency of 8 kHz; that is the largest step that was tested in other sessions using sedation with ketamine and acepromazine. Figure 14 shows the waveform recorded with isoflurane vs waveforms recorded with the mixture of ketamine and acepromazine. No ACC could be recorded at an isoflurane level of 2 % in either cat or at a level of 1.5 % in cat O04; 1.5 % isoflurane did not provide adequate sedation for cat A01.
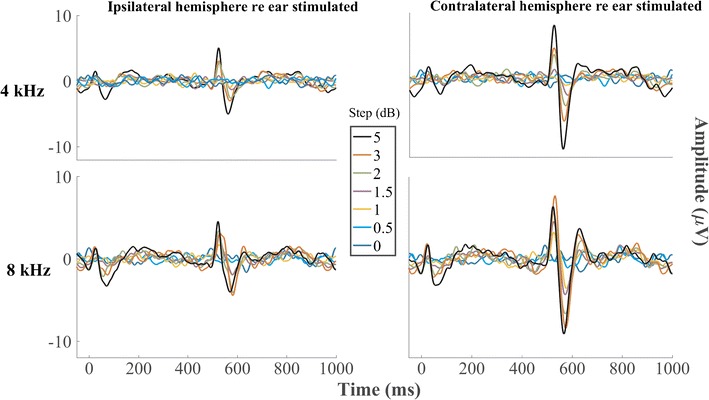
Fig. 14.
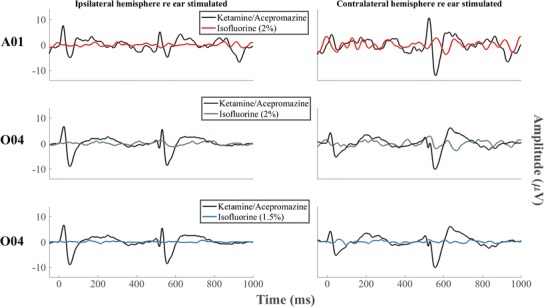
Waveforms recorded with isoflurane vs the ones recorded with the mixture of ketamine and acepromazine at the frequency step of 0.07 octaves around a center frequency of 8 kHz. A clearly discernable ACC could not be recorded in either cat when isoflurane was used
DISCUSSION
The results of this study demonstrate the feasibility of recording ACC from sedated cats. Thresholds for discrimination of the frequency and level of tones are in the range of published cat psychophysical thresholds, raising the possibility that the ACC could be used as an objective surrogate measure for perceptual tasks. The availability of an animal model for stimulus acuity will be useful for experimental models involving manipulation of an animal’s history of hearing and deafness and for development of novel modes of stimulation that are not yet feasible for humans.
ACC in Sedated Cats Vs Awake Humans
We observed many similarities, and some differences, between the ACCs elicited in sedated cats and previously published reports of ACCs in awake humans. The two major peaks that we observed in sedated cats in the D-ACC (P1 and N1) and in the A-ACC (P1′ and N1′) epochs occurred substantially earlier than the analogous peaks in human ACCs (Chen & Small, 2015; Martin & Boothroyd, 2000; Martin, Boothroyd, Ali, & Leach-Berth, 2010). Latencies for P1/P1′ and N1/N1′ in our cat data were around 24–29 and 66–67 ms, respectively, compared to ~ 50 and ~ 100 ms for P1 and N1 in humans. The shorter latencies in the cat might reflect the generally smaller dimensions of the cat brain compared to the human brain and/or the shorter intracranial portion of the cat’s auditory nerve, which is about a tenth of that of the human (Moller et al., 1988). The ACCs recorded in humans generally showed a fairly robust wave, P2, following N1 (Kohn et al., 1978; Martin and Boothroyd, 2000; Dimitrijevic et al., 2008; Martin et al., 2010). The presumptive P2 in sedated cats, when present, tended to be small and inconsistent compared to P1 and N1. The relative weakness of P2 in our data might represent a differential suppressive effect of anesthesia on longer-latency auditory responses (Thornton et al., 1983; Savoia et al., 1988; Haenggi et al., 2004). Cats and humans both show increases in ACC amplitudes with increasing widths of frequency steps. In humans, ACCs have been reported for frequency steps in continuous tones as narrow as 1 % (0.014 oct) (Arlinger et al., 1976), although most studies have tested only wider steps. Threshold frequency steps were as narrow as 0.02 oct in our data set from sedated cats.
We observed some variation in the relative amplitudes of responses to ascending and descending frequency steps. In most instances ACCs were stronger in response to upward frequency steps around 2 and 8 kHz and stronger for downward steps around 4 kHz, but there was considerable variation among cats. At 16 kHz, we could not see a clear preference for either direction. The ACCs reported in human studies do not show a consistent preference for downward vs upward frequency steps (Arlinger et al., 1976; Kohn et al., 1978; Arlinger and Jerlvall, 1979; Martin et al., 2010); Tietze and Afontshenko (1978) showed a slight (4 %) preference for the upward frequency steps. Our tests of level steps showed a consistent preference for upward compared to downward steps. That agrees with the reported sensitivity to level steps in humans by Martin and Boothroyd (2000).
The ACC elicited by frequency steps in the present study was most robust for steps around 8 kHz. That was evident in terms of generally highest ACC amplitudes (Fig. 3), most consistently high d′ (Fig. 5), and lowest thresholds (Fig. 6). Moreover, of the two frequencies at which we tested level discrimination, the ACC was stronger at 8 kHz than at 4 kHz. The amplitude and reliability of the ACC declined at 16 kHz. We might have seen a stronger ACC at 16 kHz had we tested larger frequency steps. The largest steps that we tested were 0.07 oct, equivalent to a 5 % change in frequency. For comparison, studies of ACCs elicited by frequency steps in humans tested steps as large as 50 % or greater (Arlinger et al., 1976; Kohn et al., 1978; Tietze and Afontshenko, 1978; Dimitrijevic et al., 2008; Dimitrijevic et al., 2011).We recorded fairly robust ACCs for center frequencies as low as 2 kHz, although at that frequency, the ACC was seen only in the A-ACC epoch, not in the D-ACC epoch. We have no compelling explanation for the finding of the most robust ACC around 8 kHz. We note that the most sensitive point in the cat’s behavioral audiogram is around 8 kHz, although most reported cat audiograms vary over little more than 10 dB across the entire 2-to-16-kHz range of center frequencies in which we tested frequency and level discrimination (Neff and Hind, 1955; Elliott et al., 1960; Sokolovski, 1973; Heffner and Heffner, 1985). Our 75-dB-SPL sound fields were well above audibility thresholds at any tested frequency. In humans, most studies of ACCs elicited by frequency steps have tested only a single or a limited range of base frequencies between 0.2 and 1.5 kHz (Kohn et al., 1978; Tietze and Afontshenko, 1978; Yingling and Nethercut, 1983; He et al., 2012). Dimitrijevic et al. (2008) noted a preference for a base frequency of 0.25 compared to 4 kHz, and Arlinger et al. (1976) recorded greater ACC amplitudes for base frequencies of 0.5 to 2 kHz than for 0.25 or 4 kHz. The ACC responses in sedated cats were consistently stronger in the contralateral compared to the ipsilateral hemisphere (Fig. 2). That observation accords with the contralateral preference of the majority of neurons studied in single-unit studies in the cat (Hall and Goldstein Jr, 1968; Stecker et al., 2005) and in scalp-recorded activity in humans (Pantev et al., 1986; Ross et al., 2005; Hine and Debener, 2007).
ACC and Perceptual Thresholds
The thresholds for frequency and level discrimination by the ACC fell in the range of perceptual thresholds found in previously reported psychophysical studies in cats (Butler et al., 1957; Elliott et al., 1960; Elliott and McGee, 1965; Igarashi et al., 1979a; Igarashi et al., 1979b; Hienz et al., 1993; Brown et al., 2004). The psychophysical thresholds, and our ACC thresholds, show a broad range. Some of the differences among the cat psychophysical thresholds are associated with differences in experimental design, in that studies that employed shock avoidance (Elliott et al. (1960); Igarashi et al. (1979b). Butler et al. (1957) yielded generally lower thresholds than those that used positive reinforcement with food reward (Brown et al. (2004); Hienz et al. (1993)); our lowest thresholds tend to approximate the shock-avoidance psychophysical thresholds. The generally good correspondence of cat psychophysical and ACC thresholds suggests that ACCs might provide a useful supplement or surrogate measure for challenging cat behavioral studies. A further validation of the perceptual relevance of the ACC will come from studies in which ACC and psychophysical thresholds can be studied in the same individual cats.
Choice of Anesthetic
One of the main motivations of the present study was to test whether the ACC could be recorded under conditions of sedation. In humans, the amplitudes of auditory middle- and late-latency responses can be partially or completely suppressed by anesthetic agents (Thornton et al., 1983; Savoia et al., 1988; Haenggi et al., 2004). In most animal models, we would expect to need at least a light level of sedation to suppress movements. We cannot claim that the present study evaluated anesthetics exhaustively, but the two anesthetic regimes that we tested span a range from light sedation to full general anesthesia, and they exhibited markedly different effects on the ACC.
We tested a cocktail of ketamine and acepromazine because we have experience with those agents in cats and know that they can produce sedation adequate for scalp recordings. We were pleased to record robust ACC using sedation with ketamine and acepromazine. In particular, many of the ACC thresholds that we recorded were as low as the lowest perceptual thresholds, suggesting that ketamine/acepromazine sedation does not elevate thresholds. We tested isoflurane because we know that it produces anesthesia adequate for invasive surgical procedures, such as implantation of cochlear stimulating electrodes. We failed to record ACC while animals were anesthetized with isoflurane. It remains to be seen whether the ACC can be recording under some other anesthetic agent that would provide sufficient analgesia, muscle relaxation, and loss of consciousness sufficient for invasive procedures.
Acknowledgements
This work was supported by the National Institute on Deafness and Other Communication Disorders grants R01 DC000420 (to JCM) and T32 DC010775 (to AP). We thank Elizabeth A. McGuire and Zekiye Onsan for their technical and administrative assistance.
References
- Arlinger SD, Jerlvall LB (1979) Results of psychoacoustic and cortical evoked potential experiments using frequency and amplitude modulated stimuli. Scand Audiol Suppl: 229–239 [PubMed]
- Arlinger SD, Jerlvall LB, Ahren T, Holmgren EC. Slow evoked cortical responses to linear frequency ramps of a continuous pure tone. Acta Physiol Scand. 1976;98:412–424. doi: 10.1111/j.1748-1716.1976.tb10330.x. [DOI] [PubMed] [Google Scholar]
- Benjamini Y, Hochberg Y. Controlling the false discovery rate: a practical and powerful approach to multiple testing. J R Stat Soc Ser B Methodol. 1995;57:289–300. [Google Scholar]
- Brown CJ, Etler C, He S, O’Brien S, Erenberg S, Kim J-R, Dhuldhoya AN, Abbas PJ. The electrically evoked auditory change complex: preliminary results from nucleus cochlear implant users. Ear Hear. 2008;29:704–717. doi: 10.1097/AUD.0b013e31817a98af. [DOI] [PMC free article] [PubMed] [Google Scholar]
- Brown M, Irvine DR, Park VN. Perceptual learning on an auditory frequency discrimination task by cats: association with changes in primary auditory cortex. Cereb Cortex. 2004;14:952–965. doi: 10.1093/cercor/bhh056. [DOI] [PubMed] [Google Scholar]
- Butler RA, Diamond IT, Neff WD. Role of auditory cortex in discrimination of changes in frequency. J Neurophysiol. 1957;20:108–120. doi: 10.1152/jn.1957.20.1.108. [DOI] [PubMed] [Google Scholar]
- Chen KH, Small SA. Elicitation of the acoustic change complex to long-duration speech stimuli in four-month-old infants. Int J Otolaryngol. 2015;2015:562030. doi: 10.1155/2015/562030. [DOI] [PMC free article] [PubMed] [Google Scholar]
- Dimitrijevic A, Michalewski HJ, Zeng F-G, Pratt H, Starr A. Frequency changes in a continuous tone: auditory cortical potentials. Clin Neurophysiol. 2008;119:2111–2124. doi: 10.1016/j.clinph.2008.06.002. [DOI] [PMC free article] [PubMed] [Google Scholar]
- Dimitrijevic A, Lolli B, Michalewski HJ, Pratt H, Zeng F-G, Starr A. Intensity changes in a continuous tone: auditory cortical potentials comparison with frequency changes. Clin Neurophysiol. 2009;120:374–383. doi: 10.1016/j.clinph.2008.11.009. [DOI] [PubMed] [Google Scholar]
- Dimitrijevic A, Starr A, Bhatt S, Michalewski HJ, Zeng FG, Pratt H. Auditory cortical N100 in pre- and post-synaptic auditory neuropathy to frequency or intensity changes of continuous tones. Clin Neurophysiol. 2011;122:594–604. doi: 10.1016/j.clinph.2010.08.005. [DOI] [PMC free article] [PubMed] [Google Scholar]
- Efron B, Tibshirani R. Statistical data analysis in the computer age. Science. 1991;253:390–395. doi: 10.1126/science.253.5018.390. [DOI] [PubMed] [Google Scholar]
- Elliott DN, McGee TM. Effect of cochlear lesions upon audiograms and intensity discrimination in cats. Ann Otol Rhinol Laryngol. 1965;74:386–408. doi: 10.1177/000348946507400209. [DOI] [PubMed] [Google Scholar]
- Elliott DN, Stein L, Harrison MJ. Determination of absolute-intensity thresholds and frequency-difference thresholds in cats. J Acoust Soc Am. 1960;32:380–384. [Google Scholar]
- Green DM, Swets JA. Signal detection theory and psychophysics. New York, NY: John Wiley & Sons, Inc; 1966. [Google Scholar]
- Haenggi M, Ypparila H, Takala J, Korhonen I, Luginbuhl M, Petersen-Felix S, Jakob SM. Measuring depth of sedation with auditory evoked potentials during controlled infusion of propofol and remifentanil in healthy volunteers. Anesth Analg. 2004;99:1728–1736. doi: 10.1213/01.ANE.0000135634.46493.0A. [DOI] [PubMed] [Google Scholar]
- Hall JL, Goldstein Jr MH. Representation of binaural stimuli by single units in primary auditory cortex of unanesthetized cats. J Acoust Soc Am. 1968;43:456–461. doi: 10.1121/1.1910852. [DOI] [PubMed] [Google Scholar]
- Han JH, Dimitrijevic A. Acoustic change responses to amplitude modulation: a method to quantify cortical temporal processing and hemispheric asymmetry. Front Neurosci. 2015;9:38. doi: 10.3389/fnins.2015.00038. [DOI] [PMC free article] [PubMed] [Google Scholar]
- Harris KC, Mills JH, Dubno JR. Electrophysiologic correlates of intensity discrimination in cortical evoked potentials of younger and older adults. Hear Res. 2007;228:58–68. doi: 10.1016/j.heares.2007.01.021. [DOI] [PMC free article] [PubMed] [Google Scholar]
- He S, Grose JH, Buchman CA. Auditory discrimination: the relationship between psychophysical and electrophysiological measures. Int J Audiol. 2012;51:771–782. doi: 10.3109/14992027.2012.699198. [DOI] [PMC free article] [PubMed] [Google Scholar]
- Heffner RS, Heffner HE. Hearing range of the domestic cat. Hear Res. 1985;19:85–88. doi: 10.1016/0378-5955(85)90100-5. [DOI] [PubMed] [Google Scholar]
- Hienz RD, Sachs MB, Aleszczyk CM. Frequency discrimination in noise: comparison of cat performances with auditory-nerve models. J Acoust Soc Am. 1993;93:462–469. doi: 10.1121/1.405626. [DOI] [PubMed] [Google Scholar]
- Hine J, Debener S. Late auditory evoked potentials asymmetry revisited. Clin Neurophysiol. 2007;118:1274–1285. doi: 10.1016/j.clinph.2007.03.012. [DOI] [PubMed] [Google Scholar]
- Igarashi M, Cranford JL, Allen EA, Alford BR. Behavioral auditory function after transection of crossed olivo-cochlear bundle in the cat. V. Pure-tone intensity discrimination. Acta Otolaryngol. 1979;87:429–433. doi: 10.3109/00016487909126446. [DOI] [PubMed] [Google Scholar]
- Igarashi M, Cranford JL, Nakai Y, Alford BR. Behavioral auditory function after transection of crossed olivo-cochlear bundle in the cat. IV. Study on pure-tone frequency discrimination. Acta Otolaryngol. 1979;87:79–83. doi: 10.3109/00016487909126390. [DOI] [PubMed] [Google Scholar]
- Kohn M, Lifshitz K, Litchfield D. Averaged evoked potentials and frequency modulation. Electroencephalogr Clin Neurophysiol. 1978;45:236–243. doi: 10.1016/0013-4694(78)90007-x. [DOI] [PubMed] [Google Scholar]
- Macmillan NA, Kaplan HL. Detection theory analysis of group data: estimating sensitivity from average hit and false-alarm rates. Psychol Bull. 1985;98:185–199. [PubMed] [Google Scholar]
- Macmillan NA, Creelman CD. Detection theory: a user’s guide. 2. Mahwah, New Jersey: Lawrence Erlbaum Associates; 2005. [Google Scholar]
- Martin BA. Can the acoustic change complex be recorded in an individual with a cochlear implant? Separating neural responses from cochlear implant artifact. J Am Acad Audiol. 2007;18:126–140. doi: 10.3766/jaaa.18.2.5. [DOI] [PubMed] [Google Scholar]
- Martin BA, Boothroyd A. Cortical, auditory, event-related potentials in response to periodic and aperiodic stimuli with the same spectral envelope. Ear Hear. 1999;20:33–44. doi: 10.1097/00003446-199902000-00004. [DOI] [PubMed] [Google Scholar]
- Martin BA, Boothroyd A. Cortical, auditory, evoked potentials in response to changes of spectrum and amplitude. J Acoust Soc Am. 2000;107:2155–2161. doi: 10.1121/1.428556. [DOI] [PubMed] [Google Scholar]
- Martin BA, Boothroyd A, Ali D, Leach-Berth T. Stimulus presentation strategies for eliciting the acoustic change complex: increasing efficiency. Ear Hear. 2010;31:356–366. doi: 10.1097/AUD.0b013e3181ce6355. [DOI] [PMC free article] [PubMed] [Google Scholar]
- Martinez AS, Eisenberg LS, Boothroyd A. The acoustic change complex in young children with hearing loss: a preliminary study. Semin Hear. 2013;34:278–287. doi: 10.1055/s-0033-1356640. [DOI] [PMC free article] [PubMed] [Google Scholar]
- Middlebrooks JC, Snyder RL. Auditory prosthesis with a penetrating nerve array. J Assoc Res Otolaryngol. 2007;8:258–279. doi: 10.1007/s10162-007-0070-2. [DOI] [PMC free article] [PubMed] [Google Scholar]
- Middlebrooks JC, Snyder RL. Intraneural stimulation for auditory prosthesis: modiolar trunk and intracranial stimulation sites. Hear Res. 2008;242:52–63. doi: 10.1016/j.heares.2008.04.001. [DOI] [PubMed] [Google Scholar]
- Middlebrooks JC, Snyder RL. Selective electrical stimulation of the auditory nerve activates a pathway specialized for high temporal acuity. J Neurosci. 2010;30:1937–1946. doi: 10.1523/JNEUROSCI.4949-09.2010. [DOI] [PMC free article] [PubMed] [Google Scholar]
- Moller AR, Jannetta PJ, Sekhar LN. Contributions from the auditory nerve to the brain-stem auditory evoked potentials (BAEPs): results of intracranial recording in man. Electroencephalogr Clin Neurophysiol. 1988;71:198–211. doi: 10.1016/0168-5597(88)90005-6. [DOI] [PubMed] [Google Scholar]
- Näätänen R, Gaillard AWK, Mäntysalo S. Early selective-attention effect on evoked potential reinterpreted. Acta Psychol. 1978;42:313–329. doi: 10.1016/0001-6918(78)90006-9. [DOI] [PubMed] [Google Scholar]
- Neff WD, Hind JE. Auditory thresholds of the cat. J Acoust Soc Am. 1955;27:480–483. [Google Scholar]
- Nelken I, Ulanovsky N. Mismatch negativity and stimulus-specific adaptation in animal models. J Psychophysiol. 2007;21:214–223. [Google Scholar]
- Pantev C, Lutkenhoner B, Hoke M, Lehnertz K. Comparison between simultaneously recorded auditory-evoked magnetic fields and potentials elicited by ipsilateral, contralateral and binaural tone burst stimulation. Audiology. 1986;25:54–61. doi: 10.3109/00206098609078369. [DOI] [PubMed] [Google Scholar]
- Ross B, Herdman AT, Pantev C. Right hemispheric laterality of human 40 Hz auditory steady-state responses. Cereb Cortex. 2005;15:2029–2039. doi: 10.1093/cercor/bhi078. [DOI] [PubMed] [Google Scholar]
- Savoia G, Esposito C, Belfiore F, Amantea B, Cuocolo R. Propofol infusion and auditory evoked potentials. Anaesthesia. 1988;43(Suppl):46–49. doi: 10.1111/j.1365-2044.1988.tb09069.x. [DOI] [PubMed] [Google Scholar]
- Scheperle RA, Abbas PJ. Peripheral and central contributions to cortical responses in cochlear implant users. Ear Hear. 2015;36:430–440. doi: 10.1097/AUD.0000000000000143. [DOI] [PMC free article] [PubMed] [Google Scholar]
- Sokolovski A. Normal threshold of hearing for cat for free-field listening. Arch Klin Exp Ohren Nasen Kehlkopfheilkd. 1973;203:232–240. doi: 10.1007/BF00344934. [DOI] [PubMed] [Google Scholar]
- Stecker GC, Harrington IA, Middlebrooks JC. Location coding by opponent neural populations in the auditory cortex. PLoS Biol. 2005;3:e78. doi: 10.1371/journal.pbio.0030078. [DOI] [PMC free article] [PubMed] [Google Scholar]
- Thornton C, Catley DM, Jordan C, Lehane JR, Royston D, Jones JG. Enflurane anaesthesia causes graded changes in the brainstem and early cortical auditory evoked response in man. Br J Anaesth. 1983;55:479–486. doi: 10.1093/bja/55.6.479. [DOI] [PubMed] [Google Scholar]
- Tietze G, Afontshenko V. The acoustically evoked potentials in the case of stimulation by frequency modulation (FM) near the hearing threshold, compared with tone burst stimulation. Scand Audiol. 1978;7:33–38. doi: 10.3109/01050397809043129. [DOI] [PubMed] [Google Scholar]
- Yingling CD, Nethercut GE. Evoked responses to frequency shifted tones: tonotopic and contextual determinants. Int J Neurosci. 1983;22:107–118. doi: 10.3109/00207459308987389. [DOI] [PubMed] [Google Scholar]