

Abstract
There currently are no standardized protocols to evaluate auditory efferent function in humans. Typical tests use broadband noise to activate the efferents, but only test the contralateral efferent pathway, risk activating the middle ear muscle reflex (MEMR), and are laborious for clinical use. In an attempt to develop a clinical test of bilateral auditory efferent function, we have designed a method that uses clicks to evoke efferent activity, obtain click-evoked otoacoustic emissions (CEOAEs), and monitor MEMR. This allows for near-simultaneous estimation of cochlear and efferent function. In the present study, we manipulated click level (60, 70, and 80 dB peak-equivalent sound pressure level [peSPL]) and rate (40, 50, and 62.5 Hz) to identify an optimal rate-level combination that evokes measurable efferent modulation of CEOAEs. Our findings (n = 58) demonstrate that almost all click levels and rates used caused significant inhibition of CEOAEs, with a significant interaction between level and rate effects. Predictably, bilateral activation produced greater inhibition compared to stimulating the efferents only in the ipsilateral or contralateral ear. In examining the click rate-level effects during bilateral activation in greater detail, we observed a 1-dB inhibition of CEOAE level for each 10-dB increase in click level, with rate held constant at 62.5 Hz. Similarly, a 10-Hz increase in rate produced a 0.74-dB reduction in CEOAE level, with click level held constant at 80 dB peSPL. The effect size (Cohen’s d) was small for either monaural condition and medium for bilateral, faster-rate, and higher-level conditions. We were also able to reliably extract CEOAEs from efferent eliciting clicks. We conclude that clicks can indeed be profitably employed to simultaneously evaluate cochlear health using CEOAEs as well as their efferent modulation. Furthermore, using bilateral clicks allows the evaluation of both the crossed and uncrossed elements of the auditory efferent nervous system, while yielding larger, more discernible, inhibition of the CEOAEs relative to either ipsilateral or contralateral condition.
Keywords: middle ear muscle reflex, efferents, CEOAE, medial olivocochlear reflex
Introduction
Click-evoked otoacoustic emissions (CEOAEs) are a popular tool for estimating cochlear function. Due to their relatively broad spectrum, CEOAEs are capable of sampling cochlear activity across a wide range of frequencies in a relatively short duration with a reasonable repeatability (Mertes and Goodman 2015; Mishra and Lutman 2013). These same conveniences make CEOAEs a viable candidate for assaying auditory efferent activity. Understanding auditory efferent activity is important considering the efferents influence auditory processing across the entire auditory pathway, especially the cochlea. A typical CEOAE-based efferent paradigm involves monitoring cochlear activity in one ear while evoking efferent activity using broadband noise through the contralateral ear. However, the short-duration (typically tens of microseconds) clicks used to record CEOAEs require that they be presented at relatively high stimulus levels (e.g., 80 dB peak-equivalent sound pressure level [peSPL]), leading to the possibility that the clicks themselves evoking efferent activity, and in some instances the middle ear muscle reflex (MEMR; Boothalingam and Purcell 2015; Guinan et al. 2003). Here, we turn this possibility into an opportunity and judiciously use clicks to elicit both CEOAEs and efferent activity in-lieu of the usual broadband noise stimulation. This near-simultaneous estimation of cochlear and efferent activity presents an opportunity for a convenient simultaneous test of the click generation mechanisms and the auditory efferent system. As the first step, in the present study, we investigated optimal click parameters (rate and level) that allow for simultaneous measurement of CEOAEs and their efferent modulation, while avoiding MEMR. This is a necessary step as the optimal properties of the click elicitors are not known compared to that of the commonly used broadband noise elicitors.
The auditory efferents are implicated in several essential auditory functions and are thought to be affected in several auditory and developmental pathologies. Yet, a standardized test of auditory efferent function does not currently exist. Auditory efferents fine-tune bottom-up signal encoding by adaptively adjusting the gain in the system. Animal models suggest that the efferents aid several auditory processes that range from unmasking transient signals in noisy backgrounds (Winslow and Sachs 1987) to protecting outer hair cells (OHCs) against acoustic trauma (Liberman et al. 2014; Maison and Liberman 2000; Maison et al. 2013) and mediating selective attention to the auditory periphery (Delano et al. 2007). In humans, non-invasive techniques, such as OAEs, are typically used to assay efferent activity. In particular, change in OAE magnitude during efferent activation (typically with broadband noise), termed “efferent strength” or “efferent reflex,” is used as an index of efferent function (Collet et al. 1990b; Guinan 2006; Mott et al. 1989). A large range of efferent strength has been reported in humans—from a hyper-functioning efferent system in musicians (Brashears et al. 2003; Perrot and Collet 2013), children with autism (Wilson et al. 2017), and noise-exposed individuals (Bhatt 2017) to compromised functioning in individuals with auditory disorders (Boothalingam et al. 2015; Garinis et al. 2008; Hood et al. 2003; Muchnik et al. 2004). While the physiology of the auditory efferents is fairly well understood through decades of research, their functional relevance is yet to be fully appreciated. Perhaps the lack of a standardized protocol for evaluating efferent strength has hindered the integration of findings to infer their functional relevance to human hearing. Additionally, a standardized clinical test would be of benefit as the auditory efferent system is implicated in certain disorders (e.g., autism). Finally, a reliable test of the auditory efferents may also be useful in predicting vulnerability to noise damage (Bhatt 2017; Liberman et al. 2014; Maison and Liberman 2000; Maison et al. 2013).
Investigators use different methods to assay the auditory efferent system using OAEs. For example, different OAE types, arguably generated by different mechanisms (Shera and Guinan 1999), have been used to examine the auditory efferents. The auditory efferents appear to modulate these differently generated OAEs to different degrees (Deeter et al. 2009). Even when the same OAE type is used to assay the auditory efferents, different levels of OAE evoking stimuli are often used across studies [e.g., Kumar and Vanaja (2004) vs. de Boer et al. (2012) for CEOAEs and Abdala et al. (2014) vs. Kim et al. (2002) for DPOAEs]. Because efferents inhibit OHC amplification, a process that is highly sensitive to stimulus levels (Robles and Ruggero 2001; Robles et al. 1986), variability in OAE stimulus level makes comparisons across studies complicated. Another major complication that many prior studies have overlooked is the potential inadvertent activation of the MEMR by the stimulus meant to selectively activate the efferents (Guinan et al. 2003). When activated, the MEMR restricts low-frequency stimulus transfer through the middle ear causing a reduction in OAE level—an effect similar to that caused by efferent inhibition of OAEs. When not accounted for, MEMR is a major confound in determining a true efferent effect. Here, we use the same clicks that evoke efferents to also monitor MEMR to potentially allow the segregation of efferent and MEMR inhibition of OAEs.
An ideal test of efferents should be able to assay the bilateral as well as the ipsilateral and contralateral efferent network. This is because the medial olivocochlear reflex (MOCR) bundle, the final leg of the efferent pathway, projects to both cochleae via crossed and uncrossed fibers, inhibiting cochlear activity in both ears (Guinan 2006; Rasmussen 1946). However, most investigations of the MOCR monitor OAEs in one ear while evoking efferent activity via the contralateral ear. The sluggish decay time (100–150 ms) of the MOCR has been exploited in a few studies to capture the efferent effect on OAEs bilaterally (Backus and Guinan 2006; Berlin et al. 1995; Boothalingam et al. 2016). Monitoring cochlear activity in this 100–150-ms post-elicitor window allows for estimation of efferent activity, irrespective of the type of stimulus presented to an ear. Here, we used clicks, as opposed to the commonly used broadband noise, to both obtain an estimate of cochlear activity and its modulation by efferents near-simultaneously.
The defining feature of clicks, their short duration, compromises their ability to evoke efferent activity. Clicks evoke smaller efferent inhibition of OAEs compared to broadband noise (Boothalingam and Purcell 2015; Guinan et al. 2003). It is also known, however, that higher-level clicks presented at a faster rate elicit greater efferent activity (Boothalingam and Purcell 2015; Veuillet et al. 1991). In this report, we explore a range of click levels and rates to evoke maximal efferent modulation of CEOAEs while monitoring the MEMR. We hypothesized that an adequate rate-level combination exists that allows the evaluation of efferent function without activating the MEMR.
Methods
Participants
A total of 76 participants in the age range 18–30 years were recruited for the study in compliance with the guidance of the Northwestern University Institutional Review Board, and were compensated monetarily for their participation. All participants had clinically normal hearing and middle ear function confirmed by pure-tone audiometry between 0.25 and 8 kHz (Audio Traveler AA220, Interacoustics, Assens, Denmark) and tympanometry (GSI TympStar, Grason-Stadler Inc., Eden Prairie, MN), respectively. All participants included in the study had MEMR thresholds > 80 dB SPL for clicks presented at 100 Hz, evaluated in the clinical tympanometer. Presence of distortion product OAE (DPOAE) (2f1-f2; f2/f1 = 1.22; L1/L2 = 55/40 dB SPL) with signal-to-noise ratio > 6 dB between 0.5 and 6 kHz was a requirement for participation. Because spontaneous OAEs (SOAEs) have been reported to interfere with CEOAEs, participants with more than five SOAEs that are ∼3 dB above the noise floor during visual examination of the SOAE spectrum in the test ear were excluded from the study. While it would be ideal to exclude participants with any SOAEs, such a requirement would leave very few subjects in the desired age range eligible. Of the total number of participants recruited, 14 were not included in the study due to inadequate DPOAE levels, and 4 due to the presence of too many SOAEs. Of the remaining 58 participants (mean 21.4; standard deviation (SD) 2.8 years, 11 males), 19, 20, and 19 unique, and randomly assigned, participants provided data for the ipsilateral, contralateral, and bilateral conditions, respectively.
Participants sat in a comfortable chair in a sound-attenuated audiometric booth and watched a silent, closed captioned, movie for the duration of the experiment. Participants were encouraged to stay relaxed, not fall asleep, and swallow as few times as comfortably possible. Data were acquired in blocks of 8 min. Following completion of a block, participants were encouraged to stretch and do other noisy activities that they were discouraged from doing during the recording blocks. Two OAE probe assemblies were coupled to the participant’s ears and sealed with earmold putty to secure them in place and prevent slippage/drift during the course of the experiment.
Stimulus Generation and Calibration
CEOAEs were evoked using band-limited (0.8–6 kHz) clicks generated in the frequency domain using a recursive exponential filter (Charaziak and Shera 2015; Shera and Zweig 1993) and inverse Fourier transformed to the time domain. The duration of the click was ∼108 μs. In our pilot studies, clicks generated using this method produced significantly less loudspeaker ringing compared to the traditionally used pulse signals of fixed duration. Clicks were digitally generated in MATLAB (Mathworks, MA) at a sampling rate of 96 kHz and a bit depth of 24. Clicks were calibrated by matching their peak-to-peak amplitude to a 1-kHz reference tone in a Zwislocki coupler to obtain peSPL. Clicks were digitally scaled and the output of the loudspeakers was verified such that the desired sound pressure was generated in the coupler.
Measurement Paradigm
Each stimulation and measurement segment was 2 s in length, segregated into the baseline, elicitor, efferent, and recovery windows (see Fig. 1). The baseline window extended from 0 to 100 ms during which CEOAE in response to the baseline clicks (55 dB peSPL, 20 Hz) were estimated. The elicitor clicks lasted 1 s following the baseline window during which clicks at either 60, 70, or 80 dB peSPL at a click rate of 40, 50, or 62.5 Hz were presented in the ipsilateral, contralateral, or bilateral conditions. After the elicitor window, clicks were replayed at 55 dB peSPL and 20 Hz and the CEOAEs measured over a 100 ms efferent window. A final measurement of CEOAEs in response to 55 dB peSPL clicks at 20 Hz (the recovery window) was obtained over the 100 ms between 1.45 and 1.55 s of the measurement segment, i.e., 300 ms following elicitor click cessation. The measurement segment was repeated 250 times in a block, and two blocks of recordings were obtained for each of the nine possible level/rate combinations of the elicitor clicks. The order of presentation of different level/rate combinations of elicitor clicks was randomized.
Fig. 1.
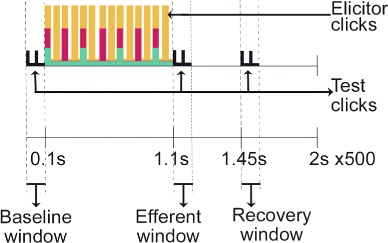
Schematic representation of the measurement paradigm. Four types of clicks are represented using vertical bars of different colors and height. Clicks used to estimate the baseline CEOAE level are represented by the black bars (55 dB peSPL and 20 Hz). Three sets of elicitor clicks differing in level and rate are presented using green, red, and yellow bars. The clicks exhibited in green, red, and yellow were presented at 60, 70, and 80 dB peSPL and using rates of 40, 50, and 62.5 Hz, respectively. CEOAE estimates were obtained in the time windows between vertical dashed lines demarcating baseline, efferent, and recovery windows (see text for details). Note that the figure is not to scale, and elicitor clicks of different rates (colors) are shown as overlapping at some time points for visual clarity.
CEOAE levels were estimated from low-level and slow clicks (55 dB peSPL and 20 Hz) to avoid efferent activation by these clicks (Boothalingam and Purcell 2015). In order to have the option of measuring CEOAEs in response to the elicitor clicks, presentation rates faster than 62.5 Hz were not used. The 62.5-Hz rate results in a nominal 16-ms inter-click interval. However, the effective inter-click interval at this rate of presentation is equivalent to 10 ms after accounting for stimulus, stimulus ringing, and ramping. This was deemed to be the shortest practical window for recovery of CEOAE using the instrumentation described below.
Instrumentation
Signal delivery and acquisition were controlled using a custom suite developed for MATLAB [ARLas; Goodman (2017)] running on an iMac computer (Apple Inc., Cupertino, CA). Digital output from the computer were routed to a digital-to-analog converter (DAC; Fireface UCX, RME, Haimhausen, Germany) via a Firewire connection. Converted analog signals were then fed to a low-noise amplifier (H4C, Etymotic Research, Elk Grove Village, IL) for impedance matching between the DAC and the insert earphones (ER2, Etymotic Research, Elk Grove Village, IL) that delivered the clicks in participants’ ears. One ER2 was coupled to each OAE probe microphone assemblies (ER10B+, Etymotic Research, Elk Grove Village, IL) for contralateral and bilateral conditions. This dual-microphone arrangement allowed for complete recovery of all CEOAEs, including those evoked by elicitor clicks. Since the ER10B+ probe has two sound channels, identical dummy speakers were connected to these spare channels of each probe. The sound pressure registered by the ER10B+ microphones were amplified (+20 dB) by the ER10B+ pre-amplifier before being fed to the RME Fireface UCX for analog-to-digital conversion. The digitized signals were then routed to the computer via Firewire cable for subsequent analyses. All signals were sampled at a rate of 96 kHz.
Signal Processing
All analyses were performed offline in MATLAB using custom scripts. Raw ear canal pressure recordings were band-pass filtered around the click frequency (0.8–6 kHz) using a fourth-order, zero-delay Butterworth filter. Click responses were then subjected to artifact rejection, where clicks with root-mean-square (RMS) amplitude that fell outside the third quartile by more than 2.25 times the interquartile range (specific to the condition) were excluded from further analyses. Typically, less than 10 % of the responses were rejected across participants. Click-stimulus waveforms (0–5 ms) and OAE waveforms (6–15 ms) were separated with 1-ms long on and off Hann ramps to avoid spectral splatter. OAE waveforms were then Fourier transformed to estimate the CEOAE spectral level. The RMS amplitude of the entire click spectrum (0.8–6 kHz) was calculated as the CEOAE response. While previous group data have suggested that the majority of the efferent effects are confined to less than 3 kHz (Lilaonitkul and Guinan 2012; Zhao and Dhar 2012), we included data up to 6 kHz to accommodate participants who may have efferent activity up to 6 kHz. However, it is possible that including the entire frequency spectrum could reduce the total efferent effect at the group level. The standard error of the spectral mean was calculated as the noise floor. This method is based on Goodman et al. (2009), where the mean of ∼1000 signal averages forms the response, and the trial-to-trial variability captured by the standard error of the mean is assumed to be due to various noise sources and thus forms an estimate of the noise floor. Signal-to-noise ratio of responses was greater than 10 dB in all cases. The average CEOAE level in the baseline condition across all participants was 4.13 ± 5.28 dB SPL (± 1 SD), and the average noise level was −30.79 ± 1.18 dB SPL.
Mean CEOAE levels across the three efferent monitoring windows were used to estimate efferent inhibition of CEOAEs. The CEOAE level in the efferent window compared to the baseline window provided the magnitude of the efferent inhibitory effect of the evoking clicks or the efferent strength (ΔCEOAE). Comparison of the CEOAE level in the recovery window with that in the baseline window was used as a reference to ensure that cochlear activity returned to baseline prior to the next stimulus presentation. It should be noted that although we measured CEOAEs from both ears for the bilateral condition, the data reported here is only from one ear, the ear being the one with larger DPOAE amplitude obtained at the screening stage. Of the 58 participants included in the study, the ipsilateral ear was right for 31 and left for the remaining 27. This was done to allow direct comparisons across conditions. Therefore, ipsilateral condition in the present study would involve activation of the crossed MOCR pathway and contralateral, the uncrossed pathway, and the bilateral condition would activate both crossed and uncrossed pathways.
MEMR Test
The MEMR, when activated, causes a change in the impedance characteristics of the middle ear by stiffening the ossicular chain. The increased stiffness is expected to attenuate signals (predominantly low frequencies) passing through the middle ear, resulting in smaller OAE amplitudes—an effect similar to that caused by the activation of the auditory efferents. In contrast to the reduction in OAE levels, the MEMR is expected to result in an increase in the stimulus level, consistent with an increase in middle ear reflectance, at least below 1.2 kHz. Thus, the click level in the ear canal was monitored to rule out activation of the MEMR. An increase in stimulus level of 0.12 dB is thought to suggest MEMR activation (Abdala et al. 2013; Boothalingam and Purcell 2015). In addition to only including participants with high enough MEMR thresholds (> 80 dB SPL), we quantified the change in click level, between baseline and efferent windows, in a 78-μs interval around the click stimulus peak to identify participants with MEMR activation. Stimulus-level change in the most potent efferent elicitor used in the study (bilateral condition, click level 80 dB peSPL and rate 62.5 Hz [L80R62.5]) is plotted in Fig. 2. The predominantly negative change in stimulus level may suggest that none of the participants had MEMR activation in this study.
Fig. 2.
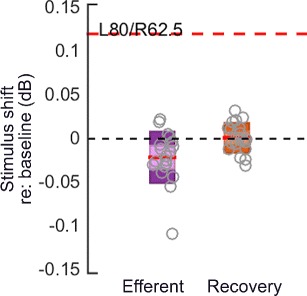
Results of the MEMR test. Changes in click (stimulus) level for the most potent efferent elicitor (bilateral, click level 80 dB peSPL and rate 62.5 Hz) combination in the efferent and recovery windows with reference to baseline window are plotted. The red line in each box represents the mean change in click level in each window, with the boxes representing the 95% confidence interval (CI) and the shaded areas within the boxes depicting ±1 SD. Grey circles are raw data. A change in click level of +0.12 dB, marked by the red dashed line, represents the assumed change caused by the MEMR. The data here may suggest that none of our participants (in the bilateral) condition had MEMR activation. A similar trend was observed for ipsilateral and contralateral conditions.
Results
Clicks Evoke Robust Efferent Activity
Statistical analyses were conducted in R (R Core Team 2013). To test if clicks evoke efferent activity, CEOAE levels in the baseline and efferent windows were subjected to a three-way repeated measures analysis of variance (ANOVA) with level, rate, and window (baseline/efferent) as independent factors. Separate ANOVAs conducted for the three conditions (ipsilateral, contralateral, and bilateral) showed a significant main effect of window in all three stimulation conditions. This main effect suggests that the CEOAE levels were statistically significantly different across the two windows for ipsilateral (F[1,18] = 34, p < 0.001), contralateral (F[1,19] = 26.5, p < 0.001), and bilateral (F[1,18] = 33, p < 0.001) conditions. Two-way interactions suggest, whereas the CEOAEs were different across windows as a function of both level (F[2,38] = 5.7, p = 0.006) and rate (F[2,38] = 15.2, p < 0.001) in the contralateral condition, the difference was only significant for click level in the ipsilateral condition (F[2,36] = 5.2, p = 0.01). That is, the change in CEOAE caused by elicitor clicks (when collapsed across levels) did not change significantly with increasing click rates in the ipsilateral condition.
No three-way interactions (level, rate, and window) were significant for either monaural condition. But, a significant three-way interaction between level, rate, and window for the bilateral condition (F[4,72] = 4.9, p = 0.001) prompted further detailed analyses to probe the differences in CEOAE level between baseline and efferent windows across rate-level combinations. We conducted post hoc t tests corrected using the false discovery rate (FDR (Benjamini and Hochberg 1995)) approach for performing multiple comparisons. Results of these t tests from the bilateral condition are presented in Table 1. These post hoc results indicate that almost all rate-level combinations, with an exception of two (L60R40 and L70R40), evoke significant efferent activity. The direction of change (efferent-baseline) indicates efferent inhibition. For the monaural conditions, post hoc comparison for the three levels (rate collapsed, due to the lack of a statistically significant three-way interaction) suggested that all three levels caused significant inhibition of CEOAE in the ipsilateral and contralateral conditions. Additionally, all rates also caused significant inhibition of CEOAEs (level collapsed) in the contralateral condition. These comparisons are not shown here as they do not inform about the rate-level interactions.
TABLE 1.
Results of post hoc comparisons between CEOAE levels in the baseline and efferent windows across rate-level combinations for the bilateral condition
| Condition | Level/rate | t value | df | p value |
|---|---|---|---|---|
| Bilateral | L60/R40 | 0.99 | 1,18 | 0.33 |
| L60/R50 | 3.01 | 1,18 | 0.0074* | |
| L60/R62.5 | 3.95 | 1,18 | 0.0009* | |
| L70/R40 | 1.9 | 1,18 | 0.0728 | |
| L70/R50 | 3.96 | 1,18 | 0.0009* | |
| L70/R62.5 | 7.48 | 1,18 | < 0.001* | |
| L80/R40 | 4.58 | 1,18 | 0.0002* | |
| L80/R50 | 6.81 | 1,18 | < 0.001* | |
| L80/R62.5 | 7.62 | 1,18 | < 0.001* |
In all level/rate combinations, “L” is level and “R” is rate. p values marked with asterisks are significant after FDR corrections
We also conducted three-way ANOVAs for the three conditions to compare baseline and recovery windows. Results suggested that none of the factors in any of the ANOVAs were significant. Critically, there was no main effect of window (baseline vs. recovery) even for the bilateral condition (F[1,18] = 3.66, p = 0.07). This lack of significant inhibition in the recovery window provides confidence that the change in CEOAE level in the efferent window is likely caused by efferent activation as MOCR effects decay within about 100–150 ms of elicitor cessation (Backus and Guinan 2006). The inhibitions in efferent and recovery windows are also plotted in Fig. 3.
Fig. 3.
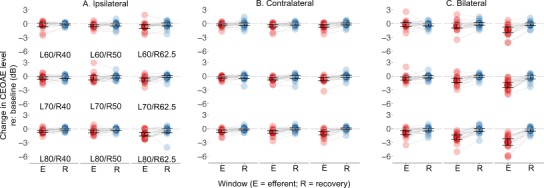
Clicks evoke robust efferent activity. Change in CEOAE level in the efferent (denoted by “E” in the x axis) and recovery (denoted by “R” in the x axis) windows with reference to baseline is plotted across the three conditions, rates, and levels. Ipsilateral (a). Contralateral (b). Bilateral (c). Translucent circles are individual data and circles with solid colors and a black outline is the mean. Error bars represent 1 SD. Data from the two windows for each participant is linked by straight gray lines to visualize the recovery of CEOAE levels following stimulus cessation. For each condition, going from the lowest (top-left) to the highest (bottom-right) rate/level combination shows the decrease in CEOAE level as expected. This CEOAE-level change can be particularly appreciated in the bilateral condition. Significant shifts from baseline are presented in Table 1. Significance was not marked in the figure because separate post hocs could not be conducted due to the lack of a statistically significant three-way (window × rate × level) interaction in the ipsilateral and contralateral conditions. Therefore, we refrained from marking any significance even for the bilateral condition to avoid any confusions.
Both Click Level and Rate Influence Efferent Inhibition of CEOAEs
To better visualize the efferent inhibitory activity across level, rate, and conditions, we subjected the change in CEOAE amplitude due to efferent activation (between baseline and efferent windows: ΔCEOAE) to a mixed-ANOVA with rate and level as within-subject factors and conditions as across-subject factor. Results are tabulated in Table 2. In general, the results show a significant main effect of all three factors. All two-way interactions were also significant. However, the three-way interaction (rate × level × conditions) did not reach significance. Therefore, post hoc tests were confined to a comparison of rate and level effects within conditions. Results of post hoc t tests that compared every rate-level combination (FDR corrected) with every other rate-level combination in each condition are presented in a matrix form in Table 3. These results suggest that efferent inhibition (ΔCEOAE) increases as a function of click level and rate. ΔCEOAE as a function of the rate at each level, and level at each rate, is plotted in Fig. 4. The general trend appears to be that the combination of faster rates and higher levels produces significantly larger ΔCEOAE compared to slower rates and lower levels. This finding is expected based on energy integration in the efferent system (Boothalingam and Purcell 2015; Lilaonitkul and Guinan 2009). In contrast to the two monaural conditions, the difference in ΔCEOAE between several rate-level combinations was significant in the bilateral condition, and fewer were significant in the contralateral condition and fewer still in the ipsilateral condition. The smaller inhibition in either monaural condition and a shallower increase in inhibition with increasing rate/level is evident in Fig. 4. Because only the bilateral conditions produced multiple significant differences across rate-level combinations, we focus more closely on the bilateral condition for further detailed analyses and interpretation.
TABLE 2.
Results of mixed-ANOVA with condition, rate, and level with ΔCEOAE as the outcome variable
| Factor | F value | df | p value |
|---|---|---|---|
| Condition | 7.12 | 1,55 | 0.0012* |
| Level | 39.5 | 2,110 | 1.18e−13* |
| Condition × level | 10.39 | 4,110 | 3.53e−07* |
| Rate | 33.04 | 2,110 | 5.8e−12* |
| Condition × rate | 6.97 | 2,110 | 4.82e−05* |
| Level × rate | 4.01 | 4,220 | 0.004* |
| Condition × level × rate | 1.74 | 4,220 | 0.09 |
Asterisks indicate significant effects
TABLE 3.
Results of post hoc comparisons across all rate-level combinations and conditions
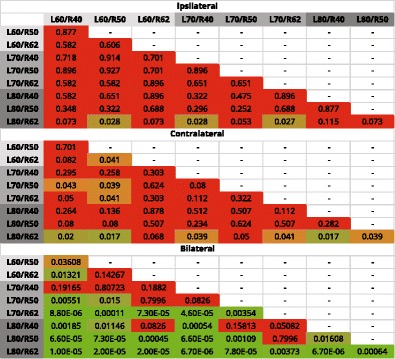
Colors represent the gradient in FDR-corrected p values. Red indicates p > 0.05, orange indicates 0.05 < p = 0.01, and green indicates p < 0.01
Fig. 4.
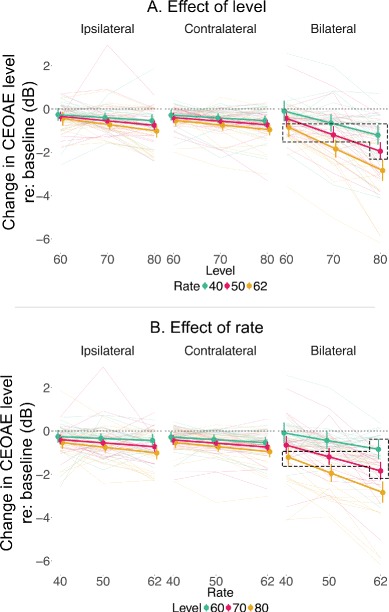
Both click rate and level influence efferent inhibition of CEOAEs. Change in CEOAE level across elicitor click level, while holding rate constant, is plotted in a. Change in CEOAE level across rate, while holding level constant, is plotted in b. In either panel, colors indicate the variable that is held constant. That is, in a, colors indicate the three rates, while in b, colors indicate the three levels. Translucent lines in the background are individual data for the three levels and rates in a, b, respectively, and solid colors are mean data. Error bars represent 1 SD. Increasing either rate or level produces increasing inhibition, as evident in both panels. It is also evident that the slopes for both level and rate effects are much steeper for the bilateral condition suggesting a larger inhibition. The slopes for both level and rate effects appear similar, especially in the bilateral condition. Rate-level combinations within the dotted boxes in either panel are not significantly different from each other suggesting an interaction between rate and level. See Fig. 5 for a closer examination of slopes in the bilateral condition.
While significant differences in the bilateral condition between low and high levels and slow and fast rates are as expected, some non-significant comparisons bring to light rather unexpected interactions between level and rate. Consider, for example, the statistical invariance in ΔCEOAE across L80R40, L60R62, L70R50, and L70R62. Consistent with the significant two-way interaction (level × rate), the invariance across these rate-level combinations suggest that an increase in click level from 70 to 80 dB peSPL (for a given rate) appears to produce a similar effect as increasing the rate from 40 to 50 Hz (for a given level). Interestingly, this dB-Hz relationship appears to hold even for larger increases in level and rate. That is, a 20-dB increase in level (60 to 80 dB peSPL) produces a similar change in ΔCEOAE as increasing the rate from 40 to 62.5 Hz. These non-significant comparisons are highlighted in Fig. 4 using boxes with dotted lines. To further probe this interactive relationship between click rate and level, we conducted a linear mixed-effect analysis with participants as the random effects and rate and level as fixed effects. Three separate models were fit for the three rates to identify the effect of increasing level on ΔCEOAE. Similarly, three separate models were fit for the three levels to identify the effect of increasing rate on ΔCEOAE. Results of these models are provided in Table 4. For example, the slope for level at a rate of 62.5 Hz suggests that for every 10-dB increase in level, there is a corresponding increase in efferent inhibition of 1 dB. However, for a lower rate of 50 Hz, the increase in inhibition reduces to 0.76 dB, suggesting that both rate and level play a role in activating the efferent system. Similarly, the slope for rate at a level of 80 dB peSPL suggests that for every 10-Hz increase in rate, there is a corresponding increase in efferent inhibition of 0.74 dB. It is evident that increments in level produce similar, but slightly larger effects (1 dB), compared to increments in rate (0.74 dB). This rate-level relationship is better appreciated in Fig. 5, which has a common x axis for both rate and level and plots both rate and level effects in a single plot.
TABLE 4.
Slope of change in ΔCEOAE with increasing rate and level obtained using linear mixed-effect modeling
| Slope (dB) | 95% CI | |
|---|---|---|
| Slope of level at | ||
| R40 | 0.56 | 0.34, 0.77 |
| R50 | 0.76 | 0.62, 0.89 |
| R62.5 | 1.00 | 0.77, 1.22 |
| Slope of rate at | ||
| L60 | 0.34 | 0.13, 0.54 |
| L70 | 0.54 | 0.41, 0.67 |
| L80 | 0.74 | 0.53, 0.94 |
Slopes suggest an increase in ΔCEOAE with every 10-dB or 10-Hz increase in click level or rate, respectively
Fig. 5.

Increasing click level produces a slightly larger inhibition compared to increasing rate. Change in CEOAE level across elicitor click level and rate for the bilateral condition is plotted in a single plot to better appreciate the difference in inhibition caused by changing level and rate. Black symbols linked by dotted black lines represent changing level while holding rate constant (level effect). The different symbols (within the level effect) represent different rate. Colored data points represent rate effect while holding level constant. The three colors differentiate the three levels. Error bars are deliberately avoided for better visualization. Error bars for the data presented here are shown in Fig. 4. Notice that the slopes of level effect are slightly steeper compared to the rate effect. Accordingly, the slopes for level effect vs. rate effect suggest that a 10-unit increase in rate produces a similar change in CEOAE level as a 7.5 unit increase in level. Note that the data points are offset along the x axis for better visualization.
Bilateral Stimulation Produces the Largest Efferent Activation
It is evident from the literature, and the results herein, that bilateral stimulation evokes larger efferent activation. To put the magnitude of efferent inhibition across conditions into perspective, we calculated effect sizes (Cohen’s d) for inhibition at each rate-level combination. Effect sizes were the ratio of the mean difference (efferent-baseline windows) and average RMS difference of the pooled standard deviations (baseline and efferent windows). These data are presented in Fig. 6. For reference, an effect size of 0.5 is considered a moderate effect, and 0.8 and above is considered a large effect (Rosnow and Rosenthal 1996). It is clear that only the bilateral stimulation produces moderate to large effect sizes at faster rates and higher levels. Either monaural condition only produces small effects.
Fig. 6.
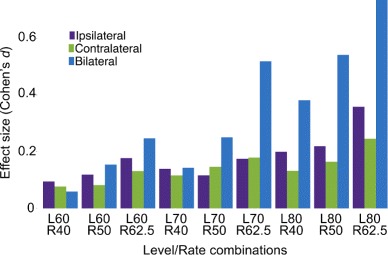
Bilateral stimulation produces the largest efferent activation. Effect size (Cohen’s d) is plotted as a function of rate/level combinations. The three colors differentiate ipsilateral, contralateral, and bilateral conditions. As expected, the effect size increases as both rate and level are increased for all three conditions with bilateral activation producing almost large effect sizes at higher rate/level combinations.
Discussion
In the current study, we investigated efferent inhibition of CEOAEs elicited by clicks of different rates and levels in three different conditions (ipsilateral, contralateral, and bilateral). The motivation was to find rate-level combinations of clicks so they could be deployed both for recording CEOAEs and activating the auditory efferents. We appear to have been successful on both counts. Our results suggest that clicks evoke significant efferent activity across almost all levels and rates tested, with higher levels and faster rates producing greater efferent inhibition. We were also able to extract OAEs from elicitor clicks, even for the highest elicitor-click rate (62.5 Hz, interval of 16 ms) used (data not shown). In addition, we were able to avoid a common source of contamination in studies of efferent inhibition of OAEs by the MEMR (see Fig. 2). Taken together, clicks seem to be reliable elicitors of efferent activity while allowing estimation of cochlear activity via OAEs.
Monaural vs. Bilateral Efferent Activation
Bilateral presentation of elicitor clicks resulted in the largest inhibition of CEOAEs. Our finding corroborates physiology; in that, the MOCR is biased towards bilateral inputs. Animal models show that, in addition to the dedicated binaural neurons, most monaural MOC neurons respond to bilateral stimulation (Brown et al. 1998; Liberman 1988) as well as stimulation from the opposite ear. Consistent with previous reports of bilateral noise and tonal activation of the auditory efferents (Berlin et al. 1995; Boothalingam and Purcell 2015; Lilaonitkul and Guinan 2009), we also observed a bilateral advantage to activating the auditory efferents using clicks.
While several elicitor-click level and rate combinations evoked efferent activity, the effect size of inhibition was smaller in monaural conditions (see Figs. 4 and 6). In addition, the lack of statistically significant level × rate interactions in the monaural conditions suggests that perhaps a larger ΔCEOAE is required to appreciate the influence of rate and level on efferent activity. It is conceivable that there exists a threshold of efferent activation below which there may not be any efferent-mediated inhibition of cochlear activity (Berlin et al. 1993; Guinan et al. 2003). For these sub-threshold efferent-stimulation conditions, the slope of efferent inhibition of cochlear activity is expected to approximate zero as a function of either elicitor level or rate. The small effect size of ΔCEOAE in either monaural condition (at least at lower rate/level combinations) would be consistent with monaural stimulation with clicks not exceeding the threshold of efferent activation. Monaural stimulation may also activate fewer MOC neurons (Brown et al. 1998; Liberman 1988), resulting in a smaller ensemble effect on cochlear activity (Liberman 1988). Faster rates and higher levels beyond those used in the present study would be expected to evoke larger monaural efferent activation, as would extending the duration of elicitor-click presentation (Berlin et al. 1995). However, higher levels and faster rates would also increase the risk of MEMR activation and prolonging elicitor duration would extend test time.
The present data, consistent with physiological evidence from prior studies, support the use of bilateral stimulation of the auditory efferents for a clinical protocol. Bilateral stimulation also allows the observation of other nuanced phenomena such as binaural facilitation as described in physiological recordings (Brown et al. 1998; Liberman 1988) and previously observed in OAE-based assays (Backus and Guinan 2006; Boothalingam et al. 2016). For reasons that are currently unknown, the magnitude of binaural facilitation when measured using OAEs is larger in early life (Boothalingam et al. 2016). On the other hand, bilateral-only stimulation of the auditory efferents would not allow the investigation of lesions or pathology isolated to either the crossed or uncrossed olivocochlear bundles.
Individual patterns in efferent inhibition of OAEs are important in understanding the physiology of the efferents as well the interplay of cochlear and efferent mechanisms. However, in the present study, we are interested in obtaining group effects as we aim to use the click parameters identified here in building a clinical test. Nevertheless, one complication that needs discussion is the CEOAE-level enhancements that can be observed in some (<10 %) individuals predominantly in ipsilateral and bilateral conditions but not in the contralateral condition (see Figs. 3 and 4). A possible interpretation of the observed enhancement is that elicitor clicks entrained or stabilized SOAEs and synchronized (s)-SOAEs in the ipsilateral and bilateral conditions. If such interactions resulted in suppression of evoked or SS-OAEs, it is possible that the phase changes caused by activation of MOCR might release the suppressed OAE (Zhao et al. 2015). Such release in suppression might cause apparent increases in evoked-OAE level with MOCR activation. Our hypothesis aligns well with the lack of such enhancements in the contralateral condition. However, considering that our study was not a repeated measure design in regard to ipsilateral, contralateral, and bilateral measurements, the lack of enhancements could well be that the MOCR of participants in contralateral conditions did not generate enhancements. Therefore, further studies are required to systematically study such apparent enhancements in CEOAEs with efferent activation.
Rate and Level Effects
Faster click rates and higher click levels produce larger efferent effects in all three conditions (ipsilateral, contralateral, and bilateral). The influence of test-click level in the contralateral ear on OAEs is typically considered a confounding factor in efferent assays with contralateral noise elicitors as they elicit ipsilateral/bilateral efferents (Collet et al. 1990a; Guinan et al. 2003; Veuillet et al. 1991). Previous reports have also demonstrated that increasing elicitor-click rates produce progressively larger efferent inhibition of OAEs (Boothalingam and Purcell 2015; Guinan et al. 2003; Veuillet et al. 1991). In the present study, we report the interaction between elicitor-click rate and level in evoking the auditory efferents. This rate-level effect is better appreciated in the bilateral condition, presumably due to the larger effect size. Figures 5 and 6 provide a detailed view of the similarities in the influence of elicitor-click rate and level in evoking MOC neurons and consequently OAE inhibition. Similar changes in ΔCEOAE are observed due to a 10-unit (Hz for rate and dB for level) increase in rate or level, when the other is held constant. The similarity in the influence of rate and level increase would suggest reciprocity between elicitor energy at any given time (level effect) and integration of energy over time (rate effect). However, the reasoning for the similarity in rate and level effects would require understanding the primary drivers of the MOC neurons.
The MOC neurons receive direct inputs from the T stellate cells in the posteroventral cochlear nucleus, which in turn receive inputs from the auditory nerve as well as from other T and D stellate cells (Brown et al. 2003; de Venecia et al. 2005; Ferragamo et al. 1998; Oertel et al. 2011; Thompson and Thompson 1991). Interestingly, the T stellate cells also receive excitatory collateral inputs from the MOC neurons which are thought to aid in the enhancement of spectral information (Fujino and Oertel 2001). For single tones, at least in the linear regime, an increase in stimulus level is conveyed by the auditory nerve as a proportional increase in its firing rate (Kiang 1965; Ruggero 1992). However, for clicks, an increase in auditory nerve firing for increasing level presumably occurs due to both an increase in basilar membrane displacement for the initial impulse as well as the ringing that follows (Pfeiffer and Kim 1972; Robles and Ruggero 2001; Ruggero 1992). That is, as with tones, the increase in click level is represented in the auditory nerve as a proportional increase in firing for the initial impulse. In addition, the auditory nerve would also be activated for the increased level of each of the “ringing cycles.” With a progressive increase in level, the duration of click ringing also increases, causing an extended period of rapid firing compared to lower click levels (Pfeiffer and Kim 1972; Ruggero 1992). As such, there is an increase in a total number of auditory nerve spikes per second with increasing click levels.
For increasing click rates, the auditory nerve is activated at a higher rate per unit time. However, the auditory nerve firing is known to adapt for click rates 10 Hz and above, reducing the signal amplitude by up to 50 % over time (Eggermont and Spoor 1973; Peake et al. 1962; Yoshie 1968). This adaptation, however, is compensated by the sustained chopping response of the T stellate cells (Oertel et al. 2011). Therefore, the MOC neurons are activated approximately continuously for the duration of click presentation despite the adaptation in the auditory nerve. Taken together, both increases in click level and rate are conveyed at the output of the T stellate cells by a proportional increase in its firing rate (Smith and Rhode 1989), causing a larger activation of the MOC neurons in either case. Furthermore, the MOC firing pattern is also sustained, similar to that of the T stellate cells, allowing for the MOC to be active for the duration of stimulation (Robertson & Gummer 1985).
While we did not hypothesize that equivalent increments in level and rate would lead to similar activation of the MOC neurons, our results suggest that level and rate do produce similar, albeit not exactly equivalent, MOC activation. If these rate-level effects were linear, 10-unit increase in rate can be thought to invoke a similar efferent inhibitory effect as ∼7.5-unit increase in level. It should be noted that the 10-level units are logarithmic, whereas the rate units are linear. Quantitatively speaking, an increase in level produces greater firing (spikes/s) in the auditory nerve fibers compared to an equivalent increase in rate. This is probably because, in addition to increased excitation, more auditory fibers are presumably recruited due to spread of excitation on the basilar membrane (Robles and Ruggero 2001). However, the effects of increasing rates may be dependent on the interplay between increasing neural adaptation (negative effect) and increased elicitor-click representation (positive effect) for faster rates.
In general, results from the present study suggest that higher elicitor-click levels and rates may be used to attain progressively larger efferent activation while monitoring cochlear activity as long as two criteria are met: (1) the MEMR is not activated and (2) a slow enough rate (i.e., large enough inter-click interval) to sample CEOAEs is used. These two criteria would dictate that click levels around 80 dB peSPL and rates of approximately 62.5 Hz or lower would be ideal for achieving maximal efferent activation while avoiding known caveats and synchronously estimating cochlear activity.
Noise- vs. Click-Activated Efferent Activity
Broadband noise is a potent efferent elicitor with its effectiveness intensifying with increasing bandwidth for any given level (Lilaonitkul and Guinan 2009). Further, in addition to the reduced spectral bandwidth compared to broadband noise, the presence of inter-stimulus intervals in clicks may render them less effective requiring longer presentation durations (e.g., > 400 ms (Berlin et al. 1995)). As such, compared to clicks, a continuous noise would always evoke a larger efferent response. However, the ΔCEOAE (∼0.3–3 dB) across conditions (ipsilateral, contralateral, and bilateral) observed using a click elicitor in the present study seem to align well with previous reports that have used broadband noise elicitors (60 dB SPL) in forward masking paradigms (Berlin et al. 1993; Boothalingam and Purcell 2015). Because forward masking is the most accessible option when using noise elicitors in the bilateral condition, at least with clicks (but also see notched- (Backus and Guinan 2006) and frozen-noise (Walsh et al. 2015) examples), the similarity in effect size and the ability to also near-simultaneously sample cochlear activity is a major advantage for click elicitors. It can be speculated that the combination of increased rate, higher level, and longer elicitor-click-train duration may have increased the potency of clicks in evoking efferent activity. It should be noted that the chance of evoking MEMR would increase with increasing elicitor-click levels and rates (Guinan 2014; Guinan et al. 2003). It is imperative that the effects of MEMR are avoided so that a true efferent effect can be discerned. The fact that we observed sizable efferent-induced inhibition of CEOAEs without activating the MEMR is an important advantage of using click elicitors over broadband noise. It can be speculated that the smaller frequency bandwidth in clicks, compared to broadband noise, may restrict the clicks from evoking MEMR. However, the levels at which clicks and broadband noise elicit MEMR must be empirically evaluated within the same ears in future studies (also see “Caveats” section below).
Implications for CEOAE Measurements
The rate-level interactions in the data mean that caution must be exercised when comparing effect sizes of ΔCEOAE across studies that have used different combinations of click rate and level. Boothalingam and Purcell (2015) reported that rates as low as 32 Hz evoke significant efferent activity when presented with contralateral noise. The current results provide evidence that even ipsilateral clicks by themselves evoke significant efferent activity at levels (80 dB peSPL) and rates (50 Hz) that are typically used in hearing screening and audiological diagnosis (Norton et al. 2000). While the average inhibition may be small, the variability in data suggests that at these typically used click rates and levels, CEOAE measured may be underestimated in some individuals. The underestimation of CEOAEs may not be an issue for most individuals. However, in the case of hearing screening with high click levels, an unfortunate combination of high efferent function and low OAE levels may potentially lead to false positives. Therefore, it can be argued that there is merit to simultaneous estimation of efferent activity while measuring CEOAEs.
Future Directions
The work reported here is the first step towards developing a clinical method that allows simultaneous evaluation of OAE generation mechanisms and efferent inhibition of cochlear activity. We have demonstrated that clicks presented at 80 dB peSPL and 62.5 Hz produce statistically significant reduction in the level of CEOAE. These parameters can now be used to design more efficient clinical paradigms without the need for forward masking paradigms. In the streamlined procedure, the ratio of OAE magnitudes evoked by initial and final clicks in a train would serve as the estimate of efferent strength. Pools of these initial and final clicks could also be employed for bootstrapping (e.g., Mertes and Goodman 2015) to obtain confidence about an efferent-mediated change in individual subjects. A crucial next step is to validate this method in clinical populations.
Caveats
The MEMR test used in the present study may suggest that even the most potent elicitor clicks employed (80 dB peSPL and 62.5 Hz) did not evoke MEMR in any participant. However, the MEMR detection method used in the present study is not without pitfalls. Activation of the MEMR predominantly attenuates low-frequency signals (< ∼1.2 kHz), but, at higher frequencies, the attenuation characteristics are thought to vary (Feeney and Keefe 1999). Analyzing only the low-frequency content of the test clicks will result in significant reduction in the available SNR to reliably detect stimulus shifts. However, one previous study has indicated that the stimulus reflectance is not significantly different at least between 1 and 2 kHz (Boothalingam et al. 2014). Another caveat with the MEMR test is that S/SSOAEs may add constructively or destructively with the test clicks, especially at faster elicitor-click rates. If constructive interference occurs during MEMR activation, the reduction in S/SSOAE amplitude due to efferent inhibition may compensate for the increase in test-click energy that may have occurred due to MEMR activation (Marks and Siegel 2017). In order to minimize the influence of S/SSOAEs, we only included participants with fewer than five SOAEs. However, it cannot be stated with complete confidence that the S/SSOAEs could not have influenced our MEMR results. The difference in amplitude between the stimulus and SSOAE may serve to minimize influence of SSOAEs on the MEMR results. Methods that are able to completely parse apart MEMR from efferent influence on OAEs in the future will greatly benefit efferent paradigms. Until such sophisticated MEMR tests become available, MEMR tests like the one used in the present study at least provide some confidence in the efferent effects reported herein. In addition, due to the reduced effectiveness of elicitor clicks in activating efferents, and the higher MEMR threshold of clicks (as measured in clinical tympanometers) together may work better for elicitor clicks in reducing the MEMR activation compared to noise elicitors.
Conclusions
Our goal was to identify rate/level parameters that maximally activate auditory efferents while also allowing for estimation of cochlear activity using CEOAEs. The identification of click parameters was an attempt to develop a clinical test of auditory efferents using tools that are readily available to clinicians and researchers. Our data suggest that (1) almost all rate-level combinations tested produce significant efferent activation, (2) it is possible to use clicks to both monitor (using CEOAEs) and evoke efferent activity, (3) bilateral stimulation causes large efferent effects compared to either monaural stimulation, (4) an increase in rate and level produce an increase in efferent activity, (5) both click rate and level are critical for optimal efferent activation (rate-level interaction), (6) an increase in level produces a slightly larger CEOAE inhibition compared to an equivalent increase in rate, (7) rate/level combination commonly used to obtain CEOAEs (e.g., in hearing screening) may evoke efferent activity, underestimating cochlear functioning, and (8) finally, clicks presented bilaterally at 80 dB peSPL and at 62.5 Hz evoke maximal efferent activity (among the rate/level combinations used here) without MEMR activation. Based on these observations, the rate/level combinations of clicks used in this study appear to hold promise for a standardized, OAE-based clinical test of efferent function. The familiarity of clinicians with CEOAEs should facilitate the adoption of such a test of efferent function.
Acknowledgments
This study was funded by American Speech-Language and Hearing Foundation New Investigator grant to SB and a Knowles Hearing Center grant to SD. The authors thank Prof. Donata Oertel for the stimulating discussions; Jen Birstler, Department of Biostatistics and Medical Informatics, University of Wisconsin–Madison for the assistance with statistics; and the two anonymous reviewers for the helpful comments.
References
- Abdala C, Mishra S, Garinis A. Maturation of the human medial efferent reflex revisited. J Acoust Soc Am. 2013;133(2):938–950. doi: 10.1121/1.4773265. [DOI] [PMC free article] [PubMed] [Google Scholar]
- Abdala C, Dhar S, Ahmadi M, Luo P. Aging of the medial olivocochlear reflex and associations with speech perception. J Acoust Soc Am. 2014;135(2):755–765. doi: 10.1121/1.4861841. [DOI] [PMC free article] [PubMed] [Google Scholar]
- Backus BC, Guinan JJ. Time-course of the human medial olivocochlear reflex. J Acoust Soc Am. 2006;119(5):2889–2904. doi: 10.1121/1.2169918. [DOI] [PubMed] [Google Scholar]
- Benjamini Y, Hochberg Y. Controlling the false discovery rate—a practical and powerful approach to multiple testing. J R Stat Soc Ser B-Methodol. 1995;57:289–300. [Google Scholar]
- Berlin CI, Hood LJ, Wen H, Szabo P, Cecola RP, Rigby P, Jackson DF. Contralateral suppression of non-linear click-evoked otoacoustic emissions. Hear Res. 1993;71:1):1–1)11. doi: 10.1016/0378-5955(93)90015-s. [DOI] [PubMed] [Google Scholar]
- Berlin CI, Hood LJ, Hurley AE, Wen H, Kemp DT. Binaural noise suppresses linear click-evoked otoacoustic emissions more than ipsilateral or contralateral noise. Hear Res. 1995;87(1):96–103. doi: 10.1016/0378-5955(95)00082-f. [DOI] [PubMed] [Google Scholar]
- Bhatt I. Increased medial olivocochlear reflex strength in normal-hearing, noise-exposed humans. PLoS One. 2017;12(9):e0184036–e0184018. doi: 10.1371/journal.pone.0184036. [DOI] [PMC free article] [PubMed] [Google Scholar]
- de Boer J, Thornton ARD, Krumbholz K. What is the role of the medial olivocochlear system in speech-in-noise processing? J Neurophysiol. 2012;107(5):1301–1312. doi: 10.1152/jn.00222.2011. [DOI] [PMC free article] [PubMed] [Google Scholar]
- Boothalingam S, Purcell DW. Influence of the stimulus presentation rate on medial olivocochlear system assays. J Acoust Soc Am. 2015;137(2):724–732. doi: 10.1121/1.4906250. [DOI] [PubMed] [Google Scholar]
- Boothalingam S, Purcell D, Scollie S. Influence of 100 Hz amplitude modulation on the human medial olivocochlear reflex. Neurosci Lett. 2014;580:56–61. doi: 10.1016/j.neulet.2014.07.048. [DOI] [PubMed] [Google Scholar]
- Boothalingam S, Allan C, Allen P, Purcell D. Cochlear delay and medial olivocochlear functioning in children with suspected auditory processing disorder. PLoS One. 2015;10(8):1–18. doi: 10.1371/journal.pone.0136906. [DOI] [PMC free article] [PubMed] [Google Scholar]
- Boothalingam S, Macpherson E, Allan C, Allen P, Purcell D. Localization-in-noise and binaural medial olivocochlear functioning in children and young adults. J Acoust Soc Am. 2016;139(1):247–262. doi: 10.1121/1.4939708. [DOI] [PubMed] [Google Scholar]
- Brashears SM, Morlet TG, Berlin CI, Hood LJ. Olivocochlear efferent suppression in classical musicians. J Am Acad Audiol. 2003;14(6):314–324. [PubMed] [Google Scholar]
- Brown MC, Kujawa SG, Duca ML. Single olivocochlear neurons in the guinea pig. I. Binaural facilitation of responses to high-level noise. J Neurophysiol. 1998;79(6):3077–3087. doi: 10.1152/jn.1998.79.6.3077. [DOI] [PubMed] [Google Scholar]
- Brown MC, de Venecia RK, Guinan JJ. Responses of medial olivocochlear neurons. Exp Brain Res. 2003;153(4):491–498. doi: 10.1007/s00221-003-1679-y. [DOI] [PubMed] [Google Scholar]
- Charaziak KK, Shera CA (2015) Measuring temporal suppression of clicked-evoked otoacoustic emissions at high frequencies. In Association for Research in Otolaryngology Mid-Winter Meeting Abs, p 308
- Collet L, Kemp DT, Veuillet E, Duclaux R, Moulin A, Morgon A. Effect of contralateral auditory stimuli on active cochlear micro-mechanical properties in human subjects. Hear Res. 1990;43(2–3):251–261. doi: 10.1016/0378-5955(90)90232-e. [DOI] [PubMed] [Google Scholar]
- Collet L, Kemp DT, Veuillet E, Duclaux R, Moulin A, Morgon A. Effect of contralateral auditory-stimuli on active cochlear micromechanical properties in human-subjects. Hear Res. 1990;43:251–262. doi: 10.1016/0378-5955(90)90232-e. [DOI] [PubMed] [Google Scholar]
- Deeter R, Abel R, Calandruccio L, Dhar S. Contralateral acoustic stimulation alters the magnitude and phase of distortion product otoacoustic emissions. J Acoust Soc Am. 2009;126(5):2413–2424. doi: 10.1121/1.3224716. [DOI] [PMC free article] [PubMed] [Google Scholar]
- Delano PH, Elgueda D, Hamame CM, Robles L. Selective attention to visual stimuli reduces cochlear sensitivity in chinchillas. J Neurosci. 2007;27(15):41464153. doi: 10.1523/JNEUROSCI.3702-06.2007. [DOI] [PMC free article] [PubMed] [Google Scholar]
- Eggermont JJ, Spoor A. Cochlear adaptation in guinea pigs. Quant Description Audiol. 1973;12(4):193–220. [PubMed] [Google Scholar]
- Feeney MP, Keefe DH. Acoustic reflex detection using wide-band acoustic reflectance, admittance, and power measurements. J Speech, Lang Hear Res. 1999;42(5):1029–1041. doi: 10.1044/jslhr.4205.1029. [DOI] [PubMed] [Google Scholar]
- Ferragamo MJ, Golding NL, Oertel D. Synaptic inputs to stellate cells in the ventral cochlear nucleus. J Neurophysiol. 1998;79(1):51–63. doi: 10.1152/jn.1998.79.1.51. [DOI] [PubMed] [Google Scholar]
- Fujino K, Oertel D. Cholinergic modulation of stellate cells in the mammalian ventral cochlear nucleus. J Neurosci. 2001;21(18):7372–7383. doi: 10.1523/JNEUROSCI.21-18-07372.2001. [DOI] [PMC free article] [PubMed] [Google Scholar]
- Garinis AC, Glattke T, Cone-Wesson BK. TEOAE suppression in adults with learning disabilities. Int J Audiol. 2008;47(10):607–614. doi: 10.1080/14992020802129402. [DOI] [PubMed] [Google Scholar]
- Goodman S. Auditory research lab audio software. Iowa City: University of Iowa; 2017. [Google Scholar]
- Goodman SS, Fitzpatrick DF, Ellison JC, Jesteadt W, Keefe DH. High-frequency click-evoked otoacoustic emissions and behavioral thresholds in humans. J Acoust Soc Am. 2009;125(2):1014–1032. doi: 10.1121/1.3056566. [DOI] [PMC free article] [PubMed] [Google Scholar]
- Guinan JJ. Olivocochlear efferents: anatomy, physiology, function, and the measurement of efferent effects in humans. Ear Hear. 2006;27(6):589–607. doi: 10.1097/01.aud.0000240507.83072.e7. [DOI] [PubMed] [Google Scholar]
- Guinan JJ. Olivocochlear efferent function: issues regarding methods and the interpretation of results. Front Syst Neurosci. 2014;8:142. doi: 10.3389/fnsys.2014.00142. [DOI] [PMC free article] [PubMed] [Google Scholar]
- Guinan JJ, Backus BC, Lilaonitkul W, Aharonson V. Medial olivocochlear efferent reflex in humans: otoacoustic emission (OAE) measurement issues and the advantages of stimulus frequency OAEs. J Assoc Res Otolaryngol. 2003;4(4):521–540. doi: 10.1007/s10162-002-3037-3. [DOI] [PMC free article] [PubMed] [Google Scholar]
- Hood LJ, Berlin CI, Bordelon J, Rose K. Patients with auditory neuropathy/dys-synchrony lack efferent suppression of transient evoked otoacoustic emissions. J Am Acad Audiol. 2003;14(6):302–313. [PubMed] [Google Scholar]
- Kiang N. Discharge patterns of single fibers in the cat’s auditory nerve. Cambridge, MA: MIT Press; 1965. [Google Scholar]
- Kim SH, Frisina DR, Frisina RD. Effects of age on contralateral suppression of distortion product otoacoustic emissions in human listeners with normal hearing. Audiol Neurotol. 2002;7(6):348–357. doi: 10.1159/000066159. [DOI] [PubMed] [Google Scholar]
- Kumar A, Vanaja CS. Functioning of olivocochlear bundle and speech perception in noise. Ear Hear. 2004;25(2):142–146. doi: 10.1097/01.aud.0000120363.56591.e6. [DOI] [PubMed] [Google Scholar]
- Liberman MC. Response properties of cochlear efferent neurons: monaural vs. binaural stimulation and the effects of noise. J Neurophysiol. 1988;60(5):1779–1798. doi: 10.1152/jn.1988.60.5.1779. [DOI] [PubMed] [Google Scholar]
- Liberman MC, Liberman LD, Maison SF. Efferent feedback slows cochlear aging. J Neurosci. 2014;34(13):4599–4607. doi: 10.1523/JNEUROSCI.4923-13.2014. [DOI] [PMC free article] [PubMed] [Google Scholar]
- Lilaonitkul W, Guinan JJ. Human medial olivocochlear reflex: effects as functions of contralateral, ipsilateral, and bilateral elicitor bandwidths. J Assoc Res Otolaryngol. 2009;10(3):459–470. doi: 10.1007/s10162-009-0163-1. [DOI] [PMC free article] [PubMed] [Google Scholar]
- Lilaonitkul W, Guinan JJ. Frequency tuning of medial-olivocochlear-efferent acoustic reflexes in humans as functions of probe frequency. J Neurophysiol. 2012;107(6):1598–1611. doi: 10.1152/jn.00549.2011. [DOI] [PMC free article] [PubMed] [Google Scholar]
- Maison SF, Liberman MC. Predicting vulnerability to acoustic injury with a noninvasive assay of olivocochlear reflex strength. J Neurosci. 2000;20(12):4701–4707. doi: 10.1523/JNEUROSCI.20-12-04701.2000. [DOI] [PMC free article] [PubMed] [Google Scholar]
- Maison SF, Usubuchi H, Liberman MC. Efferent feedback minimizes cochlear neuropathy from moderate noise exposure. J Neurosci. 2013;33(13):5542–5552. doi: 10.1523/JNEUROSCI.5027-12.2013. [DOI] [PMC free article] [PubMed] [Google Scholar]
- Marks KL, Siegel JH. Differentiating middle ear and medial olivocochlear effects on transient-evoked otoacoustic emissions. J Assoc Res Otolaryngol. 2017;121:1588–1514. doi: 10.1007/s10162-017-0621-0. [DOI] [PMC free article] [PubMed] [Google Scholar]
- Mertes IB, Goodman SS (2015) Within- and across-subject variability of repeated measurements of medial olivocochlear-induced changes in transient-evoked otoacoustic emissions. Ear Hear 37(2): e72–e84 [DOI] [PubMed]
- Mishra SK, Lutman ME. Repeatability of click-evoked otoacoustic emission-based medial olivocochlear efferent assay. Ear Hear. 2013;34(6):789–798. doi: 10.1097/AUD.0b013e3182944c04. [DOI] [PubMed] [Google Scholar]
- Mott JB, Norton SJ, Neely ST, Warr BW. Changes in spontaneous otoacoustic emissions produced by acoustic stimulation of the contralateral ear. Hear Res. 1989;38(3):229–242. doi: 10.1016/0378-5955(89)90068-3. [DOI] [PubMed] [Google Scholar]
- Muchnik C, Ari-Even-Roth D, Othman-Jebara R, Putter-Katz H, Shabtai EL, Hildesheimer M. Reduced medial olivocochlear bundle system function in children with auditory processing disorders. Audiol Neurotol. 2004;9(2):107–114. doi: 10.1159/000076001. [DOI] [PubMed] [Google Scholar]
- Norton SJ, Gorga MP, Widen JE, Folsom RC, Sininger Y, Cone-Wesson BK, Vohr BR, Fletcher KA. Identification of neonatal hearing impairment: summary and recommendations. Ear Hear. 2000;21(5):529–535. doi: 10.1097/00003446-200010000-00014. [DOI] [PubMed] [Google Scholar]
- Oertel D, Wright S, Cao X-J, Ferragamo M, Bal R. The multiple functions of T stellate/multipolar/chopper cells in the ventral cochlear nucleus. Hear Res. 2011;276(1–2):61–69. doi: 10.1016/j.heares.2010.10.018. [DOI] [PMC free article] [PubMed] [Google Scholar]
- Peake WT, Goldstein MH, Jr, Kiang NYS. Responses of the auditory nerve to repetitive acoustic stimuli. J Acoust Soc Am. 1962;34(5):562–570. [Google Scholar]
- Perrot X, Collet L. Function and plasticity of the medial olivocochlear system in musicians: a review. Hear Res. 2013;308:27–40. doi: 10.1016/j.heares.2013.08.010. [DOI] [PubMed] [Google Scholar]
- Pfeiffer RR, Kim DO. Response patterns of single cochlear nerve fibers to click stimuli: descriptions for cat. J Acoust Soc Am. 1972;52(6B):1669–1677. doi: 10.1121/1.1913301. [DOI] [PubMed] [Google Scholar]
- R Core Team . R Foundation for Statistical Computing, Vienna, Austria. 2013. R: a language and environment for statistical computing. [Google Scholar]
- Rasmussen GL. The olivary peduncle and other fiber projections of the superior olivary complex. J Comp Neurol. 1946;84(2):141–219. doi: 10.1002/cne.900840204. [DOI] [PubMed] [Google Scholar]
- Robertson D, Gummer M. Physiological and morphological characterization of efferent neurons in the guinea pig cochlea. Hear Res. 1985;20(1):63–77. doi: 10.1016/0378-5955(85)90059-0. [DOI] [PubMed] [Google Scholar]
- Robles L, Ruggero MA. Mechanics of the mammalian cochlea. Physiol Rev. 2001;81(3):1305–1352. doi: 10.1152/physrev.2001.81.3.1305. [DOI] [PMC free article] [PubMed] [Google Scholar]
- Robles L, Ruggero MA, Rich NC. Basilar membrane mechanics at the base of the chinchilla cochlea. I. Input–output functions, tuning curves, and response phases. J Acoust Soc Am. 1986;80(5):1364–1374. doi: 10.1121/1.394389. [DOI] [PubMed] [Google Scholar]
- Rosnow RL, Rosenthal R. Computing contrasts, effect sizes, and counternulls on other people’s published data: general procedures for research consumers. Psychol Methods. 1996;1(4):331–340. [Google Scholar]
- Ruggero MA (1992) Physiology and coding of sound in the auditory nerve. In popper, A. N. And fay, R. R., editors, The Mammalian Auditory pathway. Neurophysiology:34–93
- Shera CA, Guinan JJ. Evoked otoacoustic emissions arise by two fundamentally different mechanisms: a taxonomy for mammalian OAEs. J Acoust Soc Am. 1999;105(2 Pt 1):782–798. doi: 10.1121/1.426948. [DOI] [PubMed] [Google Scholar]
- Shera CA, Zweig G. Noninvasive measurement of the cochlear traveling-wave ratio. J Acoust Soc Am. 1993;93(6):3333–3352. doi: 10.1121/1.405717. [DOI] [PubMed] [Google Scholar]
- Smith PH, Rhode WS. Structural and functional properties distinguish two types of multipolar cells in the ventral cochlear nucleus. J Comp Neurol. 1989;282(4):595–616. doi: 10.1002/cne.902820410. [DOI] [PubMed] [Google Scholar]
- Thompson AM, Thompson GC. Posteroventral cochlear nucleus projections to olivocochlear neurons. J Comp Neurol. 1991;303(2):267–285. doi: 10.1002/cne.903030209. [DOI] [PubMed] [Google Scholar]
- de Venecia RK, Liberman MC, Guinan JJ, Brown MC. Medial olivocochlear reflex interneurons are located in the posteroventral cochlear nucleus: a kainic acid lesion study in guinea pigs. J Comp Neurol. 2005;487(4):345–360. doi: 10.1002/cne.20550. [DOI] [PMC free article] [PubMed] [Google Scholar]
- Veuillet E, Collet L, Duclaux R. Effect of contralateral acoustic stimulation on active cochlear micromechanical properties in human subjects: dependence on stimulus variables. J Neurophysiol. 1991;65(3):724–735. doi: 10.1152/jn.1991.65.3.724. [DOI] [PubMed] [Google Scholar]
- Walsh KP, Pasanen EG, McFadden D. Changes in otoacoustic emissions during selective auditory and visual attention. J Acoust Soc Am. 2015;137(5):2737–2757. doi: 10.1121/1.4919350. [DOI] [PMC free article] [PubMed] [Google Scholar]
- Wilson US, Sadler KM, Hancock KE, Guinan JJ, Lichtenhan JT. Efferent inhibition strength is a physiological correlate of hyperacusis in children with autism spectrum disorder. J Neurophysiol. 2017;118(2):1164–1172. doi: 10.1152/jn.00142.2017. [DOI] [PMC free article] [PubMed] [Google Scholar]
- Winslow RL, Sachs MB. Effect of electrical stimulation of the crossed olivocochlear bundle on auditory nerve response to tones in noise. J Neurophysiol. 1987;57(4):1002–1021. doi: 10.1152/jn.1987.57.4.1002. [DOI] [PubMed] [Google Scholar]
- Yoshie N. Auditory nerve action potential responses to clicks in man. Laryngoscope. 1968;78(2):198–215. doi: 10.1288/00005537-196802000-00002. [DOI] [PubMed] [Google Scholar]
- Zhao W, Dhar S. Frequency tuning of the contralateral medial olivocochlear reflex in humans. J Neurophysiol. 2012;108(1):25–30. doi: 10.1152/jn.00051.2012. [DOI] [PMC free article] [PubMed] [Google Scholar]
- Zhao W, Dewey JB, Boothalingam S, Dhar S. Efferent modulation of stimulus frequency otoacoustic emission fine structure. Front Syst Neurosci. 2015;9:168. doi: 10.3389/fnsys.2015.00168. [DOI] [PMC free article] [PubMed] [Google Scholar]