

Abstract
Background
Since the onset of combination antiretroviral therapy (cART) use, the incidence of HIV-associated dementia and of HIV encephalitis have fallen dramatically. The present study investigates the extent of white matter hyperintensities (WMHs) among individuals with HIV disease, and factors that predict their presence and their impact on psychomotor speed.
Methods
322 men participating in the Multicenter AIDS Cohort Study (MACS) (185 HIV-infected, age: 57.5±6.0) underwent MRI scans of the brain. T1-weighted MP-RAGE and T2-weighted Fluid Attenuated Inversion Recovery (FLAIR) images were obtained and processed using an automated method for identifying and measuring WMHs. WMH burden was expressed as the log10 transformed percentage of total white matter that was abnormal.
Results
There were no significant associations between WMHs and HIV disease. However, the extent of WMHs was predicted by age > 60 (β=.17), non-Caucasian race (β=.14), glomerular filtration rate (β= −.11) and the presence of diabetes (β=.12). There were no interactions between HIV status and age (β = −.03) or between age and diabetes (β =.07). However, the interaction between HIV infection and diabetes was significant (β = .26). The extent of WMHs was significantly associated with performance on measures of psychomotor speed (β =.15).
Conclusions
In today’s therapeutic environment, in HIV-infected and HIV seronegative individuals those factors which affect the cerebrovasculature are the best predictors of WMHs. Diabetes has a specific impact among HIV-infected, but not uninfected men, suggesting the need for more aggressive treatment even in the prediabetes state, especially as WMHs affect cognitive functions.
Keywords: Brain, Magnetic Resonance Imaging, White Matter Hyperintensities, Cognition, Diabetes
Introduction
In the early days of the HIV epidemic, brain damage and subsequent cognitive impairment were a common sequela. If HIV-associated dementia (HAD) was the initial AIDS-defining condition, death could occur within six months [1]. At autopsy, HIV encephalitis was common with multinucleated giant cells and “white matter pallor” [2, 3]. In spite of the obvious changes to cortical white matter at death, in vivo evidence of these changes was relatively lacking [4].
Since the introduction of combination antiretroviral therapy (cART) the incidence and prevalence of HAD has fallen precipitously among those individuals with access to good medical care [5]; in its place, less severe forms of cognitive dysfunction remain [6]. However, there are no generally accepted biomarkers, especially from neuroimaging, that can aid in the diagnosis of these conditions [7]. One candidate for such a biomarker would be consistent changes to white matter. Unfortunately, the data in this regard are inconsistent. In two recent meta-analyses [8, 9] significant between-study variability was found. The effects of HIV disease on microstructure of the white matter vary considerably likely because of between-study differences in sampling, acquisition, and data analysis. Where there were HIV-related effects, the consistency of the differences across time suggested that the changes were not necessarily tracking with HIV disease. In terms of macrostructural changes there are reliable differences as a function of serostatus in total gray matter volume and CSF volume. The same, however, is not true for white matter volume. Again, findings are inconsistent among studies, and differences in data analysis may have contributed to many of disparate findings. Of some interest is the fact that the largest group differences in terms of gray matter volumes were observed early in the epidemic (e.g., [10]) and less so more recently (e.g., [11]).
Critical for the current analysis is the fact that many age-related factors such as diabetes are more common in HIV-infected individuals and can have substantial impact on cognition and brain structure (e.g., [12]). For example, insulin resistance is linked to impaired cognition [13], and among non-diabetics, fasting glucose levels are higher with increasing cognitive impairment [14]. The presence of the APOE*4 allele increases the risk of dementia in older adults [15], although in the MACS we found no relationship between E*4 and incident cognitive impairment [16].
Others have found that among HIV-infected individuals, WMHs are associated with age and systolic blood pressure [17] accompanied by significant gray matter loss in the frontal cortex [18]. There is also an association between abnormal glucose metabolism and microstructural abnormalities in the basal ganglia and in the hippocampus [19]. Taken together, these findings indicate that there is small vessel disease in the brain and that it is likely more related to CVD-related factors than to HIV-associated pathology.
A subset of men participating in the MACS underwent brain MRI scans using the sequences developed for the Alzheimer’s Disease Neuroimaging Initiative [20]. WMHs seen on T2-weighted (T2w) FLAIR MR brain images are closely linked to CVD and potentially to HIV infection. Here we investigated the predictors of WMHs expressed as a proportion of the total brain white matter. We also examined the relationship between the WMHs and a composite measure of psychomotor speed. We predicted that WMHs would be linked to psychomotor speed, and that both CVD and HIV Disease would be associated with greater WMH volume.
Methods
Standard Protocol Approvals, Registrations, and Informed Consent
This study was approved by the ethical standards committee on human experimentation at each of the MACS sites. Written informed consent was obtained from all participants prior to their undergoing research procedures.
Subjects
The MACS is a four-site study of the natural and treated history of HIV infection among men who have sex with men. The MACS has tracked cognitive functions among the study participants for the past 30+ years using screening tools (Trail Making and Symbol-Digit Substitution Tests) and has followed a sub-cohort with more detailed testing for approximately 30 years [21].
A total of 322 men were enrolled in the MACS MRI Study (185 HIV-infected) and had scan data that could be used for analysis. The men who were enrolled in the research protocol were older than 49 years, had no contra-indications to MRI, and had suffered a major medical condition (other than HIV Disease) that could affect brain structure (e.g. neurodegenerative conditions, clinical stroke, CNS opportunistic infections, etc.).
On average, the men were 58 years old, had completed college education, and 75% were Caucasian (See Table 1). The rates of diabetes and hypertension were similar between infected and uninfected men, and the mean values of hemoglobin A1c (HbA1c) and estimated glomerular filtration rate (eGFR) did not differ between groups. However, the rate of an abnormal eGFR (< 60) was greater among the infected men (8.1%) compared to the controls (2.2%) (χ2 = 5.22, p = .026; Odds Ratio = 3.94 (95% CI = 1.12 – 13.9)). The rate of elevated HbA1C (> 6.4) did not differ between groups (χ2 = .07).
TABLE 1.
Characteristics of Study Sample
| HIV Uninfected | HIV Infected | Statistic1 | |
|---|---|---|---|
| N = | 137 | 185 | |
| Age2 | 59.0 (6.95) | 56.4 (4.97) | .49 |
| Education2 | 16.6 (2.45) | 16.8 (9.0) | −.03 |
| CES-D2 | 8.91 (11.1) | 9.76 (10.4) | −.08 |
| Caucasian3 | 83.2 (114) | 70.8 (131) | 2.10 (1.2 – 3.6)* |
| Cohort3 | 19.0 (26) | 33.0 (61) | 2.04 (1.18 – 3.5)* |
| Diabetes3 | 13.9 (19) | 14.6 (27) | 1.06 (.56 – 2.0) |
| Hypertension3 | 45.3 (62) | 44.3 (82) | .96 (.62 – 1.5) |
| eGFR2 | 82.2 (15.6) | 84.4 (17.6) | −.13 |
| HbA1c2 | 5.81 (1.2) | 5.73 (.98) | .08 |
Cohen’s d or Odds Ratio (± 95% Confidence Interval)
Mean (± S.D.)
Percent (Number) condition present
p<.05
Abbreviations: CES-D-Center for Epidemiological Studies Depression; eGFR- estimated glomerular filtration rate; HbA1c- hemoglobin A1c.
Neuropsychological Evaluation
Each of the volunteers in this study completed additional tests which conform to those mentioned in the revised research criteria for HIV-associated Neurocognitive Disorder (HAND)[6]. All the neuropsychological test data were sent to the Pittsburgh site where the raw scores from the tests were either transformed into demographically adjusted T-scores [22], or to standard scores derived from published norms. Because psychomotor slowing is closely linked to vascular-related changes in brain structure and function and is a hallmark of HIV infection, we created a single composite variable reflecting performance on the Symbol-Digit Substitution Task, the Trail Making Test, and the Letter-Number Sequencing task from the Wechsler Adult Intelligence Scale-III. The four raw scores were entered into a Principal Components Analysis and a single factor was identified with component weights ranging from −.72 (Letter-Number Sequencing) to .83 (Trail Making Test, Part B). A regression-based factor score was created and utilized as a summary measure of psychomotor speed.
Magnetic Resonance Imaging
Three of the sites used Siemens 3T Trio scanners (maximum gradient slew rate: 200mT/m/sec; maximum gradient strength 40mT/m), with the Siemens phase-array head coil. One of the sites (Los Angeles) used a Siemens Allegra scanner. The sequences were (in order): Localizer Scan; Transversal (axial) Proton Density; Transversal (axial) T2-weighted; Transversal (axial) T2w FLAIR; Coronal T1-weighted (T1w) MP RAGE (8–10 mins.); and, Transversal (axial) Diffusion Tensor Imaging. The parameters of the T1w MP-RAGE sequence used for this analysis were: FOV=256 mm; slices=160; TR=2300 ms; TE=2.91 ms; TI=900 ms; Flip angle=9°; slice thickness=1.2 mm. The parameters of the T2w FLAIR sequence used for this analysis were: FOV=253 mm; slices=64; TR9160 ms; TE=90 ms; TI=2500 ms; Flip angle=50°; slice thickness=3 mm. In order to assist with the verification of scan orientation, a fiducial marker (vitamin E or fish oil capsule) was taped to the subjects’ right temple. All of the de-identified MRI data were transferred from each site to the Image Data Archive at the University of Southern California (www.ida.loni.com). A copy of derived data (e.g., WMH volumes) was sent to the MACS data center in Baltimore.
An automated pipeline was used to segment WMHs on the T2w FLAIR images. First, individual cerebral and cerebellar white matter masks were created in the T2w FLAIR image space using SPM12 (Welcome Trust Centre for Neuroimaging, http://www.fil.ion.ucl.ac.uk/spm/). For each subject, the FLAIR image and MP-RAGE images were co-registered using an affine registration with the normalized distribution cost function (transformation matrices: T2w FLAIR->T1w MP-RAGE, and T1w MP-RAGE->T2w FLAIR). Individual’s T2w FLAIR image was resliced into his T1w MP-RAGE space using the T2w-FLAIR->T1w MP-RAGE transformation matrix (i.e., rT2w_FLAIR image). SPM’s unified multispectral segmentation/normalization procedure was performed on the multispectral data (i.e., the T1w MP-RAGE image and the resliced T2w FLAIR image) and deformation fields (i.e., MNI template ->T1w MP-RAGE and T1w MP-RAGE-> MNI template) were computed. Cerebral and cerebellar white matter masks previously defined in the MNI template space were warped into individual’s T1w image space (MNI template->T1w MP-RAGE deformation), which were further resliced into his T2w FLAIR image space (the T1w MP-RAGE->T2w FLAIR transformation) using nearest neighbor interpolation. Second, seeds of WMHs were identified and an automated clustering method was used to cluster WMHs within the cerebral white matter masks on the T2w FLAIR images [23]. Given that there were very few lesions in the cerebellum in our participants, the mean and standard deviation of the cerebellar white matter on the FLAIR image was used to Z-transform the FLAIR image (Z-T2w FLAIR). On the Z-transformed FLAIR images, voxels greater than or equal to 2.5z and within the cerebral white matter mask were identified as WMH seeds, which means that on the original T2w FLAIR images white matter voxels with intensities greater than or equal to 2.5 σ of normal white matter intensity were identified. The automated segmentation method ranks the identified WMH seeds based on their intensities, iteratively updates the seeds, creates and combines white matter clusters into the final WMH segmentation on the Z-transformed FLAIR image. This method uses individual mean and standard deviation from normal cerebellar white matter to standardize individual FLAIR image, which avoids systematic bias in seed selection between participants with significant cerebral WMHs versus those with little. By performing the Z-transform, this method also can also help reducing scanner differences and variations in FLAIR images.
The WMHs were expressed as the percentage of each participants total white matter volume (i.e., healthy and unhealthy WM). These values were significantly skewed (skewness=3.23, s.e. = .14) and consequently they were transformed into log10 values, which resulted in a more normal distribution (skewness= −.15, s.e.= .14).
Results
The unadjusted associations between the log10 proportion of WM that was hyperintense and critical predictor variables are shown in Table 2. The extent of WMHs was linked to chronological age, race (non-Caucasian), diabetes, eGFR and coronary artery calcification (total Agatston score). Enrollment cohort, education, depressive symptomatology, hypertension, and HIV serostatus were not associated with WMH volume.
TABLE 2 1.
Unadjusted Correlations Between WMH volume2 and Covariates
| Age | .19* |
| Education | −.001 |
| Race3 | .12* |
| Recruitment Cohort | .05 |
| CES-D score | −.05 |
| HIV Infected | −.02 |
| Diabetes | .12* |
| Years Diabetic | .134 |
| HbA1C | .03 |
| Hypertension | −.02 |
| Years Hypertense | −.065 |
| eGFR | −.13* |
| Cartoid IMT | .08 |
| CAC | .12* |
n = 322 unless specified otherwise
log10 percent WMH of total WM volume
Caucasian vs. Other
n = 82
n = 259
p<.05
Abbreviations: CES-D-Center for Epidemiological Studies Depression; eGFR- estimated glomerular filtration rate; HbA1c- hemoglobin A1c; Cartoid IMT- carotid intima-media thickness; CAC-Coronary artery calcium.
The results of the analysis of WMH volume adjusting for critical covariates are shown in Table 3. In the first model we entered eGFR, coronary calcium (CAC), and carotid artery IMT, and none of these were statistically significant. However, when we added diabetes to the model, eGFR and CAC were now statistically reliable (model two). In model three we added variables related to age, race, education, and cohort, and the impact of race and age on prediction attenuated the impact of the other variables. HIV disease did not contribute significantly to predicting the volume of WMHs.
TABLE 3.
Adjusted Models to Predict WMH Volume (Standardized Regression Coefficients) (n=322)
| Model 1 | Model 2 | Model 3 | Model 4 | |
|---|---|---|---|---|
| eGFR | −.11 | −.11* | −.10 | −.10 |
| CAC | .11 | .12* | .07 | .07 |
| Carotid IMT | .06 | .04 | .01 | .001 |
| Diabetes | .12* | .07 | .07 | |
| Hypertension | −.03 | −.04 | −.04 | |
| Cohort | .02 | .02 | ||
| Education | .004 | .004 | ||
| Race | .14* | .14* | ||
| Age | .17* | .17* | ||
| HIV Infected | −.01 |
p<.05
Abbreviations: eGFR- estimated glomerular filtration rate; CAC-Coronary artery calcium; HbA1c- hemoglobin A1c; Cartoid IMT- carotid intima-media thickness.
In Table 4 we show the results of an analysis restricted to the individuals with HIV disease (n=185). In this analysis, the effect size of CAC was the same as that for the model including all research participants, although the effect was not statistically significant. However, in model two diabetes was a powerful predictor of WMH volume. When age, race, education, and cohort were added to the model, only race was statistically reliable, and this only slightly attenuated the impact of diabetes on WMHs. Finally, we added HIV-associated biomarkers (i.e., CD4 nadir, Peak VL, CD4 Count, and Current VL, and none of these reliably predicted WMH volume.
Table 4.
Adjusted Models to Predict WMH Volume – HIV Infected Only (n=185)
| Model 1 | Model 2 | Model 3 | Model 4 | |
|---|---|---|---|---|
| eGFR | −.06 | −.06 | −.07 | −.07 |
| CAC | .12 | .12 | .09 | .13 |
| Carotid IMT | .06 | .04 | .02 | .01 |
| Diabetes | .21* | .16* | .15 | |
| Hypertension | −.009 | .03 | −.005 | |
| Cohort | .06 | .01 | ||
| Education | .03 | −.001 | ||
| Race | .19* | .18* | ||
| Age | .08 | .07 | ||
| CD4 nadir | −.17 | |||
| Peak VL | −.02 | |||
| CD4 Count | −.01 | |||
| Current VL | −.15 |
Abbreviations: eGFR- estimated glomerular filtration rate; CAC-Coronary artery calcium; HbA1c- hemoglobin A1c; Cartoid IMT- carotid intima-media thickness; Peak VL- peak viral load; Current VL- current viral load.
p<.05
Finally, we regressed WMH volume on age, race, diabetes, HIV infection, and the interaction between serostatus and diabetes. Diabetes and HIV infection did not significantly predict WMH volume. However, the interaction between serostatus and diabetes (β =.21, p=.03) was statistically reliable (see Figure 1).
Figure 1.
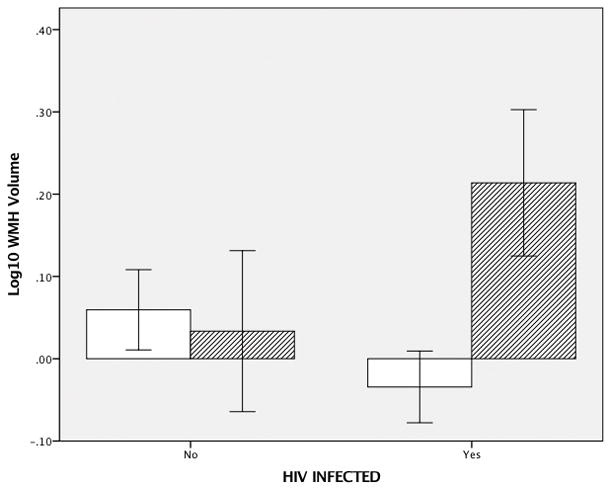
Bar graph of mean (±1.0 standard error of the mean) log10 transformed white matter hyperintensity volume. WMH volume was expressed as the proportion of each individual participant’s total white matter volume (healthy + unhealthy).
Among all study participants, there was a significant correlation between WMH volume and the composite score of psychomotor speed (r = .20, p < .05). None of the other neuropsychological measures was correlated with WMH volume, and there were no performance differences as a function of HIV serostatus (See Table 5). The composite psychomotor variable was also significantly correlated with age (r = .18, p < .05) and HbA1c (r = .19, p < .05), but not with eGFR (r = −.03); eGFR was significantly correlated with age (r = −.28), while HbA1c was not (r= −.03). We then regressed the composite score of psychomotor speed on factors thought to be associated with test performance. In the first model WMHs, IMT and HbA1c were all significant predictors of performance, but diabetes (present/absent) was not (Table 5).
TABLE 5.
Predictors of Psychomotor Speed (n = 322)
| Model 1 | Model 2 | Model 3 | |
|---|---|---|---|
| Diabetes | .07 | .03 | .02 |
| HbA1c | .17* | .07 | .08 |
| Carotid IMT | .18* | .07 | .07 |
| WMH | .17* | .10 | .10 |
| Recruitment Cohort | .28* | .27* | |
| Race | .21* | .21* | |
| CES-D | .13* | .13* | |
| Age | .29* | .29* | |
| HIV Infection | .04 |
p<.05
Discussion
There are four principal findings from this study. First, there is no association between the volume of WMHs and HIV serostatus in this group of gay and bisexual men either in unadjusted or adjusted analyses. Second, there is a significant association between WMH volume, diabetes, kidney function, and coronary artery calcium deposition, but only until age and race are accounted for. Third, there is a significant interaction between HIV serostatus and diabetes such that those individuals who are both diabetic and HIV-infected have significantly greater volumes of WMHs than nondiabetics and individuals without HIV disease. Finally, WMH volume, but not HIV infection, was a significant predictor of psychomotor speed.
With regard to the first point, there is significant between-study variability in the association between HIV infection and WMHs. In our first study with visual ratings of white matter lesions prior to the use of any pharmacological agents to combat HIV disease [4], we found no link between HIV serostatus and white matter hyperintensities in spite of the fact that HIVE was (relatively) common. Since the beginning of the use of cART in the mid-1990s, HAD and HIVE have all but disappeared in areas of the world with access to adequate medical care. A recent meta-analysis of brain macrostructural changes [9] concluded that the extent of white matter volume differences as a function of HIV disease has diminished rapidly in the cART era. However, O’Connor and colleagues also concluded that microstructural changes may persist in HIV infected individuals using cART, suggesting that DTI may be more sensitive in detecting the more subtle impact of HIV disease on brain structural connectivity (e.g., [24]). In a second meta-analysis examining microstructural changes, it was not possible to reach strong conclusions regarding the relationship between HIV disease and white matter because there was substantial between-study variability in methodologies, and it was also difficult to disentangle effects of treatment, age, and duration of infection [9]. Nevertheless, the authors concluded that because of the stability of the small alterations in white matter microstructure three-and six-months after the initiation of cART, there may be a residual impact of low level viral replication and cellular inflammation on brain structure.
Here we used a validated, automated method for identifying WMHs and calculating the lesion volumes. We expressed lesion volume as a percentage of total white matter volume (i.e., healthy and unhealthy) and then transformed these values for parametric analysis. Although we found significant effects of age and race on WMH volume, HIV serostatus was not associated with lesion volume, either in unadjusted or adjusted models.
However, in spite of the lack of association with HIV infection, we did find a significant link between WMHs and diabetes, renal function, and coronary artery calcium deposition. This is important because these findings are consistent with the literature linking WMHs to cerebral small vessel disease, which is also highly correlated with changes in kidney function (e.g., [25]) in cognitively normal elderly individuals. The finding that these associations were significantly attenuated when age and race were entered into the model is consistent with the body of literature demonstrating increased rates of diabetes, heart disease, and kidney dysfunction among African-Americans as well as an increase in cerebrovascular disease as a function of age.
It is important to note that were did not study total white matter (i.e., normal appearing WM as a proportion of intra-cranial volume), but only that WM tissue that appeared hyper-intense. These lesions are likely a consequence of systemic vascular disease can cause vascular hypertrophy and microvascular remodeling. The vascular disease promotes arteriosclerosis in large vessels and lypohyalinosis in penetrating arterioles, with subsequent dysfunction cerebral blood flow [26–28]which can lead to strokes and WMHs [29–31].
Numerous studies have found that diabetes mellitus (DM) is associated with poor brain health, as well as diseases of the kidney and the vasculature (both peripheral and central). Among individuals with a history of stroke or transient ischemic attacks, DM and impaired renal function are both associated with smaller brain volumes and poor white matter microstructural integrity [32]. Among patients scheduled for carotid endarterectomy, WMH volume was significantly associated with DM but not HTN [33]. In a large study analyzing brain microstructural differences, DM was associated with reduced WM fractional anisotropy (an index of WM integrity) as well as WML volume [34]. A study from the ADNI cohort found lower total brain volume in individuals with both mild cognitive impairment and DM relative to individuals who had mild cognitive impairment (MCI) but not diabetes. Those authors concluded that the presence of diabetes may accelerate cognitive deterioration among patients with MCI by affecting brain volume [35]. Among African-Americans with DM, greater gray matter volume (i.e., better structural integrity) was associated with lower levels of proteinuria as well as with a higher eGFR (i.e., better kidney function). Consistent with the present results, higher WML load was associated with lower eGFR as well as higher proteinuria, and proteinuria was associated with slower psychomotor speed [36].
Among a community sample of elderly Japanese individuals, brain volumes were found to be significantly smaller among those with DM. A longer duration of DM was also significantly associated with lower brain volumes; those individuals whose diabetes was diagnosed in midlife had poorer brain structural integrity relative to those who were diagnosed later in life [37]. The AGES-Reykjavik Study found that individuals with midlife cardiovascular risk factors, including diabetes, had smaller total brain volumes in late life than those without such risk factors [38]. Although there was a trend in this direction among the HIV-infected men in the current study, the small number of diabetics overall (n = 82) rendered that analysis underpowered. In another community-based study, there was a significant relationship between WML volume, HTN, diabetes, smoking, and education level [39].
While alterations in brain structure are important, how these alterations may affect structural interconnections between brain regions is becoming increasingly critical to our understanding of the pathophysiology of dementia syndromes. In a small study comparing individuals with and without DM, those with disease had fewer white matter connections between the hippocampus and the prefrontal cortex. Those individuals with fewer structural connections between these brain regions also had poor performance on memory tests, suggesting a possible link between structural/functional connectivity and behavior [40].
Consistent control of diabetes is also important; intra-individual variability in HbA1c is significantly associated with higher WML volume among individuals carrying the APOE*4 allele (after controlling for a range of variables [41]). In a large study of individuals with DM followed for approximately 3 1/2 years, those with persistent proteinuria had a greater increase in new WMLs than those without proteinuria or those for whom protein was observed only intermittently. This difference was attenuated after adjustment for age and for systolic blood pressure [42] suggesting that it was the persistent HTN causing increases in small vessel disease that were responsible for the increases in WMLs.
WMH volume may be affected by specific lifestyle interventions. After 10 years of aggressive behavioral interventions to promote weight loss and to increase physical activity, mean WMH volume was significantly lower among the treated individuals compared to the usual care group [43].
The observed interaction between the presence of diabetes and HIV infection is of particular significance. Although HAD and HIVE prevalence has fallen, milder forms of impairment remain common. The HIV-by-Diabetes interaction might help explain apparent HIV-related cognitive impairment (esp. psychomotor slowing), while in fact poorer performance among infected individuals may be due to the greater extent of WMHs, and not to their HIV infection. From the perspective of treating physicians, the greater volume of WMHs among the HIV-infected individuals suggests that they should screen for and aggressively treat diabetes and pre-diabetes among their patients with HIV disease. As noted above, the longer that an individual suffers from systemic vascular disease, the greater the burden on the cerebral vasculature (resulting in WMHs). The mechanism for HIV-by-Diabetes interaction is unclear and worthy of additional careful study, but because we did not find an association between HIV infection and diabetes, this is not the result of a spurious correlation.
Finally, these data raise important conceptual questions regarding the perspective from which investigators of HIV disease and HIV-associated neurological complications may want to consider their research questions. In the past, especially prior to the use of cART, we would routinely ask how various comorbid conditions affect the natural and treated history of HIV disease. It may be worth asking now about the impact HIV infection has on the expression, severity, natural history, and treatment/management of ‘normal’ age-related medical conditions? In the long run, as HIV infection becomes more of a chronic disease than it is even now, this may provide us with the most patient-relevant information.
Acknowledgments
The work described in this report was supported by funds from the National Institute on Aging (AG034852) to JTB. Data were also collected by the Multicenter AIDS Cohort Study (MACS) with centers at Baltimore (U01-AI35042): The Johns Hopkins University Bloomberg School of Public Health: Joseph B. Margolick (PI), Jay Bream, Todd Brown, Adrian Dobs, Michelle Estrella, W. David Hardy, Lisette Johnson-Hill, Sean Leng, Anne Monroe, Cynthia Munro, Michael W. Plankey, Wendy Post, Ned Sacktor, Jennifer Schrack, Chloe Thio; Chicago (U01-AI35039): Feinberg School of Medicine, Northwestern University, and Cook County Bureau of Health Services: Steven M. Wolinsky (PI), Sheila Badri, Dana Gabuzda, Frank J. Palella, Jr., Sudhir Penugonda, John P. Phair, Susheel Reddy, Matthew Stephens, Linda Teplin; Los Angeles (U01-AI35040): University of California, UCLA Schools of Public Health and Medicine: Roger Detels (PI), Otoniel Martínez-Maza (PI), Peter Anton, Robert Bolan, Elizabeth Breen, Anthony Butch, Shehnaz Hussain, Beth Jamieson, John Oishi, Harry Vinters, Dorothy Wiley, Mallory Witt, Otto Yang, Stephen Young, Zuo Feng Zhang; Pittsburgh (U01-AI35041): University of Pittsburgh, Graduate School of Public Health: Charles R. Rinaldo (PI), James T. Becker, Phalguni Gupta, Kenneth Ho, Lawrence A. Kingsley, Susan Koletar, Jeremy J. Martinson, John W. Mellors, Anthony J. Silvestre, Ronald D. Stall; Data Coordinating Center (UM1-AI35043): The Johns Hopkins University Bloomberg School of Public Health: Lisa P. Jacobson (PI), Gypsyamber D’Souza (PI), Alison Abraham, Keri Althoff, Michael Collaco, Priya Duggal, Sabina Haberlen, Eithne Keelaghan, Heather McKay, Alvaro Muñoz, Derek Ng, Anne Rostich, Eric C. Seaberg, Sol Su, Pamela Surkan, Nicholas Wada. Institute of Allergy and Infectious Diseases: Robin E. Huebner; National Cancer Institute: Geraldina Dominguez. The MACS is funded primarily by the National Institute of Allergy and Infectious Diseases (NIAID), with additional co-funding from the National Cancer Institute (NCI), the National Institute on Drug Abuse (NIDA), and the National Institute of Mental Health (NIMH). Targeted supplemental funding for specific projects was also provided by the National Heart, Lung, and Blood Institute (NHLBI), and the National Institute on Deafness and Communication Disorders (NIDCD). MACS data collection is also supported by UL1-TR001079 (JHU ICTR) from the National Center for Advancing Translational Sciences (NCATS) a component of the National Institutes of Health (NIH), and NIH Roadmap for Medical Research. The contents of this publication are solely the responsibility of the authors and do not represent the official views of the National Institutes of Health (NIH), Johns Hopkins ICTR, or NCATS. The MACS website is located at http://aidscohortstudy.org/.
Footnotes
Financial Disclosures: The authors have no financial interests to disclose.
Contributions of Authors:
| Minjie Wu | Data analysis, writing of manuscript, critical review |
| Omalara Fatukasi | Data analysis, critical review |
| Shaolin Yang | Critical Review of manuscript, development of data analysis technique |
| Jeffery Alger | Conceptualization of study, critical review |
| Peter B. Barker | Conceptualization of study, critical review |
| Hoby Hetherington | Conceptualization of study, critical review |
| Tae Kim | Conceptualization of study, critical review |
| Andrew Levine | Conceptualization of study, data acquisition, critical review |
| Eileen Martin | Conceptualization of study, data acquisition, critical review |
| Cynthia A. Munro | Conceptualization of study, data acquisition, critical review |
| Todd Parrish | Conceptualization of study, data acquisition, critical review |
| Ann Ragin | Conceptualization of study, data acquisition, critical review |
| Ned Sacktor | Conceptualization of study, data acquisition, critical review |
| Eric Seaberg | Data analysis, critical review of manuscript |
| James T. Becker | Conceptualization of study, data acquisition, manuscript writing, critical review |
References
- 1.McArthur JC, Hoover DR, Bacellar H, Miller EN, Cohen BA, Becker JT, et al. Dementia in AIDS patients: incidence and risk factors. Neurology. 1993;43:2245–2253. doi: 10.1212/wnl.43.11.2245. [DOI] [PubMed] [Google Scholar]
- 2.Petito CK, Cho E-S, Lemann W, Navia BA, Price RW. Neuropathology of acquired immunodeficiency syndrome (AIDS): an autopsy review. J Neuropathol and Exper Neurol. 1986;45:635–646. doi: 10.1097/00005072-198611000-00003. [DOI] [PubMed] [Google Scholar]
- 3.Navia BA, Cho E-S, Petito CK, Price RW. The AIDS dementia complex: II. Neuropathology. Ann Neurol. 1986;19:525–535. doi: 10.1002/ana.410190603. [DOI] [PubMed] [Google Scholar]
- 4.McArthur JC, Kumar AJ, Johnson DW, Selnes OA, Becker JT, Herman C, et al. Incidental white matter hyperintensities on Magnetic Resonance Imaging in HIV-1 infection: The Multicenter AIDS Cohort Study (MACS) JAIDS. 1990;3:252–259. [PubMed] [Google Scholar]
- 5.Sacktor N, Lyles RH, Skolasky R, Kleeberger C, Selnes OA, Miller EN, et al. HIV-associated neurologic disease incidence changes: Multicenter AIDS Cohort Study, 1990–1998. Neurology. 2001;56:257–260. doi: 10.1212/wnl.56.2.257. [DOI] [PubMed] [Google Scholar]
- 6.Antinori A, Arendt G, Becker JT, Brew BJ, Byrd DA, Cherner M, et al. Updated research nosology for HIV-associated neurocognitive disorders. Neurology. 2007;69(18):1789–1799. doi: 10.1212/01.WNL.0000287431.88658.8b. [DOI] [PMC free article] [PubMed] [Google Scholar]
- 7.Price RW, Epstein LG, Becker JT, Cinque P, Gisslen M, Pulliam L, et al. Biomarkers of HIV-1 CNS infection and injury. Neurology. 2007;69(18):1781–1788. doi: 10.1212/01.wnl.0000278457.55877.eb. [DOI] [PubMed] [Google Scholar]
- 8.O’Connor EE, Jaillard A, Renard F, Zeffiro TA. Reliability of White Matter Microstructural Changes in HIV Infection: Meta-Analysis and Confirmation. AJNR Am J Neuroradiol. 2017;38(8):1510–1519. doi: 10.3174/ajnr.A5229. [DOI] [PMC free article] [PubMed] [Google Scholar]
- 9.O’Connor EE, Zeffiro TA, Zeffiro TA. Brain Structural Changes following HIV Infection: Meta-Analysis. AJNR Am J Neuroradiol. 2017 doi: 10.3174/ajnr.A5432. [DOI] [PMC free article] [PubMed] [Google Scholar]
- 10.Aylward EH, Brettschneider PD, McArthur JC, Harris GJ, Schlaepfer TE, Henderer JD, et al. Magnetic resonance imaging measurement of gray matter volume reductions in HIV dementia. Am J Psychiatry. 1995;152:987–994. doi: 10.1176/ajp.152.7.987. [DOI] [PubMed] [Google Scholar]
- 11.Cohen S, Caan MW, Mutsaerts HJ, Scherpbier HJ, Kuijpers TW, Reiss P, et al. Cerebral injury in perinatally HIV-infected children compared to matched healthy controls. Neurology. 2016;86(1):19–27. doi: 10.1212/WNL.0000000000002209. [DOI] [PubMed] [Google Scholar]
- 12.McCutchan JA, Marquie-Beck JA, Fitzsimons CA, Letendre SL, Ellis RJ, Heaton RK, et al. Role of obesity, metabolic variables, and diabetes in HIV-associated neurocognitive disorder. Neurology. 2012;78(7):485–492. doi: 10.1212/WNL.0b013e3182478d64. [DOI] [PMC free article] [PubMed] [Google Scholar]
- 13.Valcour V, Paul RH. HIV infection and dementia in older adults. Clin Infect Dis. 2006;42(10):1449–1454. doi: 10.1086/503565. [DOI] [PubMed] [Google Scholar]
- 14.Valcour VG, Shikuma CM, Shiramiza BT, Williams AE, Watters MR, Puff PW, et al. Diabetes, insulin resistance, and dementia among HIV-1 infected patients. J Acquir Immun Defic Syndr. 2005;38(1):31–36. doi: 10.1097/00126334-200501010-00006. [DOI] [PMC free article] [PubMed] [Google Scholar]
- 15.Valcour V, Shikuma C, Shiramizu B, Watters M, Poff P, Selnes OA, et al. Age, apolipoprotein E4, and the risk of HIV dementia: the Hawaiian Aging with HIV Cohort. J Neuroimmunol. 2004;157(1–2):197–202. doi: 10.1016/j.jneuroim.2004.08.029. [DOI] [PubMed] [Google Scholar]
- 16.Becker J, Martinsom JJ, Penugonda S, Kingsley L, Molsberry S, Wolmsky S, et al. Alele frequencies of the apolipoprotein E gene in the Multicenter AIDS Cohort Study as a function of recruitment cohort, race, survivorship, and neuropsychological outcomes. J Neurovirol. 2013;10(S1):S10–S11. [Google Scholar]
- 17.McMurtray A, Nakamoto B, Shikuma C, Valcour V. Small-vessel vascular disease in human immunodeficiency virus infection: the Hawaii aging with HIV cohort study. Cerebrovasc Dis. 2007;24(2–3):236–241. doi: 10.1159/000104484. [DOI] [PubMed] [Google Scholar]
- 18.McMurtray A, Nakamoto B, Shikuma C, Valcour V. Cortical atrophy and white matter hyperintensities in HIV: the Hawaii Aging with HIV Cohort Study. J Stroke Cerebrovasc Dis. 2008;17(4):212–217. doi: 10.1016/j.jstrokecerebrovasdis.2008.02.005. [DOI] [PMC free article] [PubMed] [Google Scholar]
- 19.Nakamoto BK, Jahanshad N, McMurtray A, Kallianpur KJ, Chow DC, Valcour VG, et al. Cerebrovascular risk factors and brain microstructural abnormalities on diffusion tensor images in HIV-infected individuals. J Neurovirol. 2012;18(4):303–312. doi: 10.1007/s13365-012-0106-1. [DOI] [PMC free article] [PubMed] [Google Scholar]
- 20.Mueller SG, Weiner MW, Thal LJ, Petersen RC, Jack C, Jagust W, et al. The Alzheimer’s disease neuroimaging initiative. Neuroimaging Clin N Am. 2005;15(4):869–877. doi: 10.1016/j.nic.2005.09.008. [DOI] [PMC free article] [PubMed] [Google Scholar]
- 21.Becker JT, Kingsley LA, Molsberry S, Reynolds S, Aronow A, Levine AJ, et al. Cohort Profile: Recruitment cohorts in the neuropsychological substudy of the Multicenter AIDS Cohort Study. Int J Epidemiol. 2014 doi: 10.1093/ije/dyu092. [DOI] [PMC free article] [PubMed] [Google Scholar]
- 22.Heaton RK, Taylor MJ. Revised Comprehensive Norms for an Expanded Halstead-Reitan Battery: Demographically Adjusted Neuropsychological Norms for African American and Caucasian Adults. Odessa, FL: Psychological Assessment Resources; 2004. [Google Scholar]
- 23.Wu M, Rosano C, Butters M, Whyte E, Nable M, Crooks R, et al. A fully automated method for quantifying and localizing white matter hyperintensities on MR images. Psychiatry Res. 2006;148(2–3):133–142. doi: 10.1016/j.pscychresns.2006.09.003. [DOI] [PMC free article] [PubMed] [Google Scholar]
- 24.Su T, Caan MW, Wit FW, Schouten J, Geurtsen GJ, Cole JH, et al. White matter structure alterations in HIV-1-infected men with sustained suppression of viraemia on treatment. AIDS. 2016;30(2):311–322. doi: 10.1097/QAD.0000000000000945. [DOI] [PubMed] [Google Scholar]
- 25.Riverol M, Becker JT, Lopez OL, Raji CA, Thompson PM, Carmichael OT, et al. Relationship between Systemic and Cerebral Vascular Disease and Brain Structure Integrity in Normal Elderly Individuals. Journal of Alzheimer’s disease : JAD. 2014 doi: 10.3233/JAD-141077. [DOI] [PMC free article] [PubMed] [Google Scholar]
- 26.Tanoi Y, Okeda R, Budka H. Binswanger’s encephalopathy: serial sections and morphometry of the cerebral arteries. Acta Neuropathol. 2000;100:347–355. doi: 10.1007/s004010000203. [DOI] [PubMed] [Google Scholar]
- 27.Moossy J. Pathology of cerebral atherosclerosis. Influence of age, race, and gender. Stroke. 1993;24(Suppl 12):I22–I32. [PubMed] [Google Scholar]
- 28.Kalaria RN. Small vessel disease and Alzheimer’s dementia: pathological considerations. Cerebrovasc Dis. 2002;12(Suppl 2):48–52. doi: 10.1159/000049150. [DOI] [PubMed] [Google Scholar]
- 29.Muller M, Sigurdsson S, Kjartansson O, Aspelund T, Lopez OL, Jonnson PV, et al. Joint effect of mid- and late-life blood pressure on the brain: the AGES-Reykjavik study. Neurology. 2014;82(24):2187–2195. doi: 10.1212/WNL.0000000000000517. [DOI] [PMC free article] [PubMed] [Google Scholar]
- 30.Roberts RO, Knopman DS, Przybelski SA, Mielke MM, Kantarci K, Preboske GM, et al. Association of type 2 diabetes with brain atrophy and cognitive impairment. Neurology. 2014;82(13):1132–1141. doi: 10.1212/WNL.0000000000000269. [DOI] [PMC free article] [PubMed] [Google Scholar]
- 31.Debette S, Seshadri S, Beiser A, Au R, Himali JJ, Palumbo C, et al. Midlife vascular risk factor exposure accelerates structural brain aging and cognitive decline. Neurology. 2011;77(5):461–468. doi: 10.1212/WNL.0b013e318227b227. [DOI] [PMC free article] [PubMed] [Google Scholar]
- 32.Ben Assayag E, Eldor R, Korczyn AD, Kliper E, Shenhar-Tsarfaty S, Tene O, et al. Type 2 Diabetes Mellitus and Impaired Renal Function Are Associated With Brain Alterations and Poststroke Cognitive Decline. Stroke. 2017;48(9):2368–2374. doi: 10.1161/STROKEAHA.117.017709. [DOI] [PubMed] [Google Scholar]
- 33.Lucatelli P, Montisci R, Sanfilippo R, Sacconi B, Suri JS, Catalano C, et al. Is there an association between leukoaraiosis volume and diabetes? J Neuroradiol. 2016;43(4):273–279. doi: 10.1016/j.neurad.2015.11.003. [DOI] [PubMed] [Google Scholar]
- 34.Raffield LM, Cox AJ, Freedman BI, Hugenschmidt CE, Hsu FC, Wagner BC, et al. Analysis of the relationships between type 2 diabetes status, glycemic control, and neuroimaging measures in the Diabetes Heart Study Mind. Acta Diabetol. 2016;53(3):439–447. doi: 10.1007/s00592-015-0815-z. [DOI] [PMC free article] [PubMed] [Google Scholar]
- 35.Li W, Risacher SL, Huang E, Saykin AJ Alzheimer’s Disease Neuroimaging I. Type 2 diabetes mellitus is associated with brain atrophy and hypometabolism in the ADNI cohort. Neurology. 2016;87(6):595–600. doi: 10.1212/WNL.0000000000002950. [DOI] [PMC free article] [PubMed] [Google Scholar]
- 36.Freedman BI, Sink KM, Hugenschmidt CE, Hughes TM, Williamson JD, Whitlow CT, et al. Associations of Early Kidney Disease With Brain Magnetic Resonance Imaging and Cognitive Function in African Americans With Type 2 Diabetes Mellitus. Am J Kidney Dis. 2017;70(5):627–637. doi: 10.1053/j.ajkd.2017.05.006. [DOI] [PMC free article] [PubMed] [Google Scholar]
- 37.Hirabayashi N, Hata J, Ohara T, Mukai N, Nagata M, Shibata M, et al. Association Between Diabetes and Hippocampal Atrophy in Elderly Japanese: The Hisayama Study. Diabetes Care. 2016;39(9):1543–1549. doi: 10.2337/dc15-2800. [DOI] [PubMed] [Google Scholar]
- 38.Muller M, Sigurdsson S, Kjartansson O, Gunnarsdottir I, Thorsdottir I, Harris TB, et al. Late-life brain volume: a life-course approach. The AGES-Reykjavik study. Neurobiol Aging. 2016;41:86–92. doi: 10.1016/j.neurobiolaging.2016.02.012. [DOI] [PMC free article] [PubMed] [Google Scholar]
- 39.Habes M, Erus G, Toledo JB, Zhang T, Bryan N, Launer LJ, et al. White matter hyperintensities and imaging patterns of brain ageing in the general population. Brain. 2016;139(Pt 4):1164–1179. doi: 10.1093/brain/aww008. [DOI] [PMC free article] [PubMed] [Google Scholar]
- 40.van Bussel FC, Backes WH, Hofman PA, van Boxtel MP, Schram MT, Stehouwer CD, et al. Altered Hippocampal White Matter Connectivity in Type 2 Diabetes Mellitus and Memory Decrements. J Neuroendocrinol. 2016;28(3):12366. doi: 10.1111/jne.12366. [DOI] [PubMed] [Google Scholar]
- 41.Livny A, Ravona-Springer R, Heymann A, Priess R, Kushnir T, Tsarfaty G, et al. Long-term Variability in Glycemic Control Is Associated With White Matter Hyperintensities in APOE4 Genotype Carriers With Type 2 Diabetes. Diabetes Care. 2016;39(6):1056–1059. doi: 10.2337/dc15-2331. [DOI] [PMC free article] [PubMed] [Google Scholar]
- 42.Barzilay JI, Morgan TM, Murray AM, Bryan RN, Williamson JD, Schnall A, et al. Brain MRI Volume Findings in Diabetic Adults With Albuminuria: The ACCORD-MIND Study. J Gerontol A Biol Sci Med Sci. 2016;71(6):803–810. doi: 10.1093/gerona/glv187. [DOI] [PMC free article] [PubMed] [Google Scholar]
- 43.Espeland MA, Erickson K, Neiberg RH, Jakicic JM, Wadden TA, Wing RR, et al. Brain and White Matter Hyperintensity Volumes After 10 Years of Random Assignment to Lifestyle Intervention. Diabetes Care. 2016;39(5):764–771. doi: 10.2337/dc15-2230. [DOI] [PMC free article] [PubMed] [Google Scholar]