Abstract
The relationship between helical stability and binding affinity was examined for the intrinsically disordered transactivation domain (TAD) of the myeloblastosis oncoprotein, c-Myb and its ordered binding partner, KIX. A series of c-Myb mutants was designed to either increase or decrease helical stability without changing the binding interface with KIX. This included a complimentary series of A, G, P, and V mutants at three noninteracting sites. We were able to use the glycine mutants as a reference state and show a strong correlation between binding affinity and helical stability. The intrinsic helicity of c-Myb is 21% and helicity values of the mutants ranged from 8–28%. The c-Myb helix is divided into two conformationally distinct segments. The N-terminal segment, from K291-L301, has an average helicity greater than 60% and the C-terminal segment, from S304-L315, has an average helicity less than 10%. We observed different effects on binding when these two segments were mutated. Mutants in the N-terminal segment that increased helicity had no effect on the binding affinity to KIX while helix destabilizing glycine and proline mutants reduced binding affinity by more than 1 kcal/mol. Mutants that either increased or decreased helical stability in the C-terminal segment had almost no effect on binding. However, several of the mutants reveal the presence of multiple conformations accessible in the bound state based on changes in enthalpy and linkage analysis of binding free energies. This result may explain the high level of sequence identity (>90%), even at non-interacting sites, for c-Myb homologues.
Keywords: c-Myb transactivation domain, binding affinity, intrinsically disordered protein, fractional helicity, coupled folding and binding
Graphical Abstract

Introduction
Coupled folding and binding occurs for many Intrinsically disordered proteins (IDPs) when they bind to an ordered partner[1–6]. In many cases this involves a relatively short region of the IDP that has some intrinsic helicity in the free state folding into a helix when bound to the ordered partner[7–9]. Whether folding of the IDP occurs before or after binding is still an open question[6, 10, 11]. Since the stabilizing intramolecular contacts in a helix are short range it is possible for the IDP to have a broad range of fractional helicity in the free state that depends on the sequence composition of the helical segment.
Based on a simple thermodynamic argument it is expected that the helical stability for the unbound IDP will contribute to an energetic penalty for coupled folding and binding that results from a loss in conformational entropy[12, 13]. The total change in entropy that occurs during coupled folding and binding will be determined by the helical stability in the free state, the number of amino acids that become ordered in the bound state, and changes in solvation. These are the same properties determining the entropy changes that occur during protein folding[14]. In a coupled folding and binding reaction, one must also consider changes in translational and rotational entropy. A well accepted estimate for the loss of backbone conformational entropy that occurs during protein folding is about 4 cal/mol·K per residue but it is not clear if this estimate can be applied to coupled folding and binding of IDPs[14, 15].
Recent studies have shown that the fractional helicity for some IDPs can be rationally manipulated using mutagenesis and that increasing fractional helicity will increase binding affinity but may have positive or negative functional effects in a cellular context[16–18]. In particular, prolines that flank helical binding sites in IDPs appear to be common and mutating these prolines to alanine will generally increase fractional helicity, but capping effects must be considered[16, 17, 19, 20]. To date most studies have focused on IDPs with low fractional helicity in the free state.
To further explore the energetic penalty for coupled folding and binding of helical IDPs it is important to develop model systems with relatively high fractional helicity in the free state and determine the effects on binding to partner proteins after the fractional helicity is either increased or decreased by mutating amino acids that do not form part of the binding interface. We have developed such a model using the intrinsically disordered transactivation domain from the myeloblastosis oncoprotein, c-Myb (c-Myb TAD)[21]. This domain is 53 amino acids long and contains a segment from residues 291–315 that becomes helical when bound to the KIX domain of the CREB binding protein (CBP)[22]. In the free state, this domain has a helical circular dichroism (CD) spectrum and the segment that binds KIX is flanked by conserved proline residues at positions 289 and 316[23, 24]. We mutated these flanking prolines to alanine and measured the effects on fractional helicity and binding affinity to KIX. We also made a number of single amino acid substitutions to residues in the two conformationally distinct helical segments of the c-Myb helix that do not contact KIX in the bound state. We observe that increasing and decreasing the helical stability of c-Myb over a broad range has a small effect on the binding affinity to KIX. To reduce the binding affinity by more than 1 kcal/mol it was necessary to introduce glycine or proline in the middle of the c-Myb helix.
Results and Discussion
Conserved helix-flanking prolines control fractional helicity but not binding affinity of c-Myb
To study the effect of conserved helix-flanking prolines on the fractional helicity of c-Myb and the binding affinity to the KIX domain of CBP, prolines at positions 289 and 316 were substituted with alanine to create two mutants, P289A and P289A/P316A. As shown in Figure 1, the CD spectra of these two mutants indicate increased helical content relative to WT. We used the molar ellipticity at 222 nm to estimate the populations of helical structure in WT c-Myb and the proline mutants. This measure of helicity represents an average of the entire c-Myb polypeptide. Mutating the N-terminal proline at position 289 to alanine increased the mean helicity, relative to WT, from 20.8% to 26.8%. Mutating the C-terminal proline further increased the helicity to 28.2% relative to the N-term mutant. (see Table 1 for comparison of all helicity values.) In addition to the proline mutants, we mutated the glycine at position 311 to alanine. This was the only other amino acid that forms part of the c-Myb helix that binds to KIX with a low helical propensity. The CD spectra of G311A, Figure 1, also shows an increase in helicity relative to WT (24.3%).
Figure 1. CD spectra of WT c-Myb TAD, two proline mutants, and G311A.
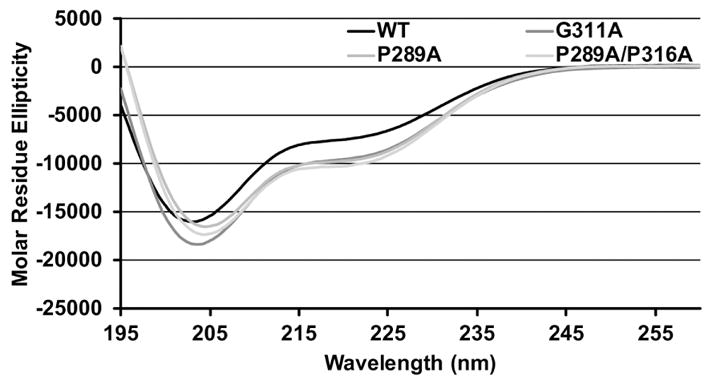
Molar residue ellipticity is plotted against wavelength. The black curve shows the molar residue ellipticity of WT c-Myb TAD. Grey curves show the molar residue ellipticity for G311A, P289A, and P289A/P316A. Molar residue ellipticity values in the figure are the mean of two CD measurements collected using the same sample.
Table 1.
%Helicity of unbound c-Myb TAD and thermodynamics of c-Myb TAD binding to KIX.
| cMyb variant | %Helicity (CD) | %Helicity (NMR) | %Helicity (289–316) | Kd (uM) | ΔG (kcal/mol) | ΔΔG (kcal/mol) | ΔH (kcal/mol) | TΔS (kcal/mol) |
|---|---|---|---|---|---|---|---|---|
| L300P | 7.77 | 5.5 | 9.51 | 290 ± 101 | −4.86 ± 0.16 | 3.6 | −1.34 ± 0.29 | 3.52 ± 0.45 |
| L300G | 14.21 | 13.8 | 22.46 | 2.24 ± 0.02 | −7.71 ± 0.01 | 0.9 | −11.33 ± 0.04 | −3.62 ± 0.04 |
| K293H | 16.28 | n.d. | 26.36 | 0.78 ± 0.06 | −8.33 ± 0.05 | 0.27 | −11.10 ± 2.10 | −2.77 ± 2.14 |
| L300V | 17.39 | n.d. | 28.40 | 0.82 ± 0.05 | −8.30 ± 0.04 | 0.3 | −11.38 ± 0.11 | −3.06 ± 0.14 |
| S304P | 17.63 | n.d. | 28.84 | 3.45 ± 0.50 | −7.46 ± 0.09 | 1.02 | −7.35 ± 0.97 | 0.11 ± 1.05 |
| N307P | 18.00 | n.d. | 29.52 | 0.95 ± 0.07 | −8.21 ± 0.04 | 0.36 | −8.97 ± 0.32 | −0.75 ± 0.36 |
| S304G | 19.20 | n.d. | 31.73 | 0.71 ± 0.13 | −8.41 ± 0.11 | 0.19 | −13.29 ± 2.69 | −4.88 ± 2.78 |
| K296H | 19.38 | n.d. | 32.06 | 0.87 ± 0.05 | −8.25 ± 0.01 | 0.34 | −13.77 ± 0.48 | −5.51 ± 0.47 |
| E292D | 20.53 | 19.2 | 34.02 | 0.63 ± 0.02 | −8.46 ± 0.04 | 0.14 | −11.22 ± 0.05 | −2.75 ± 0.10 |
| N307G | 20.55 | n.d. | 34.21 | 0.61 ± 0.04 | −8.48 ± 0.04 | 0.12 | −9.26 ± 0.23 | −0.77 ± 0.26 |
| N307V | 22.51 | n.d. | 37.81 | 0.39 ± 0.00 | −8.75 ± 0.00 | −0.15 | −8.44 ± 0.04 | 0.31 ± 0.05 |
| WT | 20.81 | 21.4 | 38.53 | 0.5 ± 0.03 | −8.60 ± 0.03 | 0 | −10.54 ± 0.40 | −1.92 ± 0.42 |
| L300A | 22.94 | n.d. | 38.60 | 0.67 ± 0.08 | −8.43 ± 0.07 | 0.17 | −9.26 ± 0.39 | −0.83 ± 0.40 |
| N307A | 23.28 | n.d. | 39.23 | 0.41 ± 0.07 | −8.73 ± 0.11 | −0.13 | −8.29 ± 0.60 | 0.43 ± 0.71 |
| S304V | 23.5 | n.d. | 39.63 | 1.49 ± 0.29 | −7.96 ± 0.11 | 0.64 | −8.39 ± 0.93 | −0.42 ± 1.03 |
| G311A | 24.31 | n.d. | 41.12 | 0.46 ± 0.03 | −8.65 ± 0.04 | −0.04 | −10.11 ± 0.26 | −1.47 ± 0.29 |
| P289A | 26.75 | 26.9 | 44.8 | 0.62 ± 0.02 | −8.46 ± 0.03 | 0.14 | −10.19 ± 0.27 | −1.73 ± 0.25 |
| S304A | 26.89 | n.d. | 45.86 | 0.38 ± 0.04 | −8.76 ± 0.07 | −0.16 | −6.94 ± 0.51 | 1.82 ± 0.58 |
| P289A/P316A | 28.22 | 27.5 | 46.7 | 0.53 ± 0.02 | −8.56 ± 0.02 | 0.04 | −9.81 ± 0.10 | −1.23 ± 0.12 |
%Helicity of WT and mutant c-Myb assessed by CD and NMR. %Helicity values of the binding region, residues 289–316, based on NMR data are in bold text; %Helicity values of 289–316 extrapolated from the correlation of CD and NMR values are in italics (R2 = 0.98). Changes in free energy, enthalpy, and entropy upon binding to KIX were determined using ITC.
Isothermal titration calorimetry (ITC) experiments were performed to study the relationship between increased levels of c-Myb helicity and its binding affinity to KIX. The increase in fractional helicity for P289A, P289A/P316A, and G311A resulted in almost no effect on their binding affinities to KIX (Figure 2 and Table 1). The Gibbs free energy (ΔG) of binding between WT c-Myb and KIX was similar to the value obtained in a previous study (−8.60±0.03 kcal/mol)[23, 24]. Mutating the N-terminal proline to alanine resulted in a small increase in ΔG to −8.46±0.03 kcal/mol. Mutating both the N- and C-terminal prolines to alanines resulted in a ΔG value that was very close to WT (−8.56±0.02 kcal/mol), and G311A bound to KIX with a ΔG of −8.65±0.04 kcal/mol. The proline mutants increased the percent helicity of c-Myb by at least 26% relative to WT across the entire polypeptide and by 16 – 21% in the binding region but resulted in almost no change in the binding affinity. Similarly, the G311A mutant increased helicity from 20.8% to 24.3%.
Figure 2. Measuring c-Myb TAD binding to KIX.
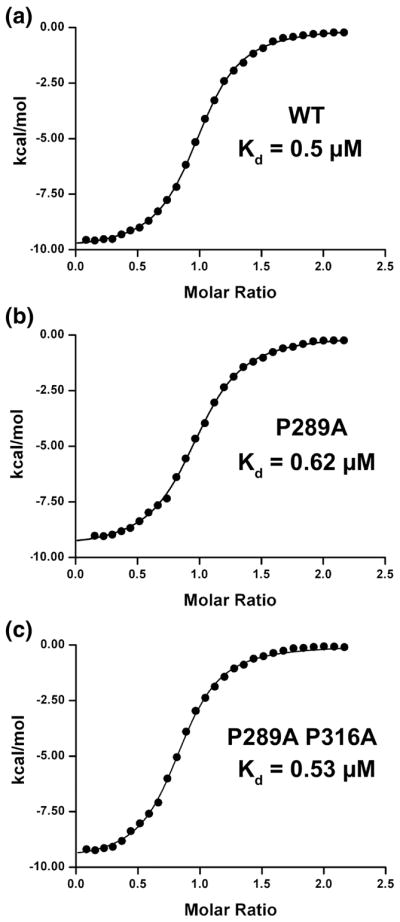
Black circles show enthalpy per mole of injectant, measured using isothermal titration calorimetry, plotted as a function of [c-Myb TAD]/[KIX]. Black lines show the fit to the data obtained using a single site binding model. Shown here is the binding of A) WT c-Myb TAD to KIX B) c-Myb P289A to KIX and C) c-Myb P289A P316A to KIX.
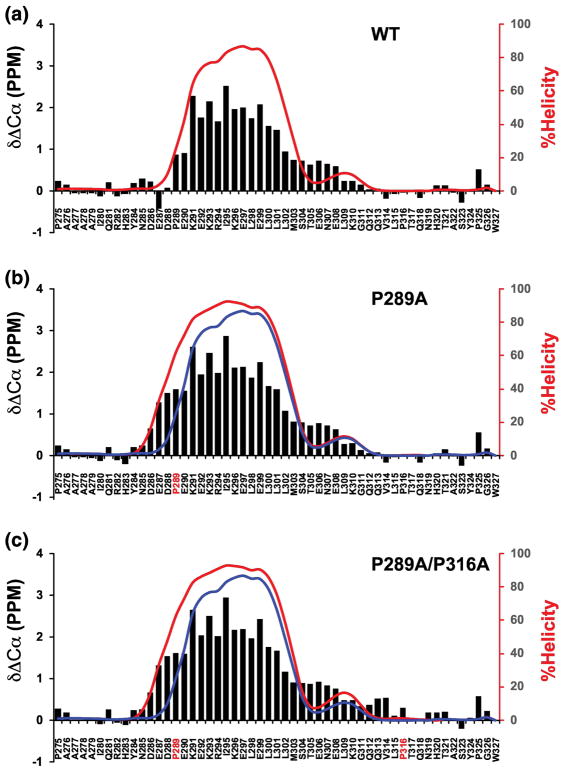
CD provides a rapid, global assessment of helical structure in proteins and peptides, but it does not provide any residue-specific information about helical content. To obtain residue-specific data on helical content we used nuclear magnetic resonance (NMR) spectroscopy. Backbone chemical shifts from NMR can be used to calculate the population of different secondary structures in IDPs[25–29]. Backbone chemical shift assignments were made for WT c-Myb and the two proline mutants (see methods). Figure 3 shows the alpha carbon secondary chemical shifts and the percent helicity values of individual residues obtained from secondary structure calculations using δ2D[28]. δCα-δCβ and mutant δCα - WT δCα plots are shown in Supplemental Figures 1 and 2. Figure 3 shows a robust helical segment that overlaps with, and extends beyond, the region of c-Myb that binds to KIX (K291-L315) for WT c-Myb and the mutants. The c-Myb helix is clearly divided into two conformationally distinct segments, consistent with a previous report[30]. There is an N-terminal segment from K291-L301 with an average helicity greater than 60% and a C-terminal segment from S304-L315 with an average helicity less than 10%. To generate a value of percent helicity that could be compared with the CD data, we took the average of the δ2D values across the entire polypeptide. Using this approach, the helicity of WT, P289A and P289A/P316A was 21.4%, 26.9%, and 27.5%, respectively. Values of percent helicity calculated from the chemical shifts are in good agreement with the values obtained from CD (Table 1).
Figure 3. Residue specific helical populations of WT c-Myb TAD and proline mutants.
Plots showing alpha carbon secondary chemical shifts (ΔδCα, black bars) and the percent helicity values calculated using δ2d (red lines) for WT and the proline mutants of c-Myb TAD. Blue lines in B and C show overlay of WT δ2d values. X-axis shows the amino acid sequence with mutation sites in red font. A) ΔδCα and δ2d plots for WT c-Myb TAD, B) ΔδCα and δ2d plots for P289A, and C) ΔδCα and δ2d plots for P289A/P316A.
The NMR data revealed changes in the fractional helicity of c-Myb residues resulting from proline to alanine mutation that are consistent with expectations. The NMR data also reveals that the region in WT c-Myb that forms an alpha helix when bound to KIX (K291-L315) has a high percent helicity in the free state and many of the individual residues between P289 and P316 have percent helicity values greater than 75%. δ2D was also used to calculate an average helicity in the region between prolines at 289 and 316, and the helicity values were 38.5%, 44.8%, and 46.7% for WT, P289A, and P289A/P316A, respectively (Table 1).
It is important to note that previous solution state structural studies of c-Myb TAD binding to KIX used a shorter fragment of c-Myb than we are using in this study[11, 22]. This shorter fragment corresponds to c-Myb TAD residues K291 – L315. Previous studies have shown the longer fragment we are using is indeed more helical than the shorter fragment previously used but we are providing the first high resolution structural data on the interaction between the longer fragment of c-Myb TAD and KIX[23, 24].
Identifying noninteracting sites for mutagenesis
To further explore the role of fractional helicity on the coupled folding and binding of c-Myb to KIX, we made mutations in the binding region that either reduced or increased the fractional helicity and measured the binding affinity to KIX. To avoid changing the binding interface, the structure of the complex between c-Myb and KIX was examined and six sites (E292, K293, K296, L300, S304, and N307) not directly contacting KIX were selected for mutagenesis (Figure 4)[22].
Figure 4. Interactions between c-Myb TAD and KIX.
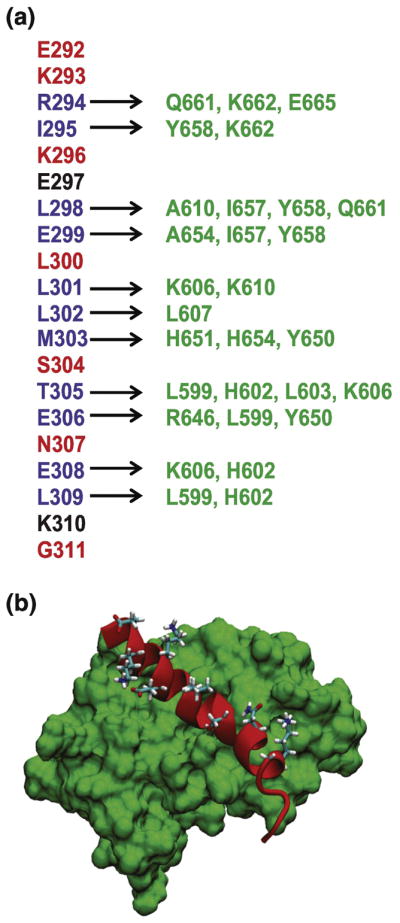
A) c-Myb TAD residues shown in blue form an alpha helix and are in direct contact with the KIX residues shown in green. Other c-Myb TAD residues shown form an alpha helix and do not make direct contact with KIX. Residues shown in red selected for mutagenesis. B) Structure of the c-Myb TAD-KIX complex (PDB ID 1SB0). A surface model of KIX is shown in green and c-Myb TAD is shown as a ribbon structure in red. Side chains are shown for solvent-exposed amino acid residues that do not directly contact KIX.
At positions 300, 304 and 307 we created a complementary series of mutants to interrogate how the stability of the unbound c-Myb helix impacts binding affinity. Position 300 is in the middle of the binding region and is highly helical in the free state based on δ2D data, whereas S304 and N307, near the C-terminus of the binding region, have relatively low unbound helicity (L300 = 79%, S304 = 13.9% and N307 = 6.8%). At all three sites we changed the WT residue to A, P, G, and V. Based on their helical propensities we expected proline and glycine mutants to decrease helicity at all sites. The insertion of proline was expected to decrease both helicity and potentially binding affinity as it may affect the bound state. Glycine was expected to decrease the helicity of the free state polypeptide but have small effects on binding affinity. Valine was expected to increase helicity for S304 and N307 but decrease helicity for L300 due to its relative helical propensity, and alanine was expected to increase helicity in all cases. We also mutated E292 to D and K293 and K296 to H to preserve the charge of c-Myb because disrupting the charge could have effects on binging affinity that would be difficult to disentangle from changes in helicity.
Changing the helicity of c-Myb TAD has small effects on binding affinity
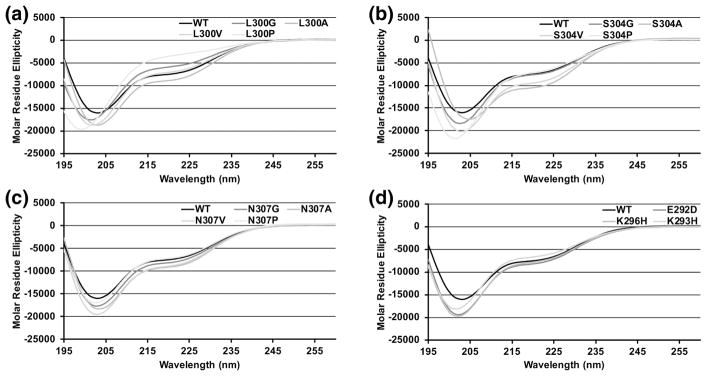
CD spectra were collected for all the mutants, and percent helicity was estimated based on the molar ellipticity at 222 nm (Table 1). Spectra for the L300, S304 and N307 mutants are shown in Figure 5A–C and spectra for E292D, K293H and K296H are shown in Figure 5D. For the L300, S304, and N307 mutants, changes in helicity largely follow the trend expected based on the helical propensity of the amino acid substitution but the magnitude of the changes were relative to the intrinsic helicity at the site. S304P and G and N307P and G resulted in small reductions in helicity, which was expected because the WT helicity in this region is already low. S304P and N307P had helicities of 17.4% and 18%, respectively, while S304G and N307G had helicities of 19.2% and 20.6%, respectively. S304A, S304V, N307A and N307V were more helical than WT with helicities ranging from 22.5% – 26.9%. L300P and L300G have large reductions in helicity, by contrast. The helicity was 7.8% for L300P, 14.2% for L300G, and 17.4% for L300V. L300A resulted in an increase in helicity to 22.9%. All of the charge mutants reduced helicity. E292D and K296H had small reductions, 20.5% and 19.4%, respectively; K293H had a larger reduction, at 16.3%.
Figure 5. CD spectra of L300, S304, N307 and charge mutants.
Molar residue ellipticity is plotted against wavelength. In each panel the black curve shows the molar residue ellipticity of WT c-Myb TAD and grey curves show the mutants. A) CD spectra for L300 mutants. B) CD spectra for S304 mutants. C) CD spectra for N307 mutants. D) CD spectra for charge mutants. Molar residue ellipticity values in the figure are the mean of two CD measurements collected using the same sample.
ITC was performed on all the mutants. Representative curves for L300V, L300G, and L300P are shown in Figure 6. The L300V mutant had a modest reduction in binding affinity (ΔG = −8.30±0.04 kcal/mol), the L300G mutant showed a large reduction in binding affinity (ΔG = −7.71±0.01 kcal/mol) and the binding of L300P was barely detectable using ITC (ΔG = −4.86±0.16 kcal/mol). As expected, the binding between c-Myb and KIX was almost abolished when a proline was introduced in the middle of the helix. The binding of L300A was similar to WT (ΔG = −8.43±0.07 kcal/mol) despite increased helicity. S304A had slightly greater binding affinity than WT at −8.76±0.07 kcal/mol, whereas S304G was slightly weaker at −8.41±0.11 kcal/mol. S304V and S304P binding was significantly reduced at −7.96±0.11 kcal/mol and −7.58±0.11 kcal/mol, respectively. We think the unexpectedly low binding affinity of S304V is due to steric hindrance in the bound state. N307A and N307V had slightly tighter binding than WT at −8.73±0.11 kcal/mol and −8.75±0.00 kcal/mol, whereas N307G had a ΔG of −8.48±0.04 kcal/mol and N307P had a ΔG of −8.21±0.04 kcal/mol. E292D and K296H had similar binding affinity to KIX as WT, but K293H has a modest effect where ΔG is −8.33±0.05.
Figure 6. Measuring L300 mutants binding to KIX.
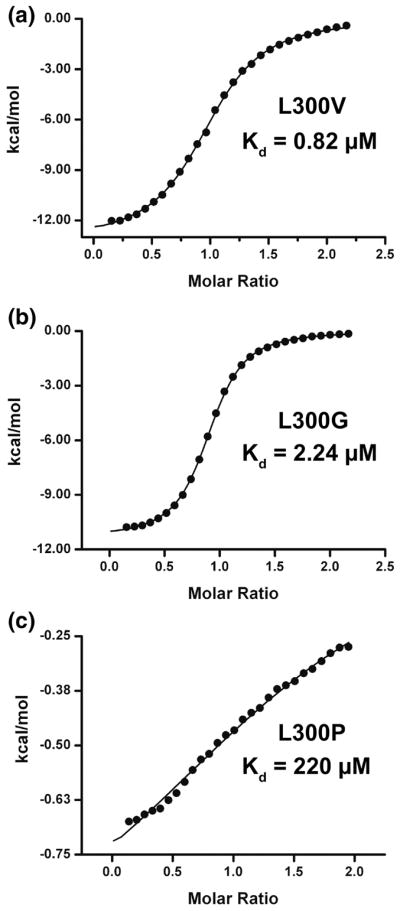
Black circles show enthalpy per mole of injectant, measured using isothermal titration calorimetry, plotted as a function of [c-Myb TAD]/[KIX]. Black lines show the fit to the data obtained using a single site binding model. Shown here is the binding of a) L300V to KIX b) L300G to KIX and C) L300P to KIX.
Structural basis for L300G and L300P binding to KIX
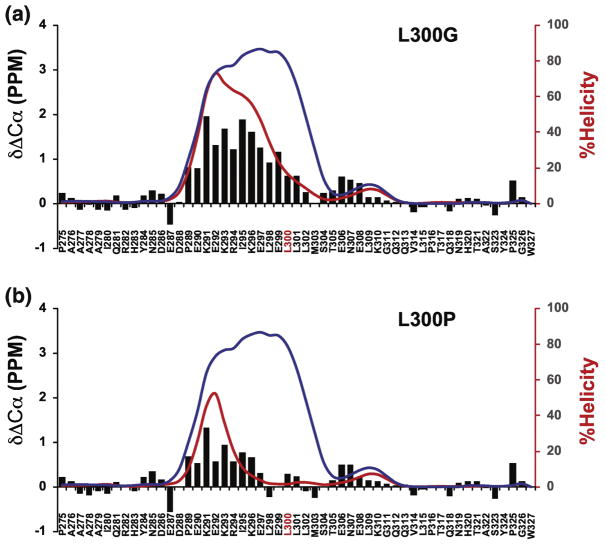
NMR spectroscopy was used to determine the residue specific changes in fractional helicity of the L300P and L300G mutants (Figure 7) because they had the biggest reductions in helicity based on CD. Based on the NMR data the mean value of percent helicity for L300G was 13.8% and L300P was 5.5%. Similar to the mutation of the helix-flanking prolines, percent helicity values for the mutants, estimated from either the CD or NMR data, have a good correspondence. The δ2D plots in Figure 7 show large reductions in fractional helicity that are adjacent to the site of mutation and propagate throughout the segment that becomes helical when bound to KIX. For both mutants, the helix is abolished for residues that are C-terminal of the mutation site. For L300G there is still a relatively strong helical signal for residues on the N-terminal side of the mutation and for L300P the percent helicity in this region is much lower. The fact that both mutants retain some helical character on the N-terminal side of the mutation is consistent with our basic understanding of how helix propagation is disrupted by proline and glycine.
Figure 7. Residue specific helical populations of L300G and L300P.
Plots showing alpha carbon secondary chemical shifts (ΔδCα, black bars) and the percent helicity values calculated using δ2d (red lines) for L300 mutants. Blue lines in A and B show overlay of WT δ2d values. X-axis shows the amino acid sequence with mutation sites in red font. A) ΔδCα and δ2d plots for L300G, B) ΔδCα and δ2d plots for L300P.
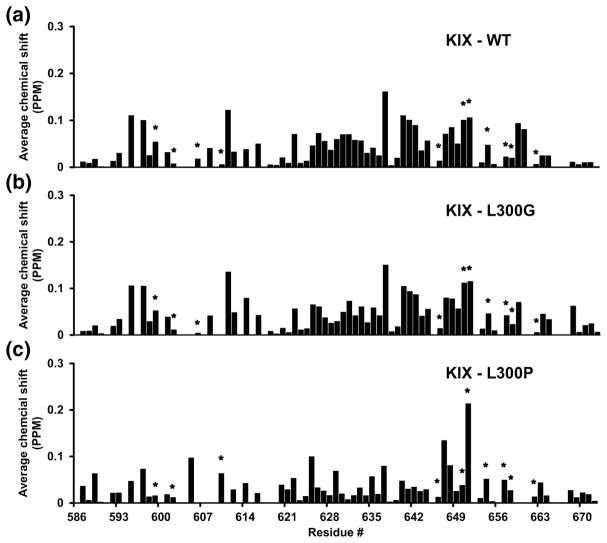
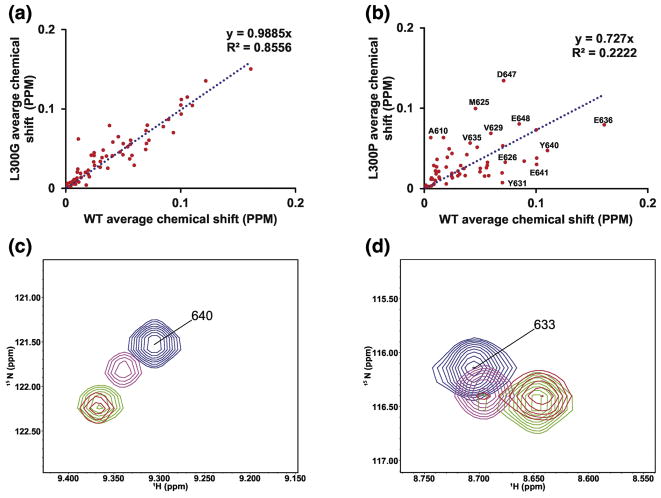
Introducing helix-breaking amino acids like proline and glycine at position 300 might change the structure of c-Myb bound to KIX even though this residue does not directly contact KIX. Hence, it is important to make sure that the weak binding affinities observed for the L300P and L300G mutants are not arising from a disrupted binding interface between c-Myb and KIX and are mostly due to changes in the fractional helicity of c-Myb in the free state. Chemical shift mapping experiments were performed with KIX bound to WT c-Myb, L300G, and L300P to determine whether the binding interface between c-Myb and KIX was disrupted by the mutations. Figure 8 shows the average chemical shift changes for the amide nitrogen and proton resonances of 13C/15N-labeled KIX bound to WT c-Myb (A), L300G (B), and L300P (C). The average chemical shift changes for WT c-Myb and L300G are very similar but the average chemical shifts for L300P are different from those observed for WT c-Myb.
Figure 8. Chemical shift mapping of KIX binding to c-Myb TAD.
Calculation of average amide nitrogen and proton chemical shift changes for KIX is described in the materials and methods. The plots show residue specific chemical shift changes of A) KIX binding to WT cMyb TAD and B) KIX binding to L300G and C) KIX binding to L300P. Asterisks label KIX residues that directly contact c-Myb TAD in the solution structure. The average combined resolution for the 1H and 15N dimensions in the HSQC was 0.03 ppm. Chemical shift changes greater than this value are considered.
To estimate the scale of any structural changes at the binding interface, correlation analysis was performed on the chemical shift changes of KIX bound to WT c-Myb, L300G, and L300P (Figure 9). In the case of a perfect correspondence in binding we expect to see a straight line with a slope of 1 when the chemical shift changes of KIX bound to WT c-Myb are plotted against the chemical shift changes of KIX bound to either L300G or L300P (Figure 9A and B). This is nearly the case for L300G but several of the chemical shifts for amino acids in the L300P mutant deviate from linearity. The largest outliers are labeled in Figure 9B. Based on this result it is likely that the reduction in binding affinity for the L300P mutant is a combination of changes in fractional helicity and disruption of the binding interface.
Figure 9. Correlation analysis of chemical shift mapping.
A) Correlation plot of the average chemical shift changes for KIX when bound to either L300G or WT c-Myb TAD. B) Correlation plot of the average chemical shift changes for KIX when bound to either L300P or WT c-Myb TAD. C) Overlay of 1H-15N HSQC resonances for Y640. D) Overlay of 1H-15N HSQC resonances for K633. In B) and C) blue peaks are from free KIX, red peaks are from KIX bound to WT c-Myb TAD, green peaks are from KIX bound to L300G, and magenta peaks are from KIX bound to L300P
Closer inspection of individual resonances provides additional support for this conclusion. Figure 9C shows an overlay of the 1H-15N HSQC resonances for amino acid Y640 from KIX. The blue resonance is from free KIX, magenta is L300P bound to KIX, green is L300G bound to KIX, and red is WT c-Myb bound to KIX. In the case of Y640, the resonance for L300P lies on a relatively straight line between free KIX and KIX bound to WT c-Myb. This suggests that the structure of this amino acid in the bound state is similar between L300P and WT c-Myb but there is a lower population of bound state structures. The overlay of 1H-15N HSQC resonances for K633 from KIX is shown in Figure 9D. In contrast, the resonance for K633 in the L300P spectrum is not on a straight line between free KIX and KIX bound to WT c-Myb, suggesting that the bound state structure of L300P is different at this site.
Conclusions
The loss of conformational entropy for folding a helical IDP when it binds an ordered partner should be proportional to the stability of the unbound helix. Our previous work on the p53 transactivation domain binding to the E3 ligase, Mdm2, provided a dramatic example of this principle for a disordered binding site that had a low intrinsic helicity[16]. To further examine the role of intrinsic helicity in coupled folding and binding, we designed a series of mutations to change helical stability in the region of c-Myb TAD that binds to KIX. The intrinsic helicity of WT c-Myb TAD is 21% and we were able to vary the unbound helicity of c-Myb TAD over a wide range (7.7% to 28.2%) with relatively small effects on binding affinity. It was necessary to make radical substitutions in the middle of the c-Myb TAD helix, or else structurally compromise the bound-state helix, before we observed a significant reduction in the binding affinity to KIX.
We think it is particularly interesting that we were able to increase helicity in a region where helicity was initially low and still have no effect on binding affinity. The S304A mutant falls into this category. The S304A mutant increased helicity relative to WT by 29% but this increase in helicity had almost no effect on binding affinity. The ΔG of S304A was −8.76±0.07 kcal/mol, compared to a WT ΔG of −8.60±0.03 kcal/mol. We suspect this is because c-Myb is already very helical in the region between E290-L300 and the average helicity of residues 289–316 is also high at 38.5% (Figure 3 and Table 1). Interestingly, the S304A had large compensating changes in the enthalpy and entropy of binding relative to WT c-Myb, which we discuss more below.
There was one mutant, S304V, that increased helicity but reduced binding affinity. Examining the solution structure of c-Myb bound to KIX (PDB ID: 1SB0) shows that the side chain of S304 is in close proximity to the backbone atoms of M303. We think the insertion of the bulky valine side chain at position 304 introduces a steric clash with the amide hydrogen of M303, which interferes with the folding of the c-Myb helix. Another mutant that reduced binding affinity was S304P. Even though S304P reduced helicity as well as binding affinity we think its behavior is similar to S304V, affecting helix formation and/or propagation in the bound state.
Most of the mutations that reduced the fractional helicity of c-Myb also had small effects on the binding affinity to KIX, including N307G, E292D, S304G, K296H, K293H, L300V, and N307P. There were only two mutants that reduced helicity and also reduced the binding affinity by more than 0.50 kcal/mol. These were L300P and L300G. The helicity of L300G from residue 289–316 is 22.9% and it is 9.5% for L300P, which means there is a relatively broad window of helical stability we were not able to probe. It is also clear from the chemical shift mapping experiments that the binding affinity of L300P to KIX is influenced by changes to both helicity and the bound structure.
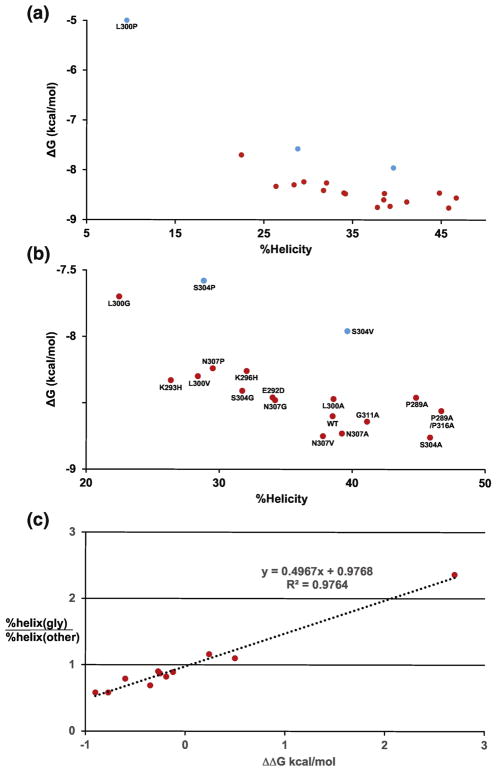
Figure 10A and 10B show plots of the free energy of binding (ΔG) between c-Myb and KIX and the percent helicity of WT c-Myb and the mutants we investigated, which shows a positive correlation between binding affinity and helical propensity. Figure 10C shows a plot of ΔΔG of binding to KIX, which is ΔG of the glycine mutants at each site minus ΔG of WT and the other mutants, plotted against the ratio of the average helicity values, which is a proxy for changes in helical stability. Figure 10C shows that most mutations stabilize the helix with respect to the glycine reference state (helicity ratio < 1) and that there is a strong correlation between changes in the binding affinity and changes in the helical stability of c-Myb, with helix-stabilizing mutations leading to higher binding affinities.
Figure 10. Linking binding free energy (ΔG) and helical stability of WT and mutant c-Myb peptides.
A) Plot of binding free energy (ΔG) from ITC is versus percent helicity values for residues 289–316. B) Expanded version of A with labels for each data point. Blue points show mutants that may change the structure of the c-Myb/KIX complex. C) Plot of helical stability versus ΔΔG of binding. The ΔG of binding for the glycine mutants was subtracted from the values of WT and the A, V, and P mutants at each site. Helical stability is plotted a percent helicity of a glycine mutant at a given position divided by the percent helicity of the WT and the A, V, and P mutants at the same site. The S304V mutant was excluded from the plot.
If the mutants we designed are only affecting helical stability, then the small changes in binding affinity we measure should be proportional to the conformational entropy lost when the c-Myb helix folds and the inclusion of glycine mutants at three solvent exposed sites should amplify the differences[31]. The changes in helical stability and binding affinity we observe for the c-Myb mutants can be rationalized if we compare our results to some of the early studies of helical stability in model peptides and proteins[32]. In these studies, an alanine to glycine mutant changed helical stability by −1 kcal/mol in T4 lysozyme and almost −2 kcal/mol in a model peptide. For c-Myb the ΔΔG for binding to KIX of the alanine to glycine substitution is −0.77 kcal/mol, which is slightly smaller than expected. The leucine to glycine mutation at position 300 has ΔΔG of −0.99 kcal/mol and a leucine to glycine mutation in T4 lysozyme changed helical stability by −0.92 kcal/mol. The ΔΔG values we observe for the alanine to glycine mutants at positions 304 and 307 are −0.35 and −0.25 kcal/mol, respectively, which is not consistent with results from the model peptides.
One current model for c-Myb TAD binding to KIX involves a fast conformational equilibrium between unfolded and helical c-Myb TAD coupled to a binding step that yields the c-Myb:KIX complex[30] (Figure S3: Model1). This model is supported by NMR relaxation dispersion measurements[30] as well as by phi-value analysis[33], indicating that the c-Myb TAD helix displays a largely native conformation in the transition state for binding. Our mutagenesis data allows us to further test this model. The data for mutants L300, S304 and N307 is used for the analysis. Because these sites are exposed and uncharged and do not interact with KIX in the bound structure[30], they should only affect the conformational equilibrium (Kconf) and have very small effects on the bimolecular association constant Ko. Therefore, based on the relationship between the measured binding free energy and the conformational equilibrium (See Supplementary text, eq.6) a first prediction of the model is that the measured apparent binding constant (Kbind,app) should show a linear variation with helical propensity expressed as 1/(1+Kconf), with a slope equal to Ko (Figure S4). However, while the plot of the experimental data shows that Kbind,app generally increases as the average helicity increases (Figure S4), there is clearly no unique Ko value that can describe the data, which means a conformational equilibrium coupled to a unique binding reaction (Model 1) is insufficient to describe the system. A conformational step that follows binding could account for a second source of variation in Kbind,app (Figure S3: Model 2). However, if the mutated residues are considered to be non-interacting in the bound state, the binding enthalpy should show very low variations for all mutants. Inspection of Table 1 and Table S1 reveals that most ‘non-interacting’ mutants show variations of over 1 kcal/mol in the ΔH value (L300A, S304G, S304A, N307G, N307V, N307A) that exceed measurement error and suggest the presence of interaction patterns not represented in the known structure of the complex. The fact that A, V and G mutants where the hydrogen bonding pattern of the helix is predicted to be unaffected display this behavior, supports this hypothesis.
A further test to Model 1 can be performed using linkage analysis[34]. If there is a single bound state where positions 300, 304 and 307 are non-interacting and solvent exposed, mutations to these sites should not affect the interaction energy ΔGo (Supplementary text, eq.8). For this analysis, we compare Val-Gly and Ala-Gly mutations at the different sites using Gly as a reference state, as Gly substitutions at solvent-exposed sites are predicted to affect the folding equilibrium solely by increasing the conformational space accessible in the denatured state[31]. Because the sites are noninteracting, this model predicts the destabilization produced by a Val-Gly or Ala-Gly mutation is explained by changes in conformational entropy alone (Supplementary text, eq. 9–11) and is in the range ~ 1kcal/mol (ΩVal-Gly~3.3, ΩVal-Gly~4.2; ΔSconf = RTlnΩ)[15, 31]. Furthermore, for the same mutation the change in ΔGbind,app is predicted to be maximal when the helix is most unstable, and becomes zero when the helix is very stable (Figure S5)[34]. Therefore, the magnitude of change in binding energy for equivalent Val-Gly or Ala-Gly mutations is predicted to increase as one moves from stable positions in the helix (300) to regions of marginal stability (304, 307). However, the data show the exact opposite trend: ΔGbind,app for both Val-Gly and Ala-Gly mutations is larger at position 300 than at positions 304 and 307 (Table S1). For Val-Gly, the model predicts ~50% helicity at position 300 and ~80% helicity at position 307, opposite to the known relative intrinsic helicity at these positions.
These results indicate that Model 1 is incomplete and can be explained by considering an ensemble of alternative bound states displaying variable degrees of helical structure and different interaction sites with KIX. While one of these states is predominantly populated in wild type c-Myb TAD leading to the known bound structure, our mutagenesis results indicate that this state is in equilibrium with other alternative bound structures (Figure S3: Model 3). Our results provide quantitative thermodynamic support for the claim that the bound state is conformationally heterogeneous, and that the known structure of the complex represents only one of several bound states possible for the c-Myb:KIX complex. It is possible these alternative conformations also include binding at a secondary c-Myb binding site on KIX[30].
Materials and Methods
Expression and Purification of KIX
A codon optimized, cDNA fragment for the KIX domain of human CBP (residues 586–672) fused with a N-terminal six-histidine tag was obtained from Eurofins and cloned into pET-28a. This plasmid was transformed into E. coli BL21(DE3) cells and grown at 37 °C in minimal medium. Overnight cultures were used to start cultures at an OD600 of 0.04 and allowed to grow at 37 °C until an OD600 of 0.6. Cells were then induced with 1mM IPTG at 15 °C and incubated for 22 hours before harvesting cells by centrifugation at 7168 RCF for five minutes. Pellets were resuspended in phosphate buffer (PB1) containing 50 mM sodium phosphate, 300 mM sodium chloride, 10mM imidazole and 0.02 % sodium azide, pH 8 in the presence of one ThermoScientific Pierce™ protease inhibitor tablet. Resuspended cells were lysed using French pressure cell press and centrifuged at 18000 RCF for one hour. Soluble fraction of the lysate was passed through Ni-NTA column to purify the his-tagged KIX protein. Protein was eluted with 250 mM imidazole. Sample was exchanged into 50 mM sodium phosphate, 300 mM sodium chloride, 1 mM EDTA, 0.02 % sodium azide, pH 8 and incubated with thrombin at room temperature for 2 hours to cleave the his-tag. Cleaved protein was further applied to superdex 75 size exclusion column for final purification.
Expression and purification of WT c-Myb TAD and mutants
The cDNA for human WT c-Myb TAD (residues 275–327) sub-cloned into a modified pRSET-A vector with N-terminal GB1 and six-histidine tags was a kind gift from Dr. Jane Clarke, University of Cambridge. Mutant versions of c-Myb TAD were generated using the QuickChange kit from Agilent. WT and mutant human c-Myb TAD were expressed in C41(DE3) cells grown in M9 medium at 37 °C. Protein expression was induced at OD600 of 0.6 with 1mM IPTG. Induction times for WT and mutants varied between 3–6 hours. Cultures were harvested by centrifugation at 7168 RCF for five minutes. Pellets were re-suspended in PB1, lysed using a French press and centrifuged at 18000 RCF for one hour. The supernatant was loaded and purified with a Ni-NTA column using the same procedure for KIX purification as described above. Protein fractions eluted from nickel column were collected and exchanged with phosphate buffer containing 10 mM imidazole to dialyze the excess imidazole away and incubated with thrombin beads for three hours to cleave the GB1 and six histidine tags. Cleaved protein was applied through a second nickel column to separate the tags from c-Myb TAD protein. The sample was further purified using a superdex 75 size exclusion column. Protein fractions were dialyzed into appropriate buffers for CD, NMR, or ITC (see below).
Circular Dichroism
Far-UV CD spectra were measured using a JASCO J-815 spectropolarimeter at 25 °C. Protein solution at a concentration of 1mg/mL in 50 mM sodium phosphate, 50 mM sodium chloride, pH 6.8 was placed in a 0.1 mm path length cell and the spectra were acquired at a bandwidth of 1 nm and a scanning speed of 10 nm/min under constant purging with nitrogen. Two spectra were collected for each sample and averaged.
Nuclear magnetic resonance spectroscopy
NMR experiments were performed on uniformly 13C- 15N-labelled 0.2 – 0.5 mM samples of either c-Myb TAD or KIX at 25 °C and using a Varian VNMRS 800 MHz spectrometer equipped with triple resonance pulse field Z-axis gradient cold probe. To make the backbone resonance assignments, sensitivity enhanced 1H-15N HSQC and three-dimensional HNCO, CBCA(CO)NH, and HNCACB experiments[35–37] were performed on uniformly 13C- and 15N-labelled samples in 10 % D2O, 50 mM sodium phosphate buffer, 50 mM sodium chloride, 1 mM EDTA and 0.02 % sodium azide, pH 6.8. The c-Myb TAD HSQC used 9689.9Hz, and1024 increments for the t1 dimension and 1944.3 Hz with 128 increments for the t2. The HNCO used 9689.9, 3216.6, and 1944.3 Hz with 1024, 56, and 32 increments for the t1, t2, and t3 dimensions, respectively. The HNCACB used 9689.9, 14075.1, and 1944.3 Hz, with 1024, 128, and 32 increments for the t1, t2, and t3 dimensions, respectively. The CBCA(CO)NH used 9689.9, 14072.6, and 1944.3 Hz, with 1024, 70, and 32 increments for the t1, t2, and t3 dimensions, respectively. The KIX HSQC used 9689.9, and 2754.5 Hz, with 1024 and 128 increments, respectively. KIX assignments were made using a combination of previously published assignments that were confirmed using HNCA experiments[22]. The HNCA experiments for KIX used 9689.9, 6433.1, and 1944 Hz, with 1024, 64, and 32 increments, for the t1, t2, and t3 dimensions respectively.
All NMR spectra were processed using NMRFx and the data was analyzed using NMRViewJ[38, 39]. Assignment of the amide 1H, amide 15N, 13Cα 13Cβ and 13C′ resonances for WT c-Myb TAD, P289A, P289A/P316A, E292D, L300G, and L300P, were at least 90% complete. Assignment of the amide 1H and amide 15N chemical shifts for free KIX or KIX bound to WT c-Myb TAD, L300G, and L300P were at least 80% complete. Residue specific random coil chemical shifts were generated for WT and mutant peptides using the neighbor corrected IDP chemical shift library (ncIDP)[40]. To obtain the secondary chemical shifts (Δδ), random coil chemical shifts were subtracted from the measured chemical shifts. Residue specific secondary structure populations were obtained from δ2d analysis using the chemical shifts of amide 1H, amide 15N, 13Cα 13Cβ and 13C′[28]. The residue specific values of percent helicity from δ2d were used to calculate a mean value of percent helicity, which is the sum of the residue specific values divided by the total number of residues for which helicity values were calculated. The average amide proton and amide nitrogen chemical shifts for the KIX mapping experiments were calculated as [((Δ1H)2+(Δ15N/5)2)/2)]1/2
Isothermal Titration Calorimetry
All ITC experiments were performed on a GE Microcal VP-ITC machine in 50 mM sodium phosphate, 50 mM sodium chloride, 1 mM EDTA and 0.02 % sodium azide, pH 6.8. WT or mutant c-Myb TAD and KIX were co-dialyzed in the above-mentioned buffer and binding was measured at 25 °C with KIX loaded into the cell at a concentration 15 μM and WT or mutant c-Myb TAD loaded into the syringe at a concentration of 150 μM. L300G-KIX binding was measured at concentrations of 750 μM and 75 μM, respectively while L300P-KIX binding was measured at 1.5 mM and 150 μM, respectively. All ITC experiments were performed with 28, 10 μL injections at a flow rate of 0.5 μL/sec. Three runs were performed for each protein-ligand binding measurement and the average of the three runs is reported. Data was analyzed using the Origin 70 software and integrated ITC data was fit using a single-site binding model. Binding stoichiometries ranged from 0.85 – 1.0.
Supplementary Material
Highlights.
What is the relationship between fractional helicity and binding affinity for IDPs?
Mutagenesis was used to increase and decrease the fractional helicity of c-Myb TAD.
Increasing and decreasing fractional helicity over a broad range did not change the binding affinity to KIX.
Radical substitutions in the middle of the c-Myb TAD helix were necessary to reduce affinity.
The c-Myb TAD helix is at an optimum position in the equilibrium to minimize any energetic penalty associated with coupled folding and binding.
Acknowledgments
G.W.D. is supported by the National Institutes of Health (2R01CA14124406-A1 and 1R01GM115556-01A1).
We would like to thank Sameer Varma for help discussions during the revision stage and Reviewer 1 for suggesting a thermodynamic linkage model to help explain our results.
Footnotes
Publisher's Disclaimer: This is a PDF file of an unedited manuscript that has been accepted for publication. As a service to our customers we are providing this early version of the manuscript. The manuscript will undergo copyediting, typesetting, and review of the resulting proof before it is published in its final citable form. Please note that during the production process errors may be discovered which could affect the content, and all legal disclaimers that apply to the journal pertain.
References
- 1.Dyson HJ. Coupled Folding and Binding. In: Roberts GCK, editor. Encyclopedia of Biophysics. Berlin, Heidelberg: Springer Berlin Heidelberg; 2013. pp. 381–5. [Google Scholar]
- 2.Dyson HJ, Wright PE. Coupling of folding and binding for unstructured proteins. Curr Opin Struct Biol. 2002;12:54–60. doi: 10.1016/s0959-440x(02)00289-0. [DOI] [PubMed] [Google Scholar]
- 3.Gianni S, Dogan J, Jemth P. Coupled binding and folding of intrinsically disordered proteins: what can we learn from kinetics? Curr Opin Struct Biol. 2016;36:18–24. doi: 10.1016/j.sbi.2015.11.012. [DOI] [PubMed] [Google Scholar]
- 4.Wright PE, Dyson HJ. Linking folding and binding. Curr Opin Struct Biol. 2009;19:31–8. doi: 10.1016/j.sbi.2008.12.003. [DOI] [PMC free article] [PubMed] [Google Scholar]
- 5.Mendoza-Espinosa P, Garcia-Gonzalez V, Moreno A, Castillo R, Mas-Oliva J. Disorder-to-order conformational transitions in protein structure and its relationship to disease. Mol Cell Biochem. 2009;330:105–20. doi: 10.1007/s11010-009-0105-6. [DOI] [PubMed] [Google Scholar]
- 6.Shammas SL, Crabtree MD, Dahal L, Wicky BI, Clarke J. Insights into Coupled Folding and Binding Mechanisms from Kinetic Studies. J Biol Chem. 2016;291:6689–95. doi: 10.1074/jbc.R115.692715. [DOI] [PMC free article] [PubMed] [Google Scholar]
- 7.Oldfield CJ, Cheng Y, Cortese MS, Romero P, Uversky VN, Dunker AK. Coupled folding and binding with alpha-helix-forming molecular recognition elements. Biochemistry. 2005;44:12454–70. doi: 10.1021/bi050736e. [DOI] [PubMed] [Google Scholar]
- 8.Lee SH, Kim DH, Lee SH, Han JJ, Cha EJ, Lim JE, et al. Understanding Pre-Structured Motifs (PreSMos) in Intrinsically Unfolded Proteins. Curr Protein Pept Sci. 2011 doi: 10.2174/138920312799277974. [DOI] [PubMed] [Google Scholar]
- 9.Fuxreiter M, Simon I, Friedrich P, Tompa P. Preformed structural elements feature in partner recognition by intrinsically unstructured proteins. J Mol Biol. 2004;338:1015–26. doi: 10.1016/j.jmb.2004.03.017. [DOI] [PubMed] [Google Scholar]
- 10.Brown CJ, Johnson AK, Dunker AK, Daughdrill GW. Evolution and disorder. Curr Opin Struct Biol. 2011;21:441–6. doi: 10.1016/j.sbi.2011.02.005. [DOI] [PMC free article] [PubMed] [Google Scholar]
- 11.Sugase K, Dyson HJ, Wright PE. Mechanism of coupled folding and binding of an intrinsically disordered protein. Nature. 2007;447:1021–5. doi: 10.1038/nature05858. [DOI] [PubMed] [Google Scholar]
- 12.Spolar RS, Record MT., Jr Coupling of local folding to site-specific binding of proteins to DNA. Science. 1994;263:777–84. doi: 10.1126/science.8303294. [DOI] [PubMed] [Google Scholar]
- 13.Schulz GE. Protein-Nucleic Acid Interactions. In: Balaban M, editor. Molecular Mechanisms of Biological Recognition. Elsevier/North Holland Biomedical Press; 1979. pp. 79–94. [Google Scholar]
- 14.Teilum K, Olsen JG, Kragelund BB. Functional aspects of protein flexibility. Cell Mol Life Sci. 2009;66:2231–47. doi: 10.1007/s00018-009-0014-6. [DOI] [PMC free article] [PubMed] [Google Scholar]
- 15.D’Aquino JA, Gomez J, Hilser VJ, Lee KH, Amzel LM, Freire E. The magnitude of the backbone conformational entropy change in protein folding. Proteins. 1996;25:143–56. doi: 10.1002/(SICI)1097-0134(199606)25:2<143::AID-PROT1>3.0.CO;2-J. [DOI] [PubMed] [Google Scholar]
- 16.Borcherds W, Theillet FX, Katzer A, Finzel A, Mishall KM, Powell AT, et al. Disorder and residual helicity alter p53-Mdm2 binding affinity and signaling in cells. Nat Chem Biol. 2014;10:1000–2. doi: 10.1038/nchembio.1668. [DOI] [PubMed] [Google Scholar]
- 17.Crabtree MD, Borcherds W, Poosapati A, Shammas SL, Daughdrill GW, Clarke J. Conserved Helix-Flanking Prolines Modulate Intrinsically Disordered Protein:Target Affinity by Altering the Lifetime of the Bound Complex. Biochemistry. 2017;56:2379–84. doi: 10.1021/acs.biochem.7b00179. [DOI] [PMC free article] [PubMed] [Google Scholar]
- 18.Otieno S, Kriwacki R. Probing the role of nascent helicity in p27 function as a cell cycle regulator. PLoS One. 2012;7:e47177. doi: 10.1371/journal.pone.0047177. [DOI] [PMC free article] [PubMed] [Google Scholar]
- 19.Aurora R, Rose GD. Helix capping. Protein Sci. 1998;7:21–38. doi: 10.1002/pro.5560070103. [DOI] [PMC free article] [PubMed] [Google Scholar]
- 20.Lee C, Kalmar L, Xue B, Tompa P, Daughdrill GW, Uversky VN, et al. Contribution of proline to the pre-structuring tendency of transient helical secondary structure elements in intrinsically disordered proteins. Biochim Biophys Acta. 2014;1840:993–1003. doi: 10.1016/j.bbagen.2013.10.042. [DOI] [PubMed] [Google Scholar]
- 21.Lavu S, Reddy EP. Structural organization and nucleotide sequence of mouse c-myb oncogene: activation in ABPL tumors is due to viral integration in an intron which results in the deletion of the 5′ coding sequences. Nucleic Acids Res. 1986;14:5309–20. doi: 10.1093/nar/14.13.5309. [DOI] [PMC free article] [PubMed] [Google Scholar]
- 22.Zor T, De Guzman RN, Dyson HJ, Wright PE. Solution structure of the KIX domain of CBP bound to the transactivation domain of c-Myb. J Mol Biol. 2004;337:521–34. doi: 10.1016/j.jmb.2004.01.038. [DOI] [PubMed] [Google Scholar]
- 23.Shammas SL, Travis AJ, Clarke J. Remarkably Fast Coupled Folding and Binding of the Intrinsically Disordered Transactivation Domain of cMyb to CBP KIX. The journal of physical chemistry B. 2013;117:13346–56. doi: 10.1021/jp404267e. [DOI] [PMC free article] [PubMed] [Google Scholar]
- 24.Shammas SL, Travis AJ, Clarke J. Allostery within a transcription coactivator is predominantly mediated through dissociation rate constants. Proc Natl Acad Sci U S A. 2014;111:12055–60. doi: 10.1073/pnas.1405815111. [DOI] [PMC free article] [PubMed] [Google Scholar]
- 25.Wishart DS. Interpreting protein chemical shift data. Prog Nucl Magn Reson Spectrosc. 2011;58:62–87. doi: 10.1016/j.pnmrs.2010.07.004. [DOI] [PubMed] [Google Scholar]
- 26.Wishart DS, Sykes BD. Chemical shifts as a tool for structure determination. Methods Enzymol. 1994;239:363–92. doi: 10.1016/s0076-6879(94)39014-2. [DOI] [PubMed] [Google Scholar]
- 27.Wishart DS, Sykes BD, Richards FM. Relationship between nuclear magnetic resonance chemical shift and protein secondary structure. J Mol Biol. 1991;222:311–33. doi: 10.1016/0022-2836(91)90214-q. [DOI] [PubMed] [Google Scholar]
- 28.Camilloni C, De Simone A, Vranken WF, Vendruscolo M. Determination of secondary structure populations in disordered states of proteins using nuclear magnetic resonance chemical shifts. Biochemistry. 2012;51:2224–31. doi: 10.1021/bi3001825. [DOI] [PubMed] [Google Scholar]
- 29.Dyson HJ, Wright PE. Insights into the structure and dynamics of unfolded proteins from nuclear magnetic resonance. Adv Protein Chem. 2002;62:311–40. doi: 10.1016/s0065-3233(02)62012-1. [DOI] [PubMed] [Google Scholar]
- 30.Arai M, Sugase K, Dyson HJ, Wright PE. Conformational propensities of intrinsically disordered proteins influence the mechanism of binding and folding. Proc Natl Acad Sci U S A. 2015;112:9614–9. doi: 10.1073/pnas.1512799112. [DOI] [PMC free article] [PubMed] [Google Scholar]
- 31.Schrank TP, Elam WA, Li J, Hilser VJ. Strategies for the thermodynamic characterization of linked binding/local folding reactions within the native state application to the LID domain of adenylate kinase from Escherichia coli. Methods Enzymol. 2011;492:253–82. doi: 10.1016/B978-0-12-381268-1.00020-3. [DOI] [PMC free article] [PubMed] [Google Scholar]
- 32.Chakrabartty A, Baldwin RL. Stability of alpha-helices. Adv Protein Chem. 1995;46:141–76. [PubMed] [Google Scholar]
- 33.Giri R, Morrone A, Toto A, Brunori M, Gianni S. Structure of the transition state for the binding of c-Myb and KIX highlights an unexpected order for a disordered system. Proc Natl Acad Sci U S A. 2013;110:14942–7. doi: 10.1073/pnas.1307337110. [DOI] [PMC free article] [PubMed] [Google Scholar]
- 34.Ferreon JC, Hamburger JB, Hilser VJ. An experimental strategy to evaluate the thermodynamic stability of highly dynamic binding sites in proteins using hydrogen exchange. J Am Chem Soc. 2004;126:12774–5. doi: 10.1021/ja046255k. [DOI] [PubMed] [Google Scholar]
- 35.Kay LE, Keifer P, Saarinen T. Pure Absorption Gradient Enhanced Heteronuclear Single Quantum Correlation Spectroscopy with Improved Sensitivity. J Am Chem Soc. 1992;114:10663. [Google Scholar]
- 36.Muhandiram DR, Kay LE. Gradient-Enhanced Triple-Resonance Three-Dimensional NMR Experiments with Improved Sensitivity. Journal of Magnetic Resonance, Series B. 1994;103(3):203–16. [Google Scholar]
- 37.Wittekind M, Mueller L. HNCACB, a High-Sensitivity 3D NMR Experiment to Correlate Amide-Proton and Nitrogen Resonances with the Alpha- and Beta-Carbon Resonances in Proteins. Journal of Magnetic Resonance, Series B. 1993;101:201–5. [Google Scholar]
- 38.Johnson BAR, Blevins RA. NMRView: a computer program for the visualization and analysis of NMR data. J Biomol NMR. 1994;4:603–14. doi: 10.1007/BF00404272. [DOI] [PubMed] [Google Scholar]
- 39.Norris M, Fetler B, Marchant J, Johnson BA. NMRFx Processor: a cross-platform NMR data processing program. J Biomol NMR. 2016;65:205–16. doi: 10.1007/s10858-016-0049-6. [DOI] [PMC free article] [PubMed] [Google Scholar]
- 40.Tamiola K, Acar B, Mulder FA. Sequence-specific random coil chemical shifts of intrinsically disordered proteins. J Am Chem Soc. 2010;132:18000–3. doi: 10.1021/ja105656t. [DOI] [PubMed] [Google Scholar]
Associated Data
This section collects any data citations, data availability statements, or supplementary materials included in this article.


