Abstract
Objectives
To investigate a 4-week period of pain prevalence and the risk factors of experiencing pain among a rural Chinese population sample. To explore the psychosocial and health condition predictors of pain severity and the interactions of age and gender with these factors in real-life situations among the general adult population in China.
Methods
Data were collected from a random multistage sample of 2052 participants (response rate=95%) in the rural areas of Liuyang, China. Visual analogue scale was used to assess participants’ pain experienced and a series of internationally validated instruments to assess their sociodemographic characteristics, self-reported health status, depression symptoms, anxiety symptoms, sleep quality, self-efficacy and perceived stress.
Results
The pain prevalence over the 4-week period in rural China was 66.18% (62.84% for men and 68.82% for women). A logistic regression model revealed that being female (adjusted OR=1.58, 95% CI 1.24 to 2.02), age (adjusted OR=1.03, 95% CI 1.02 to 1.05), depressive symptoms (adjusted OR=1.07, 95% CI 1.02 to 1.13) and medium-quality sleep (adjusted OR=2.14, 95% CI 1.26 to 3.64) were significant risk factors for experiencing pain. General linear model analyses revealed that (1) pain severity of rural Chinese was related to self-rated physical health and social health; (2) the interactions of age, gender with employment status, depression symptoms, perceived stress and physical health were significant. Simple effect testing revealed that in different age groups, gender interacted with employment status, depression symptoms, perceived stress and physical health differently.
Conclusions
Improving physical and social health could be effective in reducing the severity of pain and the treatment of pain should be designed specifically for different ages and genders among the general population.
Keywords: pain management, adult anaesthesia, gender
Strengths and limitations of this study.
This study established the 4-week prevalence of pain among a Chinese rural population.
To the best of our knowledge, this is the first study reported which describes the psychosocial and health condition predictors on pain severity and the interactions of ages and genders in real-life situations among the general adult population.
The cross-sectional design of this study prevented the causes of pain to be determined.
Introduction
Pain is a public and clinical health concern. The annual prevalence of pain and chronic pain has been estimated to be 20% and 10% of the general population, respectively.1 2 To date, most studies on the prevalence of pain have been conducted in developed countries such as the USA,3–7 Canada,8–10 Australia,11–13 Britain14 and European countries.15–18 A few studies on the prevalence of pain in the Chinese population have primarily focused on residents in the large cities. For example, Jackson et al19 reported that the prevalence of pain and chronic pain was 42.2% and 25.8%, respectively, during a 6-month study period of the residents in Chongqing, China. Chen et al studied Chinese from both urban and rural areas and found that the prevalence of chronic pain over the past 6 months among women and men in China was 39.92% and 32.17%, respectively.20 The rural population in China comprises about half of China’s total population and have significantly lower income21 and inferior medical health services22 23 compared with the population living in urban areas. However, little is reported regarding the prevalence of pain experienced by the rural population in China.
Experiencing pain is a biopsychosocial process.1 The risk factors of experiencing pain throughout the general population include physiological and psychosocial factors. The physiological factors include genetics, injury and health status. The psychosocial factors include early life factors,24 female in gender,20 25 poor sleep,26–30 distressed mood (depression, anxiety),31 psychosocial environment (social suffering setting32), perceived stress,33 religion and self-efficacy (SE).34 35 The analysis of risk factors of pain among the rural residents in China is required for target people who are at a greater risk and planning and facilitating treatment across rural areas in China.
The exploration of differences in pain experienced across age groups and gender has been recommended by the International Association for the Study of Pain.36 However, different predictors of pain severity across age groups and genders have received little attention. Most epidemiological and experimental studies have indicated that older people11 37 38 and women39–41 are at greater risk of experiencing pain. However, the potentially different interactions of ages and genders with psychosocial status and health conditions on the severity of pain in real-life situation have not been adequately studied. To the best of our knowledge, few studies have been reported that consider the socioeconomic status (eg, employment vs unemployment) and mental health (such as depression symptoms, perceived stress) may interact differently across ages and genders, contributing to the severity of pain experienced.
This study reports a population-based survey across the rural areas of Liuyang City, Hunan province, China. The prevalence of pain among rural Chinese over a 4-week period was explored, and the risk factors of experiencing pain among this population were investigated. Further, the main effects and interactions of gender and age with psychosocial variables and three-dimensional health conditions on the severity of pain in real-life situation were explored. Significant differences of pain severity across ages and genders were hypothesised.
Methods
Patient and public involvement
No specific kinds of patients were involved. All the participants were general adult population in the rural areas of Liuyang. The informed consent was interpreted to the rural participants by the local guide and the survey was conducted with their agreement of the informed consent orally. The participants agreed that results of this study will be published in the form of essays or articles, and no personal information will be disclosed in any report.
Study design
Liuyang is a representative rural city of the Hunan province, China, and classified as one of the national development and reform pilot cities.42 Liuyang County, located in the centre of Hunan province, has a total population of 1.4235 million including people of Han nationality and 34 ethnic minorities. Liuyang has industries in grain production, raising pigs and black goats, and is the centre of fireworks production in China, with a history of fireworks production greater than 1400 years.43 Administratively, Liuyang is divided into four districts in the urban areas and 33 towns in the rural areas. Rural towns in Liuyang are similar to each other in respect of geography, population sizes, gender and age distributions, social structure, public health and healthcare services, making residents in these rural towns comparable.
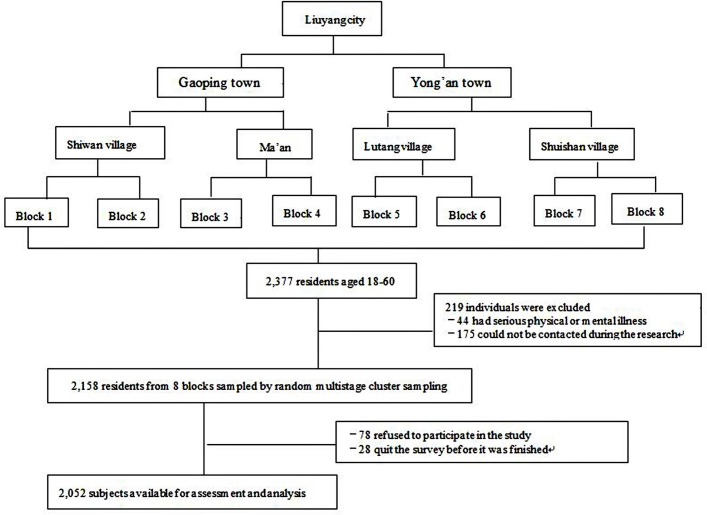
A cross-sectional survey of rural residents in Liuyang City was conducted from November 2010 to August 2011. As figure 1 showed, a three-stage stratified sample was used, consisting of (1) random sampling to select two towns from the 33 towns of Liuyang City according to the list of villages; (2) random sampling of two villages from each town; and (3) random sampling of two geographically natural blocks. Natural blocks were used to identify subjects. The target sample for this study comprised residents from eight geographically natural blocks. All adults in all households of the eight natural blocks were included in the final sample, with 2158 residents in total. The sample size is representative of the rural counties in Liuyang.
Figure 1.
Recruitment and follow-up of study participants.
Participants
The current household registration system (known as the Hukou System) implemented in China divides the residents into agricultural and non-agricultural residencies and established a rural-urban division.44 A household registration record officially identifies a person as a resident to be rural or urban according to the inheritance and geographic location. Rural areas are less developed in many ways, compared with urban areas, such as infrastructure, education and healthcare.
The target population in this study was rural residents aged above 18 years who had lived in the Liuyang County for over 6 months. We excluded subjects (1) they could not be contacted after three attempts by the local investigators sent by the research team; or (2) had a serious physical or mental illness that influenced the experience of pain. A total of 2377 participants were initially included in the study, of whom 219 were excluded. Seventy-eight people (2.8%) refused to participate, and 28 (1.3%) dropped out of the survey before it was completed. Therefore, 2052 valid responses (response rate=95%) were analysed.
Quality control
Interviewers included 12 graduates and three undergraduates from Central South University, all of whom underwent 2 days of centralised and unified training. The training included the content of the questionnaire, public health knowledge, and psychiatry and communication skills. All interviewers received this training so that they could administer the interview to the same standards.
Procedure
The investigation team visited each household and conducted face-to-face interviews. Each interview was comprised an initial interview and self-reported survey, and lasted approximately 1 hour for each participant. At the end of the survey, each participant received a thank you gift, such as a kitchen utensil. At the end of each day of interviews, a meeting was held to review the process, to check the quality of the questionnaires and to discuss any problems that had emerged during the interviews. All questionnaires were double-checked by two quality control specialists to ensure that there were no inconsistencies, missing items or errors, and then handed to one quality control specialist for a final check.
The survey
Initial interview
A short interview conducted for approximately 15 min consisted of the two parts:
Sociodemographic status
The participant was interviewed about his/her gender, age, highest level of education completed, employment status (unemployment denoted with 1, employment with 2), income and religion. Education was divided into 1=primary school or lower, 2=middle school, 3=high school and above. Employment was divided into two categories: employed and unemployed. Income was measured annually. Religion was defined as 1=religious, 2=non-religious.
Pain
Participants were asked by the interviewer whether they had experienced an episode of pain within the past 4 weeks (yes/no). If they were pain free, the interviewer recorded ‘0’. If they had experienced pain, their pain intensity over the past 4 weeks was assessed using a visual analogue scale (VAS), with ratings from 0 (no pain at all) to 10 (the worst pain imaginable) along a straight line. The VAS is a widely used measurement for the severity of pain and subjective experience45 46 and its reliability and validity have been tested and verified.47–49 The participant recalled the mean level of their pain severity during the past 4 weeks and selected the level that could best represent his/her pain severity on VAS. It has been reported in the literature that when recalled over a period of 1 or 4 weeks, the outcome was well correlated with daily momentary assessments.50–52 Long-term recall is significantly influenced by recall bias.53 54 Therefore, the participants were not asked to recall the severity of pain over a 4-week period. The recollection of pain across a 4-week period is an indicator of acute pain, which indicates the demands of public health concern and clinical health treatment.
Self-administrated assessment
After the interview, each participant filled out the following questionnaires.
Perceived health status
The Self-Rated Health Measurement Scale (SRHMS), developed and revised by Xu et al,55 includes 48 items, and has a Cronbach’s α coefficient of 0.93.56 The SRHMS assesses three dimensions of health: physical, mental and social. Physical health indicates one’s physical function. Mental health denotes emotional and cognitive health. Social health refers to social relationships and social networks, such as the level of communication between family members or the availability of a support network during times of need. The highest possible scores for physical, mental and social health are 170, 150 and 120, respectively, and a maximum overall score of 440.57 The higher the score obtained by a participant, the better his or her health was concluded to be. The SRHMS is not a diagnostic instrument, and there are no cut-points for delineating the different levels of health conditions.
Psychological variables
Depression symptoms were assessed using the Patient Health Questionnaire Depression Module (PHQ-9), a 9-item scale, with each item based on the criteria for depressive disorders listed in the Diagnostic and Statistical Manual of Mental Disorders (DSM-V).58 59 Each item is rated on a scale from 0 (‘not at all’) to 3 (‘nearly every day’)60 and the total score ranges from 0 to 27. The Chinese version of the PHQ-9 has a Cronbach’s α of 0.86.61 The results of the PHQ-9 may be used for the screening of depression severity with the scores of 0–4, 5–9, 10–14, 15–19 and 20–27, indicating none-minimal, slight, moderate, moderately severe and severe depression according to DSM-IV.
Anxious symptoms were assessed using the Generalized Anxiety Disorder scale (GAD), a 7-item scale developed by Spitzer et al.62 Each item is rated on a scale from 0 (‘not at all’) to 3 (‘nearly every day’).62 The scale was found to have excellent internal consistency, with a Cronbach’s α coefficient of 0.92.62 The GAD-7 has been used widely and well validated in general populations63 as well as psychiatric settings.64 Scores of 0–4, 5–9, 10–14 and ≥15 indicate none, slight, moderate and severe anxiety symptoms according to DSM-IV.
Global sleep quality was assessed by the VAS. The participant selected the point along a 10 cm horizontal line that best represented his/her overall sleep quality with ‘0’ (indicating the worst sleep quality) and ‘10’ (indicating the best sleep quality). The distance is measured from the left edge to the participant’s mark to reflect the subjective quality of sleep. We divided sleep quality into three categories based on the ratings: 0–3.33 defined as group 1 (poor sleep quality); 3.34–6.67 defined as group 2 (medium sleep quality); 6.68–10 (high sleep quality) defined as group 3.
SE was assessed using the General Self-Efficacy Scale (GSES), originally developed in German by Schwarzer and Jerusalem in 1979 and has been confirmed validated in multicultural settings.65 66 The scale consists of 10 statements, and the Cronbach’s α coefficient of the Chinese GSES was found to be between 0.89 and 0.92.67
Perceived stress was assessed using the Chinese edition of the Perceived Stress Scale (CPSS). Cohen et al developed the Perceived Stress Scale (PSS) as a stress measure.68 Originally, this self-reported scale comprised 14 items. A shortened 10-item version (PSS-10) is reported which is psychometrically superior to the original 14-item version, as it had higher validity and internal reliability compared with the PSS-14.69 The CPSS-10 was found to have a stable two-factor structure of satisfactory internal consistency and construct validity, with a Cronbach’s α coefficient of 0.70.70 Each item of the CPSS was rated on a 5-point scale, ranging from 1 to 5. The total scores of the CPSS were calculated by adding four reverse items and another six items. The possible total scores ranged from 10 to 50 (higher score indicating greater stress). There are no cut-points of the CPSS that indicate different levels of perceived stress.
Statistical analysis
Sample characteristics were described using basic descriptive statistics. Logistic regression analysis was used to identify the risk factors of experiencing pain. The dependent variable was experiencing pain versus being pain free. P values smaller than 0.05 were considered significant. Analyses were performed using SPSS V.18.0. Independent variables included: (1) sociodemographic variables, gender, age, income, degree of education, religious belief and employment status; (2) health condition status: physical, mental and social health; (3) psychological variables: PHQ-9 score, GAD-7 score, SE, perceived stress and sleep quality. Logistic regression was used to explore the factors related to experiencing pain. Sleep quality was set as the category variable.
A general linear model was used to explore the main effects and interactions of age and gender with other predictors on the severity of pain. The dependent variable was pain severity (y=1–10). The independent variables were the same as those in the logistic regression model. Any interactions found between age, gender and another predictor were further studied using simple effect tests. Age was divided into three groups (youth, middle aged and elderly). In each age group, the interactions between gender and other predictors were tested using pairwise comparisons.
Results
Sample characteristics
A total of 2052 participants (987 male, 1065 female) completed the interview process, with an overall response rate of 95.09%. The demographic characteristics of the sample are shown in table 1. There were more female (51.90%) participants than male participants (48.10%). In terms of age groups, 38.79% were young, 47.61% were middle aged and 13.60% were elderly. Most of the sample was of Han ethnicity (99.51%), married (90.98%) and non-religious (90.01%), while 90.9% was married/cohabiting; 84.75% of the sample was of low education (middle school and below) and 61.11% was employed full-time (43.42% employed in agriculture, 17.69% in non-agriculture). In 2009, the national rural poverty line was defined as below ¥1992/year. In the Hunan province in 2010, the average income per farmer was ¥5523/year. Income level was divided into three groups: low (¥1992/year or less), medium (¥1993–¥5523/year) and high (above ¥5524/year). A total of 241 participants (0.25%) were below the poverty level, 513 participants (25%) had medium income and 1298 (63.26%) had high income.
Table 1.
Sociodemographic characteristics of the sample (n=2052)
| Characteristics | n (%) |
| Gender | |
| Male | 987 (48.10) |
| Female | 1065 (51.90) |
| Age (years) | |
| 18–44 | 796 (38.79) |
| 45–59 | 977 (47.61) |
| 60 and above | 279 (13.60) |
| Ethnicity | |
| Han | 2042 (99.51) |
| Non-Han | 10 (0.49) |
| Education | |
| Illiterate | 47 (2.30) |
| Primary school or lower | 767 (37.40) |
| Middle school | 925 (45.10) |
| High school | 268 (13.10) |
| College or above | 45 (2.20) |
| Employment | |
| Unemployed | 797 (38.84) |
| Employed | 1254 (61.11) |
| Agriculture | 891 (43.42) |
| Non-agriculture | 363 (17.69) |
| Annual income (person/¥) | |
| 1992 or less | 241 (11.74) |
| 1993–5523 | 513 (25) |
| 5524 or greater | 1298 (63.26) |
| Marital status | |
| Never married | 145 (7.07) |
| Married/cohabiting | 1867 (90.98) |
| Divorced/separated/widowed | 40 (1.95) |
| Religion | |
| Yes | 205 (9.99) |
| No | 1847 (90.01) |
The psychological characteristics of the 2052 participants are presented in table 2. The participants’ mean score of sleep quality was 7.28±2.55. Their mean score for depression symptoms was 3.64±3.92, and a mean score of anxiety symptoms was 2.73±3.56. The mean±SD scores for physical, mental and social health were 142.58±18.68, 117.17±21.44 and 85.12±18.76, respectively. The mean scores for SE and perceived stress were 27.09±4.36 and 18.33±6.47, respectively.
Table 2.
Psychological characteristics of the participants (n=2052)
| Variable | Mean | SD |
| Sleep quality | 7.28 | 2.55 |
| PHQ-9 | 3.64 | 3.92 |
| GAD-7 | 2.73 | 3.56 |
| Health status | ||
| Physical health | 142.58 | 18.68 |
| Mental health | 117.17 | 21.44 |
| Social health | 85.12 | 18.76 |
| Self-efficacy | 27.09 | 4.36 |
| Perceived stress | 18.33 | 6.47 |
GAD-7, 7-item Generalized Anxiety Disorder scale; PHQ-9, Patient Health Questionnaire Depression Module.
Pain prevalence over the past 4 weeks in rural China
As the table 3 illustrated, the prevalence of experiencing pain across the 4-week period was 66.18% overall, 62.84% for men and 68.82% for women. The prevalence peaked at 81.00% in the oldest age group (60 years and above) with 71.30% for men and 87.80% for women. The average pain severity for men was 5.10, with an SD of 2.47. The average pain severity for women was 4.82, with an SD of 2.45. The oldest groups of both genders had the most intense pain severity.
Table 3.
Pain prevalence over the past 4 weeks according to different ages
| Age | Gender | Pain free | Experienced pain | 4-week prevalence rate |
Pain severity | |
| Mean | SD | |||||
| 18–44 (n=796) |
Male | 157 | 170 | 51.99 | 5.08 | 2.70 |
| Female | 182 | 287 | 61.19 | 4.51 | 2.46 | |
| Sum | 339 | 457 | 57.41 | 4.72 | 2.57 | |
| 45–59 (n=977) |
Male | 147 | 318 | 68.39 | 5.06 | 2.33 |
| Female | 155 | 357 | 69.73 | 4.99 | 2.37 | |
| Sum | 302 | 675 | 69.09 | 5.02 | 2.35 | |
| 60 and above (n=279) |
Male | 33 | 82 | 71.30 | 5.29 | 2.53 |
| Female | 20 | 144 | 87.80 | 5.00 | 2.60 | |
| Sum | 53 | 226 | 81.00 | 5.11 | 2.57 | |
| All ages | Male | 337 | 570 | 62.84 | 5.10 | 2.47 |
| Female | 357 | 788 | 68.82 | 4.82 | 2.45 | |
| n=2052 | Total | 694 | 1358 | 66.18 | 4.94 | 2.47 |
Risk factors for experiencing pain
The independent variable was pain free versus experiencing pain. The dependent variables include: health status (physical, mental and social health); sociodemographic cofounders and psychological cofounders. Crude ORs and adjusted ORs for experiencing pain were calculated. Sleep has been divided into a categorical variable, included as a dummy variable, and high-quality sleep was set as the reference group. As shown in table 4, gender (adjusted OR=1.58, 95% CI 1.24 to 2.02), age (adjusted OR=1.03, 95% CI 1.02 to 1.05), depressive symptoms (adjusted OR=1.07, 95% CI 1.02 to 1.13) and medium-quality sleep (adjusted OR=2.14, 95% CI 1.26 to 3.64) were significant risk factors for experiencing pain. Physical health (adjusted OR=0.92, 95% CI 0.90 to 0.93) was a protective factor against experiencing pain.
Table 4.
Risk factors of experiencing pain
| Variables | OR | aOR | aOR (95% CI) | P values | |
| Gender | 1.31 | 1.58 | 1.24 | 2.02 | 0.00 |
| Age | 1.03 | 1.03 | 1.02 | 1.05 | 0.00 |
| Education | 0.77 | 1.14 | 0.95 | 1.37 | 0.15 |
| Employment condition | 0.87 | 1.26 | 0.98 | 1.62 | 0.08 |
| Annual income | 1.00 | 1.00 | 1.00 | 1.00 | 0.65 |
| Religion | 0.59 | 0.93 | 0.62 | 1.38 | 0.71 |
| Physical health | 0.92 | 0.92 | 0.90 | 0.93 | 0.00 |
| Mental health | 0.96 | 0.99 | 0.99 | 1.00 | 0.16 |
| Social health | 0.98 | 1.01 | 1.00 | 1.01 | 0.08 |
| Depressive symptoms | 1.21 | 1.07 | 1.02 | 1.13 | 0.01 |
| Anxiety symptoms | 1.18 | 0.99 | 0.94 | 1.05 | 0.77 |
| Self-efficacy | 1.02 | 1.02 | 0.99 | 1.04 | 0.28 |
| Perceived stress | 1.06 | 0.99 | 0.97 | 1.02 | 0.56 |
| Sleep quality | |||||
| Poor-quality sleep | 4.04 | 1.49 | 0.87 | 2.53 | 0.15 |
| Medium-quality sleep | 2.25 | 2.14 | 1.26 | 3.64 | 0.01 |
aOR, adjusted OR; OR, crude OR.
Predictors of pain severity across different age groups and genders
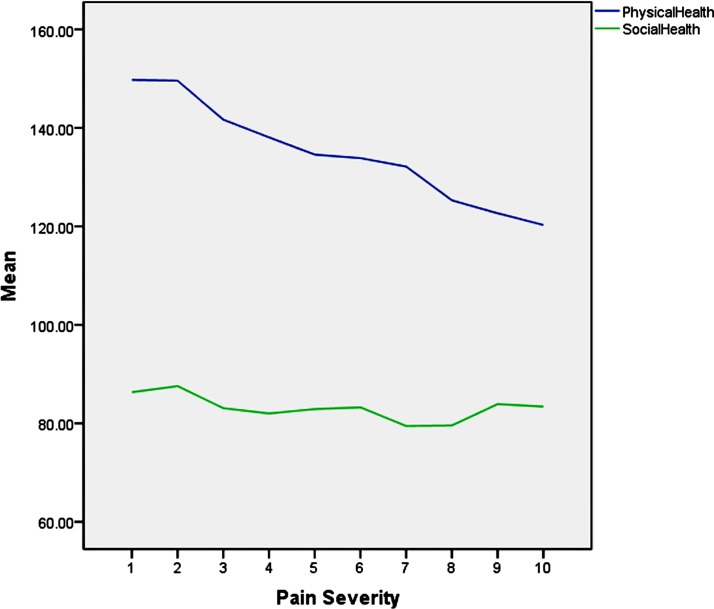
A general linear model was used to explore the main effects and interactions of age and gender with other predictors on the severity of pain. The dependent variable was pain intensity. The independent variables were the same as those used in the above logistic models. The results suggest that physical health and social health significantly influenced pain severity (table 5), while age, gender with employment status, depression symptoms, physical health and perceived stress interacted significantly. As figure 2 showed, physical health and social health related with pain severity negatively in the overall condition.
Table 5.
Tests of between-subjects effects
| Source | Type III sum of squares | df | Mean square | F | Significance |
| Corrected model | 2451.13 | 117 | 20.95 | 4.57 | 0.00 |
| Intercept | 772.01 | 1 | 772.01 | 168.31 | 0.00 |
| Gender | 7.87 | 1 | 7.87 | 1.72 | 0.19 |
| Age | 14.79 | 2 | 7.40 | 1.61 | 0.20 |
| Education | 0.49 | 2 | 0.24 | 0.05 | 0.95 |
| Employment | 3.56 | 1 | 3.56 | 0.78 | 0.38 |
| Annual income | 10.29 | 2 | 5.15 | 1.12 | 0.33 |
| Religion | 2.14 | 1 | 2.14 | 0.47 | 0.49 |
| Depression | 8.99 | 3 | 3.00 | 0.65 | 0.58 |
| Anxiety | 3.90 | 3 | 1.30 | 0.28 | 0.84 |
| Sleep | 14.44 | 2 | 7.22 | 1.57 | 0.21 |
| P-health | 684.25 | 1 | 684.25 | 149.18 | 0.00 |
| M-health | 14.54 | 1 | 14.54 | 3.17 | 0.08 |
| S-health | 31.94 | 1 | 31.94 | 6.96 | 0.01 |
| Stress | 0.01 | 1 | 0.01 | 0.00 | 0.97 |
| SE | 3.07 | 1 | 3.07 | 0.67 | 0.42 |
| Age*gender*education | 36.39 | 10 | 3.64 | 0.80 | 0.64 |
| Age*gender*employment | 53.72 | 5 | 10.75 | 2.34 | 0.04 |
| Age*gender*income | 63.99 | 10 | 6.40 | 1.40 | 0.18 |
| Age*gender*religion | 1.65 | 5 | 0.33 | 0.07 | 0.99 |
| Age*gender*depression | 131.14 | 14 | 9.37 | 2.04 | 0.01 |
| Age*gender*anxiety | 53.80 | 14 | 3.84 | 0.84 | 0.63 |
| Age*gender*sleep | 37.94 | 10 | 3.79 | 0.83 | 0.60 |
| Age*gender*P-health | 65.66 | 5 | 13.13 | 2.86 | 0.01 |
| Age*gender*M-health | 44.62 | 5 | 8.92 | 1.95 | 0.08 |
| Age*gender*S-health | 10.06 | 5 | 2.01 | 0.44 | 0.82 |
| Age*gender*stress | 52.68 | 5 | 10.54 | 2.30 | 0.04 |
| Age*gender*SE | 22.68 | 5 | 4.54 | 0.98 | 0.42 |
income, annual income; M-health, mental health; P-health, physical health; S-health, social health; SE, self-efficacy.
Figure 2.
The relationship between physical, social health and pain severity.
The three-factor interactions present were age*gender*employment, age*gender*depression, age*gender*p-health and age*gender*stress. The age was split into three groups and the simple effects of gender within each significant interaction of the other variables were explored in each age group. These tests are based on the estimable independent, linear pairwise comparisons between the estimated marginal means.
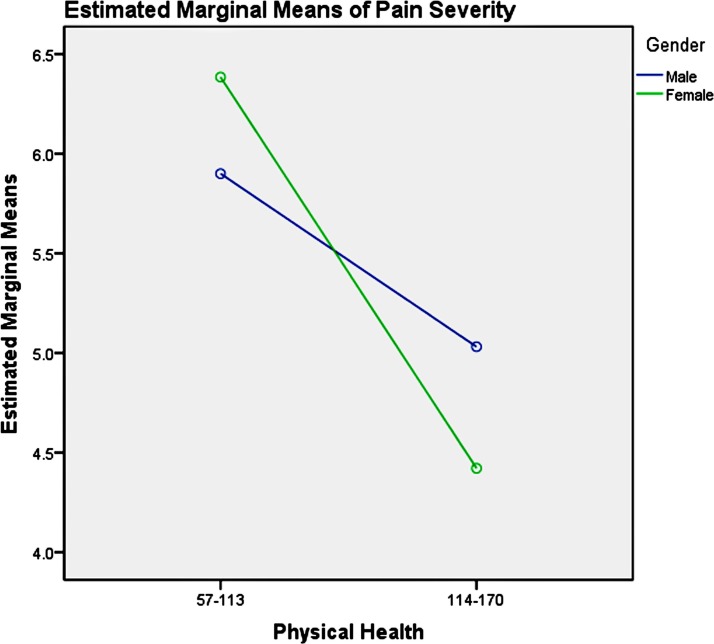
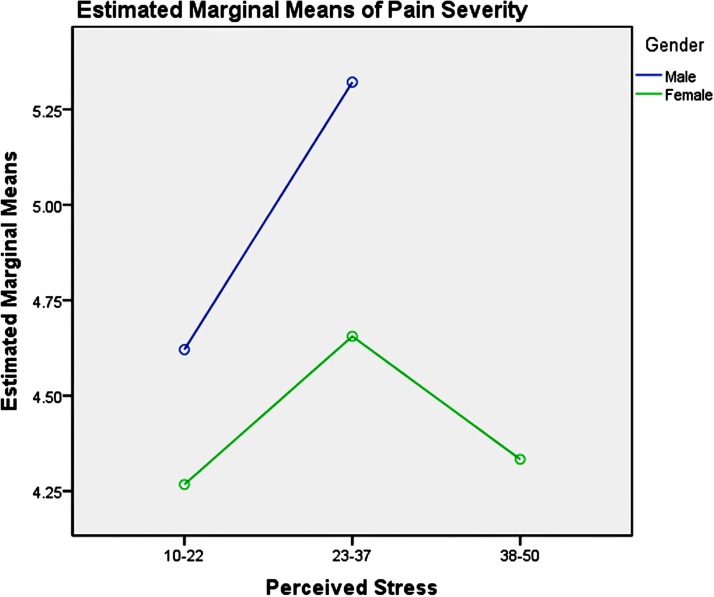
The divisions of age groups were made according to the WHO report from World Health Day 2012: Ageing and Health.71 Participants were divided into three groups: youth group (18–44 years old), middle-aged group (45–59 years old) and elderly group (60 and above years old). Depression symptoms were coded from y=1–4, based on moderate and above moderately severe, mild, slight and no depression symptoms. Anxiety symptoms were divided into y=1–4, based on moderate and above severe, mild, slight and no anxiety severity. Physical health was divided into three categories based on the scores: (1) scores of 0–56 were defined as 1 denoting poor physical health; (2) scores of 57–113 were defined as 2 denoting average physical health; (3) scores of 114–160 were defined as 3 denoting good physical health. Perceived stress was divided into three groups and scores of 10–22 represented lower stress, scores of 23–37 represented average stress and scores of 38–50 represented high stress.
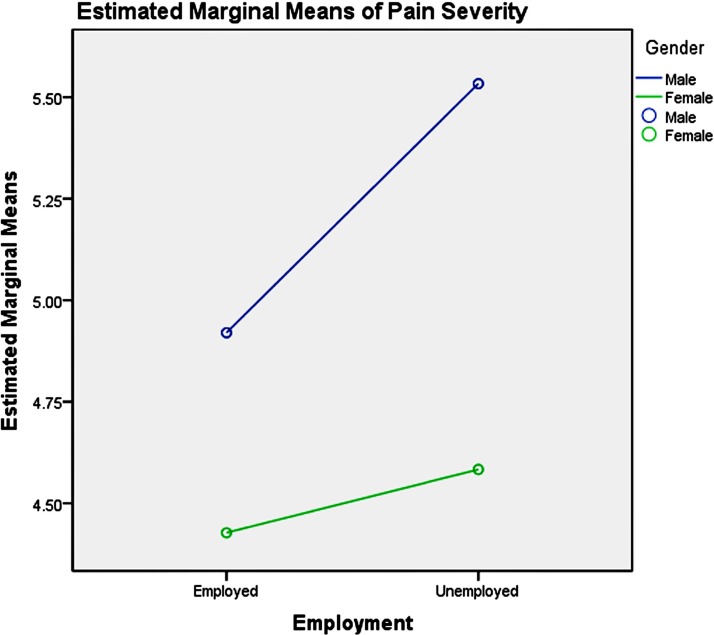
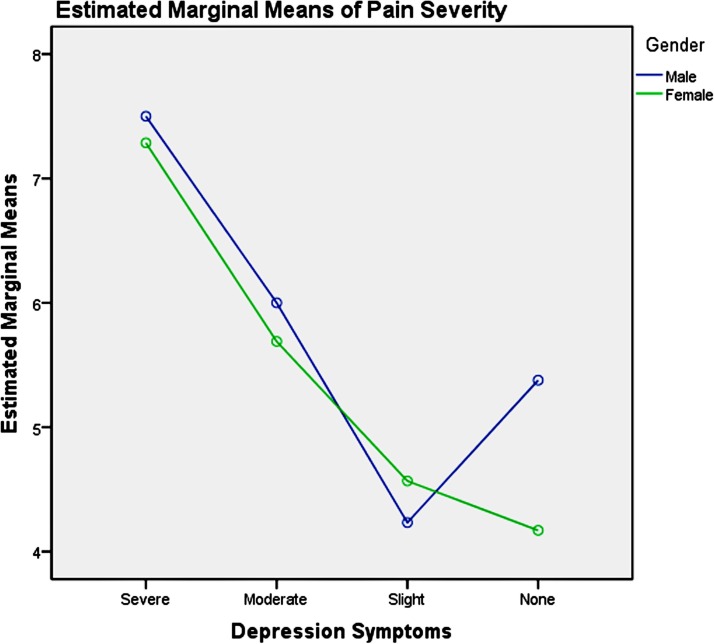
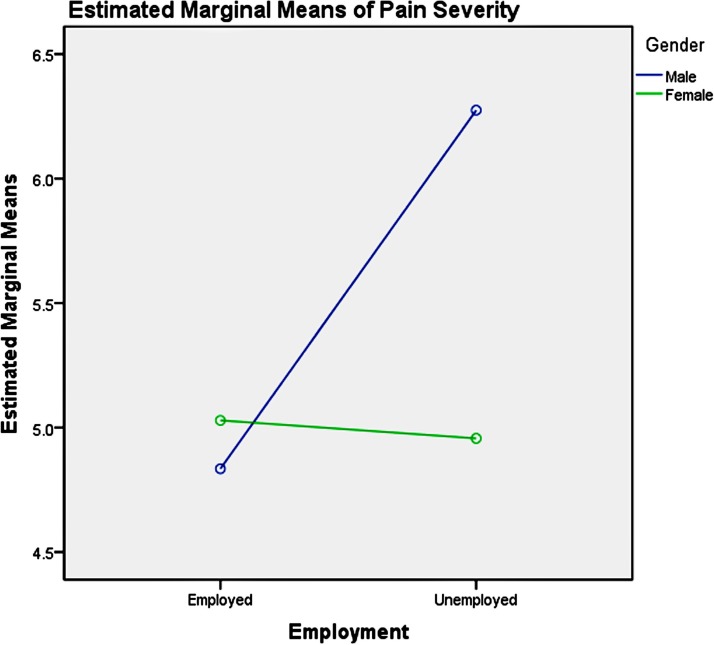
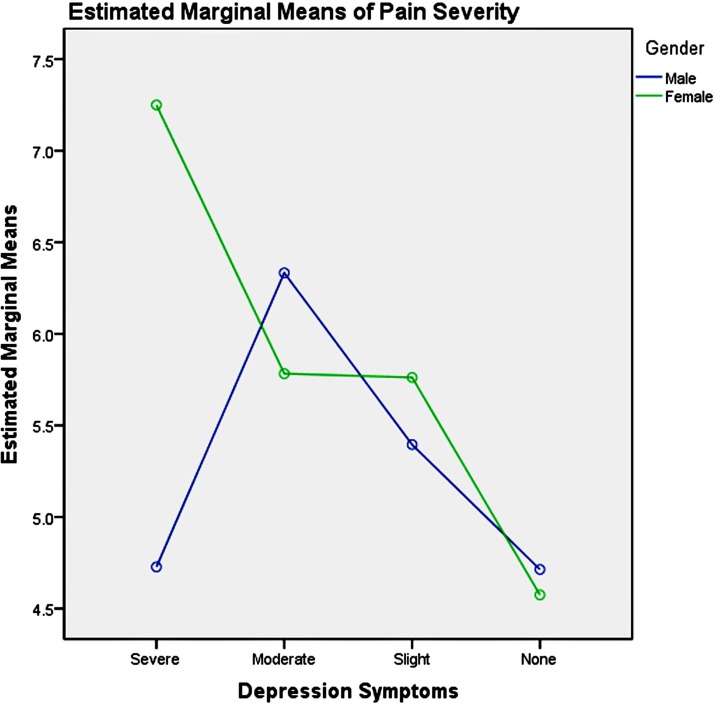
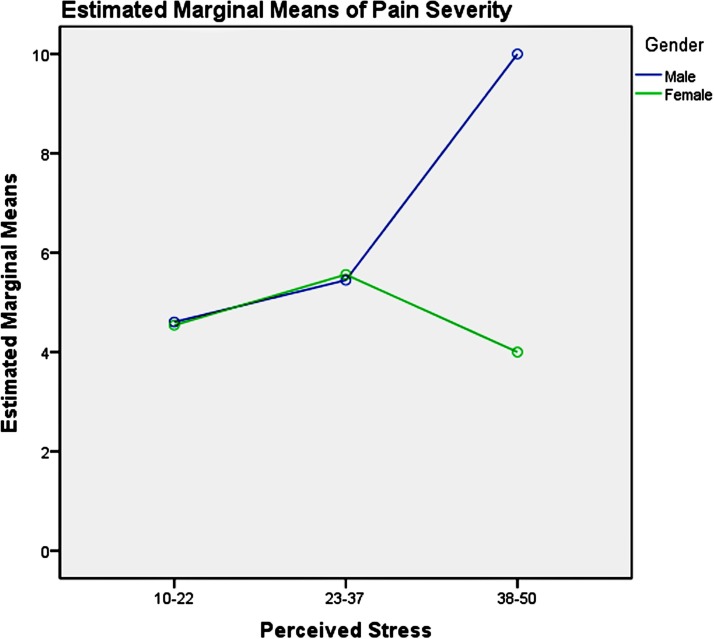
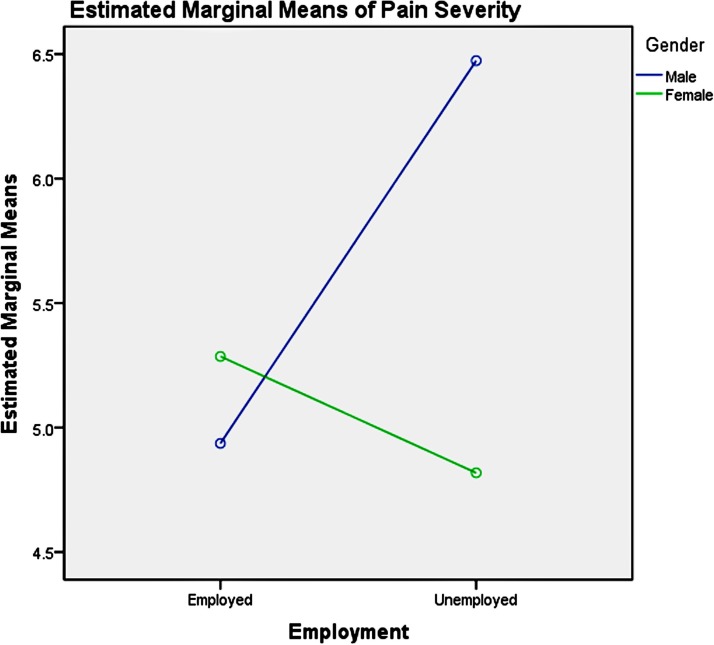
Among the youth group, pairwise comparisons revealed: (1) unemployment influenced men and women differently, as shown in table 6 and figure 3, which increased men’s pain intensity significantly; (2) the absence of depression could significantly decrease the pain severity in the young women, compared with men, as presented in table 7 and figure 4; (3) good physical health influenced women’s pain severity negatively, greater effect than that seen in men’s, which is shown in table 8 and figure 5; (4) average level stress increased young men’s pain intensity more dramatically than in women’s as shown in table 9 and figure 6.
Table 6.
Pairwise comparisons, youth group—employment
| Dependent variable: pain severity | |||||
| Employment | (I) Gender | (J) Gender | Mean difference | SE | Significance |
| Employed | 1 | 2 | 0.49 | 0.32 | 0.12 |
| Unemployed | 1 | 2 | 0.95* | 0.43 | 0.03 |
Based on estimated marginal means.
Note: simple effect analysis of gender and employment of youth group.
Figure 3.
Gender-employment effects on pain severity in youth.
Table 7.
Pairwise comparisons, youth group—depression
| Dependent variable: pain severity | |||||
| Depression | (I) Gender | (J) Gender | Mean difference | SE | Significance |
| Severe | 1 | 2 | 0.21 | 1.56 | 0.89 |
| Moderate | 1 | 2 | 0.31 | 0.77 | 0.69 |
| Slight | 1 | 2 | −0.36 | 0.42 | 0.43 |
| None | 1 | 2 | 1.21* | 0.32 | 0.00 |
Based on estimated marginal means.
Note: simple effect analysis of gender and depression symptoms of youth group.
Figure 4.
Gender and depression symptom effects on pain severity in youth.
Table 8.
Pairwise comparisons, youth group—P-health
| Dependent variable: pain severity | |||||
| P-health | (I) Gender | (J) Gender | Mean difference | SE | Significance |
| 57–113 | 1 | 2 | −0.49 | 1.07 | 0.65 |
| 114–170 | 1 | 2 | 0.61* | 0.25 | 0.02 |
Based on estimated marginal means.
Note: simple effect analysis of gender and physical health of youth group.
Figure 5.
Gender and physical health effects on pain severity in youth.
Table 9.
Pairwise comparisons, youth group—perceived stress
| Dependent variable: pain severity | |||||
| Perceived stress | (I) Gender | (J) Gender | Mean difference | SE | Significance |
| 10–22 | 1 | 2 | 0.35 | 0.42 | 0.40 |
| 23–37 | 1 | 2 | 0.67* | 0.31 | 0.03 |
| 38–50 | 1 | 2 | † | – | – |
Based on estimated marginal means.
†The level combination of factors in (I) is not observed.
Note: simple effect analysis of gender and perceived stress of youth group.
Figure 6.
Gender and perceived stress effects on pain severity in youth.
Among the middle-aged group, pairwise comparisons revealed: (1) unemployment influenced men and women differently, as table 10 and figure 7 showed, which significantly increased men’s pain severity; (2) severe depression symptoms could significantly increase the pain severity of the mid-aged women, compared with the men as shown in table 11 and figure 8; (3) the influence of physical health on gender in the middle-aged group was not significant as illustrated in table 12; (4) high stress could significantly increase middle-aged men’s pain severity, compared with that in women’s, which is shown in table 13 and figure 9.
Table 10.
Pairwise comparisons, middle-aged group—employment
| Dependent variable: pain severity | |||||
| Employment | (I) Gender | (J) Gender | Mean difference | SE | Significance |
| Employed | 1 | 2 | −0.19 | 0.23 | 0.39 |
| Unemployed | 1 | 2 | 1.32* | 0.37 | 0.00 |
Based on estimated marginal means.
Note: simple effect analysis of gender and employment of middle-aged group.
Figure 7.
Gender-employment effects on pain severity in the middle aged.
Table 11.
Pairwise comparisons, middle-aged group—depression
| Dependent variable: pain severity | |||||
| Depression | (I) Gender | (J) Gender | Mean difference | SE | Significance |
| Severe | 1 | 2 | −2.52* | 1.06 | 0.02 |
| Moderate | 1 | 2 | 0.55 | 0.62 | 0.38 |
| Slight | 1 | 2 | −0.37 | 0.36 | 0.30 |
| None | 1 | 2 | 0.14 | 0.22 | 0.53 |
Based on estimated marginal means
Note: simple effect analysis of gender and depression symptoms of middle-aged group.
Figure 8.
Gender and depression symptom effects on pain severity in the middle aged.
Table 12.
Pairwise comparisons, middle-aged group—P-health
| Dependent variable: pain severity | |||||
| P-health | (I) Gender | (J) Gender | Mean difference | SE | Significance |
| 0–56 | 1 | 2 | * | – | – |
| 57–113 | 1 | 2 | −1.02 | 0.60 | 0.09 |
| 114–170 | 1 | 2 | 0.07 | 0.18 | 0.71 |
Based on estimated marginal means.
*The level combination of factors in (I) is not observed.
Note: simple effect analysis of gender and physical health of middle-aged group.
Table 13.
Pairwise comparisons, middle aged group—perceived stress
| Dependent variable: pain severity | |||||
| Perceived stress | (I) Gender | (J) Gender | Mean difference | SE | Significance |
| 10–22 | 1 | 2 | 0.06 | 0.25 | 0.79 |
| 23–37 | 1 | 2 | −0.11 | 0.26 | 0.66 |
| 38–50 | 1 | 2 | 6.00* | 2.29 | 0.01 |
Based on estimated marginal means.
Figure 9.
Gender and perceived stress effects on pain severity in the middle aged.
Among the elderly group, pairwise comparisons revealed that unemployment influenced men and women differently, as shown in table 14 and figure 10, which significantly increased men’s pain severity. The influence of depression symptoms, physical health and perceived stress on gender in the elderly group was not significant, which was shown in tables 15–17, respectively.
Table 14.
Pairwise comparisons, elderly group—employment
| Dependent variable: pain severity | |||||
| Employment | (I) Gender | (J) Gender | Mean difference | SE | Significance |
| Employed | 1 | 2 | −0.35 | 0.47 | 0.46 |
| Unemployed | 1 | 2 | 1.66* | 0.65 | 0.01 |
Based on estimated marginal means.
Note: simple effect analysis of gender and employment of elderly group.
Figure 10.
Gender-employment effects on pain severity in the elderly.
Table 15.
Pairwise comparisons, middle-aged group—depression
| Dependent variable: pain severity | |||||
| Depression | (I) Gender | (J) Gender | Mean difference | SE | Significance |
| Severe | 1 | 2 | –* | – | – |
| Moderate | 1 | 2 | −0.57 | 0.98 | 0.56 |
| Slight | 1 | 2 | 0.63 | 0.64 | 0.33 |
| None | 1 | 2 | 0.12 | 0.47 | 0.81 |
Based on estimated marginal means.
Note: simple effect analysis of gender and depression symptoms of middle-aged group.
Table 16.
Pairwise comparisons, middle-aged group—P-health
| Dependent variable: pain severity | |||||
| P-health | (I) Gender | (J) Gender | Mean difference | SE | Significance |
| 57–113 | 1 | 2 | −0.04 | 0.95 | 0.97 |
| 114–170 | 1 | 2 | 0.51 | 0.36 | 0.16 |
Based on estimated marginal means.
Note: simple effect analysis of gender and physical health of middle-aged group.
Table 17.
Pairwise comparisons, middle-aged group—perceived stress
| Dependent variable: pain severity | |||||
| Perceived stress | (I) Gender | (J) Gender | Mean difference | SE | Significance |
| 10–22 | 1 | 2 | 0.30 | 0.48 | 0.53 |
| 23–37 | 1 | 2 | 0.07 | 0.54 | 0.91 |
| 38–50 | 1 | 2 | 3.00 | 2.75 | 0.28 |
Based on estimated marginal means.
Note: simple effect analysis of gender and perceived stress of middle-aged group.
Discussion
Pain prevalence in rural China
This study indicates that the pain prevalence among rural Chinese over a 4-week period was to be 66.18%, or 62.84% for men and 68.82% for women. The prevalence for both genders peaked in the oldest group (60 years and above). The pain prevalence of rural Chinese appeared to be higher than that previously reported for urban Chinese population,19 20 and higher than the pain prevalence of adults in the USA,7 Canada8 and Britain.14 However, the cited studies examined chronic pain (pain lasting ≥3 months) and could produce substantially lower prevalence rates compared with pain over a 4-week period.
Risk factors of experiencing pain
Being female, older age, reported depression symptoms and medium-quality sleep were found to be risk factors for experiencing pain. In this study, women were more likely to report experiencing pain, which is in agreement with the majority of reported studies.3 13 39 72–81 From social psychology and culture psychology perspectives, most men have internalised a pressure to invoke stereotypical masculine behaviours to maintain a sense of power and control when they encounter actual or perceived threats to their masculine status.82–84 Therefore, they may under-report their pain experiences when compared with women. Older participants were also more likely to experience pain, which may be due to their worse physical condition85 than younger participants. The result suggested that more attention should be focused on the treatment of pain in the elderly. Depressive symptoms were also a risk factor for experiencing pain, which is consistent with previous studies86 87 and suggests that more focus should be given to rural Chinese with depression symptoms. Medium-quality sleep improved the risk of experiencing pain, which suggests having sufficient and efficient sleep would be helpful of decreasing the risk of experiencing pain.
Factors related to pain severity across ages and genders
In this study, physical health and social health significantly impacted pain severity among the general population in rural China. Physical health significantly influenced pain intensity, which is in agreement with previous studies1 88 89 and common sense. The predictive role of social health on pain severity has not attracted attention by clinicians and scholars. In this study, social health referred to social ties and social support. The findings presented here indicated that enlarging social networks and improving social support could be an effective social approach to decreasing pain severity in adults.
There are significant interactions between age, gender and employment status, depression symptoms, physical health and perceived stress. The simple test effects indicated that unemployed male participants experienced more intense pain across all age groups, compared with women. Men are encouraged by culture and society to take economic responsibility to feed their families and to participate in social competition to gain success, which may result in more intense psychological pain for men when they are unemployed. Thus, having stable employment is important for decreasing men’s pain severity. Providing multiple job skills training to enhance men’s employability across all age groups and offering more employment information and opportunities for them may be a useful social approach to mitigate the severity of their mental pain and psychoache from unemployment. Average-level stress increased young men’s pain severity more dramatically than women’s. High-level stress could increase middle-aged men’s pain severity significantly compared with women’s. Reducing perceived stress may be helpful for the pain management and treatment of men, which could be achieved by reducing-stress therapy.90
It has been reported that depression symptoms influenced pain experienced.86 91–93 Our study revealed that female adults’ pain severity was much more entangled with depression symptoms in real-life situation. The absence of depression significantly decreased the pain severity in the young women, and severe depression symptoms significantly increased the pain severity in the middle-aged women. Treatment for depression symptoms may be effective for decreasing female’s pain severity, which could be achieved using medication or psychotherapy (such as cognitive– behavioural therapy94), or complementary therapy such as exercises or meditation. Good physical health condition could significantly decrease young women’s pain severity. For young women, improving their physical functioning could be a viable method for decreasing pain severity. This could be achieved by way of sports and exercise.
The factors related to pain severity differed across ages and genders, and therefore the treatment of pain across the general population should be designed with consideration for different ages and genders. Whether clinical pain treatments and analgesics should be customised for different genders and ages needs to be further explored.
Strengths and limitations
This study reported a 4-week prevalence of pain in rural China and the risk factors of experiencing pain of a rural Chinese sample. To our knowledge, this is the first study to explore the psychosocial and health condition predictors on pain severity and the interactions of gender and age with those variables in real-life situations. However, the study has a few limitations. First, our measurements of pain were not precise: we did not detail the site of pain, nor did we distinguish chronic pain from acute pain or physical pain from psychological pain. And the frequency of the pain experienced was not included in the study design, so how often the study subjects had experienced pain over the 4 weeks preceding the survey was not determined. Subjects could have experienced pain as frequently as every day or as rarely as just once in the span of 4 weeks. In future research, more detailed information (eg, pain duration, the frequency of pain and the pain sites) would be useful to refine the understanding of the various dimensions of pain. Another limitation is the cross-sectional design of the study, which precludes the induction of cause and effect and a potential causal relationship between independent variables and pain severity is inferred. In addition, the sample size only reflected the rural population of Liuyang, Hunan province and the findings of this study cannot be generalised to other rural counties in China. Future multicentres research is required to reflect the pain conditions of the rural population in China.
Conclusions
In conclusion, our study revealed that about two-thirds of adults in a rural Chinese sample experience pain over the course of 4 weeks and the predictors of pain severity differ significantly across ages and genders. Improving physical and social health could be effective in reducing the severity of pain, and the treatment of pain should be designed specifically for different ages and genders.
Supplementary Material
Acknowledgments
The authors thank the local guides for guiding them to visit each household in the rural areas of Liuyang, Hunan province, China.
Footnotes
Contributors: XKL, SYX, LZ, MH and HML contributed to the article. SYX and LZ designed the cross-sectional survey. MH and HML contributed to data collection. XKL drafted the manuscript conducting data analyses and SYX gave guidance on the paper. All the authors gave final approval to the version submitted for publication.
Funding: The study was funded by the National Science and Technology Support Program, China (No 2009BAI77B01; No 2009BAI77B08) and the China Medical Board (CMB No 14-188).
Competing interests: None declared.
Patient consent: Not required.
Ethics approval: The ethics approval was obtained from the Institutional Review Board of the School of Public Health, Central South University (No CSU-GW-2010-01).
Provenance and peer review: Not commissioned; externally peer reviewed.
Data sharing statement: Extra data are available from the corresponding author on reasonable request.
References
- 1. Gatchel RJ, Peng YB, Peters ML, et al. The biopsychosocial approach to chronic pain: scientific advances and future directions. Psychol Bull 2007;133:581–624. 10.1037/0033-2909.133.4.581 [DOI] [PubMed] [Google Scholar]
- 2. Goldberg DS, McGee SJ. Pain as a global public health priority. BMC Public Health 2011;11:1471–2458. 10.1186/1471-2458-11-770 [DOI] [PMC free article] [PubMed] [Google Scholar]
- 3. Johannes CB, Le TK, Zhou X, et al. The prevalence of chronic pain in United States adults: results of an Internet-based survey. J Pain 2010;11:1230–9. 10.1016/j.jpain.2010.07.002 [DOI] [PubMed] [Google Scholar]
- 4. Riskowski JL. Associations of socioeconomic position and pain prevalence in the United States: findings from the national health and nutrition examination survey. Pain Med 2014;15:1508–21. 10.1111/pme.12528 [DOI] [PubMed] [Google Scholar]
- 5. Taneja I, So S, Stewart JM, et al. Prevalence and severity of symptoms in a sample of African Americans and white participants. J Cult Divers 2015;22:50–8. [PMC free article] [PubMed] [Google Scholar]
- 6. Mansfield KE, Sim J, Jordan JL, et al. A systematic review and meta-analysis of the prevalence of chronic widespread pain in the general population. Pain 2016;157:55–64. 10.1097/j.pain.0000000000000314 [DOI] [PMC free article] [PubMed] [Google Scholar]
- 7. Nahin RL. Estimates of pain prevalence and severity in adults: United States, 2012. J Pain 2015;16:769–80. 10.1016/j.jpain.2015.05.002 [DOI] [PMC free article] [PubMed] [Google Scholar]
- 8. Schopflocher D, Taenzer P, Jovey R. The prevalence of chronic pain in Canada. Pain Res Manag 2011;16:445–50. 10.1155/2011/876306 [DOI] [PMC free article] [PubMed] [Google Scholar]
- 9. Van Den Kerkhof EG, Hopman WM, Towheed TE, et al. The impact of sampling and measurement on the prevalence of self-reported pain in Canada. Pain Res Manag 2003;8:157–63. 10.1155/2003/493047 [DOI] [PubMed] [Google Scholar]
- 10. Moulin DE, Clark AJ, Speechley M, et al. Chronic pain in Canada-prevalence, treatment, impact and the role of opioid analgesia. Pain Res Manag 2002;7:179–84. 10.1155/2002/323085 [DOI] [PubMed] [Google Scholar]
- 11. Currow DC, Agar M, Plummer JL, et al. Chronic pain in South Australia-population levels that interfere extremely with activities of daily living. Aust N Z J Public Health 2010;34:232–9. 10.1111/j.1753-6405.2010.00519.x [DOI] [PubMed] [Google Scholar]
- 12. Chen J, Devine A, Dick IM, et al. Prevalence of lower extremity pain and its association with functionality and quality of life in elderly women in Australia. J Rheumatol 2003;30:2689–93. [PubMed] [Google Scholar]
- 13. Blyth FM, March LM, Brnabic AJ, et al. Chronic pain in Australia: a prevalence study. Pain 2001;89:127–34. 10.1016/S0304-3959(00)00355-9 [DOI] [PubMed] [Google Scholar]
- 14. Fayaz A, Croft P, Langford RM, et al. Prevalence of chronic pain in the UK: a systematic review and meta-analysis of population studies. BMJ Open 2016;6:e010364 10.1136/bmjopen-2015-010364 [DOI] [PMC free article] [PubMed] [Google Scholar]
- 15. Breivik H, Collett B, Ventafridda V, et al. Survey of chronic pain in Europe: prevalence, impact on daily life, and treatment. Eur J Pain 2006;10:287–333. 10.1016/j.ejpain.2005.06.009 [DOI] [PubMed] [Google Scholar]
- 16. Branco JC, Bannwarth B, Failde I, et al. Prevalence of fibromyalgia: a survey in five European countries. Semin Arthritis Rheum 2010;39:448–53. 10.1016/j.semarthrit.2008.12.003 [DOI] [PubMed] [Google Scholar]
- 17. Langley PC. The prevalence, correlates and treatment of pain in the European Union. Curr Med Res Opin 2011;27:463–80. 10.1185/03007995.2010.542136 [DOI] [PubMed] [Google Scholar]
- 18. Macfarlane GJ, Pye SR, Finn JD, et al. Investigating the determinants of international differences in the prevalence of chronic widespread pain: evidence from the European male ageing study. Ann Rheum Dis 2009;68:690–5. 10.1136/ard.2008.089417 [DOI] [PubMed] [Google Scholar]
- 19. Jackson T, Chen H, Iezzi T, et al. Prevalence and correlates of chronic pain in a random population study of adults in Chongqing, China. Clin J Pain 2014;30:346–52. 10.1097/AJP.0b013e31829ea1e3 [DOI] [PubMed] [Google Scholar]
- 20. Chen B, Li L, Donovan C, et al. Prevalence and characteristics of chronic body pain in China: a national study. Springerplus 2016;5:938 10.1186/s40064-016-2581-y [DOI] [PMC free article] [PubMed] [Google Scholar]
- 21. Molero-Simarro R. Inequality in China revisited. The effect of functional distribution of income on urban top incomes, the urban-rural gap and the gini index, 1978–2015. China Economic Review 2017;42:101–17. 10.1016/j.chieco.2016.11.006 [DOI] [Google Scholar]
- 22. Xu H, Zhang W, Gu L, et al. Aging village doctors in five counties in rural China: situation and implications. Hum Resour Health 2014;12:36 10.1186/1478-4491-12-36 [DOI] [PMC free article] [PubMed] [Google Scholar]
- 23. Zhou XD, Li L, Hesketh T. Health system reform in rural China: voices of healthworkers and service-users. Soc Sci Med 2014;117:134–41. 10.1016/j.socscimed.2014.07.040 [DOI] [PubMed] [Google Scholar]
- 24. Macfarlane GJ. The epidemiology of chronic pain. Pain 2016;157:2158–9. 10.1097/j.pain.0000000000000676 [DOI] [PubMed] [Google Scholar]
- 25. Coggon D, Ntani G, Palmer KT, et al. Patterns of multisite pain and associations with risk factors. Pain 2013;154:1769–77. 10.1016/j.pain.2013.05.039 [DOI] [PMC free article] [PubMed] [Google Scholar]
- 26. Sivertsen B, Petrie KJ, Skogen JC, et al. Insomnia before and after childbirth: The risk of developing postpartum pain-a longitudinal population-based study. Eur J Obstet Gynecol Reprod Biol 2017;210:348–54. 10.1016/j.ejogrb.2017.01.020 [DOI] [PubMed] [Google Scholar]
- 27. Mork PJ, Nilsen TI. Sleep problems and risk of fibromyalgia: longitudinal data on an adult female population in Norway. Arthritis Rheum 2012;64:281–4. 10.1002/art.33346 [DOI] [PubMed] [Google Scholar]
- 28. Boardman HF, Thomas E, Millson DS, et al. The natural history of headache: predictors of onset and recovery. Cephalalgia 2006;26:1080–8. 10.1111/j.1468-2982.2006.01166.x [DOI] [PubMed] [Google Scholar]
- 29. Odegård SS, Sand T, Engstrøm M, et al. The long-term effect of insomnia on primary headaches: a prospective population-based cohort study (HUNT-2 and HUNT-3). Headache 2011;51:570–80. 10.1111/j.1526-4610.2011.01859.x [DOI] [PubMed] [Google Scholar]
- 30. Choy EH. The role of sleep in pain and fibromyalgia. Nat Rev Rheumatol 2015;11:513–20. 10.1038/nrrheum.2015.56 [DOI] [PubMed] [Google Scholar]
- 31. Lerman SF, Rudich Z, Brill S, et al. Longitudinal associations between depression, anxiety, pain, and pain-related disability in chronic pain patients. Psychosom Med 2015;77:333–41. 10.1097/PSY.0000000000000158 [DOI] [PubMed] [Google Scholar]
- 32. Nordgren LF, Banas K, MacDonald G. Empathy gaps for social pain: why people underestimate the pain of social suffering. J Pers Soc Psychol 2011;100:120–8. 10.1037/a0020938 [DOI] [PubMed] [Google Scholar]
- 33. White RS, Jiang J, Hall CB, et al. Higher perceived stress scale scores are associated with higher pain intensity and pain interference levels in older adults. J Am Geriatr Soc 2014;62:2350–6. 10.1111/jgs.13135 [DOI] [PMC free article] [PubMed] [Google Scholar]
- 34. Turk DC, Okifuji A. Psychological factors in chronic pain: evolution and revolution. J Consult Clin Psychol 2002;70:678–90. 10.1037/0022-006X.70.3.678 [DOI] [PubMed] [Google Scholar]
- 35. Jackson T, Wang Y, Wang Y, et al. Self-efficacy and chronic pain outcomes: a meta-analytic review. J Pain 2014;15:800–14. 10.1016/j.jpain.2014.05.002 [DOI] [PubMed] [Google Scholar]
- 36. Racine M, Castarlenas E, de la Vega R, et al. Sex differences in psychological response to pain in patients with fibromyalgia syndrome. Clin J Pain 2015;31:425–32. 10.1097/AJP.0000000000000132 [DOI] [PubMed] [Google Scholar]
- 37. Thomas E, Peat G, Harris L, et al. The prevalence of pain and pain interference in a general population of older adults: cross-sectional findings from the North Staffordshire Osteoarthritis Project (NorStOP). Pain 2004;110:361–8. 10.1016/j.pain.2004.04.017 [DOI] [PubMed] [Google Scholar]
- 38. Wong WS, Fielding R. Prevalence and characteristics of chronic pain in the general population of Hong Kong. J Pain 2011;12:236–45. 10.1016/j.jpain.2010.07.004 [DOI] [PubMed] [Google Scholar]
- 39. Fillingim RB, King CD, Ribeiro-Dasilva MC, et al. Sex, gender, and pain: a review of recent clinical and experimental findings. J Pain 2009;10:447–85. 10.1016/j.jpain.2008.12.001 [DOI] [PMC free article] [PubMed] [Google Scholar]
- 40. Myers CD, Tsao JC, Glover DA, et al. Sex, gender, and age: contributions to laboratory pain responding in children and adolescents. J Pain 2006;7:556–64. 10.1016/j.jpain.2006.01.454 [DOI] [PubMed] [Google Scholar]
- 41. Robinson ME, Riley JL, Myers CD, et al. Gender role expectations of pain: relationship to sex differences in pain. J Pain 2001;2:251–7. 10.1054/jpai.2001.24551 [DOI] [PubMed] [Google Scholar]
- 42. Baidu. Liuyang. 2017. http://baike.baidu.com/link?url=sGeotSfR1sfKtjAmcZ0x5Lx34TN_wS3icZTPOSkY5UsgTYjxOpx1x2aFFk9B-IKGJCXmKn3XzOSc5KW0oonJRb5ox9IqxIyNzyP5MEyImO3
- 43. Wikepedia. Liuyang. 2017. https://en.wikipedia.org/wiki/Liuyang
- 44. Wikepedia. Hukou system. 2018. https://en.wikipedia.org/wiki/Hukou_system
- 45. Myles PS, Troedel S, Boquest M, et al. The pain visual analog scale: is it linear or nonlinear? Anesth Analg 1999;89:1517. [DOI] [PubMed] [Google Scholar]
- 46. Phan NQ, Blome C, Fritz F, et al. Assessment of pruritus intensity: prospective study on validity and reliability of the visual analogue scale, numerical rating scale and verbal rating scale in 471 patients with chronic pruritus. Acta Derm Venereol 2012;92:502–7. 10.2340/00015555-1246 [DOI] [PubMed] [Google Scholar]
- 47. Price DD, McGrath PA, Rafii A, et al. The validation of visual analogue scales as ratio scale measures for chronic and experimental pain. Pain 1983;17:45–56. 10.1016/0304-3959(83)90126-4 [DOI] [PubMed] [Google Scholar]
- 48. Dimitriadis Z, Strimpakos N, Kapreli E, et al. Validity of visual analog scales for assessing psychological states in patients with chronic neck pain. J Musculoskelet Pain 2014;22:242–6. 10.3109/10582452.2014.907852 [DOI] [Google Scholar]
- 49. Appukuttan D, Vinayagavel M, Tadepalli A. Utility and validity of a single-item visual analog scale for measuring dental anxiety in clinical practice. J Oral Sci 2014;56:151–6. 10.2334/josnusd.56.151 [DOI] [PubMed] [Google Scholar]
- 50. Perrot S, Rozenberg S, Moyse D, et al. Comparison of daily, weekly or monthly pain assessments in hip and knee osteoarthritis. A 29-day prospective study. Joint Bone Spine 2011;78:510–5. 10.1016/j.jbspin.2010.11.009 [DOI] [PubMed] [Google Scholar]
- 51. Jamison RN, Raymond SA, Slawsby EA, et al. Pain assessment in patients with low back pain: comparison of weekly recall and momentary electronic data. J Pain 2006;7:192–9. 10.1016/j.jpain.2005.10.006 [DOI] [PubMed] [Google Scholar]
- 52. Mendoza TR, Dueck AC, Bennett AV, et al. Evaluation of different recall periods for the US national cancer institute’s PRO-CTCAE. Clin Trials 2017;14:255–63. 10.1177/1740774517698645 [DOI] [PMC free article] [PubMed] [Google Scholar]
- 53. Stull DE, Leidy NK, Parasuraman B, et al. Optimal recall periods for patient-reported outcomes: challenges and potential solutions. Curr Med Res Opin 2009;25:929–42. 10.1185/03007990902774765 [DOI] [PubMed] [Google Scholar]
- 54. Rasmussen CDN, Holtermann A, Jørgensen MB. Recall bias in low back pain among workers: effects of recall period and individual and work-related factors. Spine 2017. 10.1097/BRS.0000000000002457 [DOI] [PMC free article] [PubMed] [Google Scholar]
- 55. Jun X, Binhui W, Minyan H. The develoment and evaluation of self-rated health measurement scale-prior test version. Chinese Journal of Behavioral Medical Science 2000;9:65–8. [Google Scholar]
- 56. Xu J, Tan J, Wang Y, et al. Evaluation of the self-rated health measurement scale-the revised version 1.0. Chinese Mental Health Journal 2003;17:301–5. [Google Scholar]
- 57. Xu J, Xie Y, Li B, et al. The study of validity on self-rated health measurement scale-the revised version 1.0. Chinese Journal of Clinical Rehabilitation 2002;6:2082–5. [Google Scholar]
- 58. Fried EI, Nesse RM, Zivin K, et al. Depression is more than the sum score of its parts: individual DSM symptoms have different risk factors. Psychol Med 2014;44:2067–76. 10.1017/S0033291713002900 [DOI] [PMC free article] [PubMed] [Google Scholar]
- 59. Zimmerman M. Symptom severity and guideline-based treatment recommendations for depressed patients: implications of DSM-5’s potential recommendation of the PHQ-9 as the measure of choice for depression severity. Psychother Psychosom 2012;81:329–32. 10.1159/000342262 [DOI] [PubMed] [Google Scholar]
- 60. Chen TM, Huang FY, Chang C, et al. Using the PHQ-9 for depression screening and treatment monitoring for Chinese Americans in primary care. Psychiatr Serv 2006;57:976–81. 10.1176/ps.2006.57.7.976 [DOI] [PubMed] [Google Scholar]
- 61. Wang W, Bian Q, Zhao Y, et al. Reliability and validity of the Chinese version of the Patient Health Questionnaire (PHQ-9) in the general population. Gen Hosp Psychiatry 2014;36:539–44. 10.1016/j.genhosppsych.2014.05.021 [DOI] [PubMed] [Google Scholar]
- 62. Spitzer RL, Kroenke K, Williams JB, et al. A brief measure for assessing generalized anxiety disorder: the GAD-7. Arch Intern Med 2006;166:1092–7. 10.1001/archinte.166.10.1092 [DOI] [PubMed] [Google Scholar]
- 63. Löwe B, Decker O, Müller S, et al. Validation and standardization of the Generalized Anxiety Disorder Screener (GAD-7) in the general population. Med Care 2008;46:266–74. 10.1097/MLR.0b013e318160d093 [DOI] [PubMed] [Google Scholar]
- 64. Beard C, Björgvinsson T. Beyond generalized anxiety disorder: psychometric properties of the GAD-7 in a heterogeneous psychiatric sample. J Anxiety Disord 2014;28:547–52. 10.1016/j.janxdis.2014.06.002 [DOI] [PubMed] [Google Scholar]
- 65. Franckowiak BA, Glick DF. The effect of self-efficacy on treatment. J Addict Nurs 2015;26:62–70. 10.1097/JAN.0000000000000073 [DOI] [PubMed] [Google Scholar]
- 66. Luszczynska A, Scholz U, Schwarzer R. The general self-efficacy scale: multicultural validation studies. J Psychol 2005;139:439–57. 10.3200/JRLP.139.5.439-457 [DOI] [PubMed] [Google Scholar]
- 67. Leung DY, Leung AY. Factor structure and gender invariance of the Chinese general self-efficacy scale among soon-to-be-aged adults. J Adv Nurs 2011;67:1383–92. 10.1111/j.1365-2648.2010.05529.x [DOI] [PubMed] [Google Scholar]
- 68. Cohen S, Kamarck T, Mermelstein R. A global measure of perceived stress. J Health Soc Behav 1983;24:385–96. 10.2307/2136404 [DOI] [PubMed] [Google Scholar]
- 69. Chaaya M, Osman H, Naassan G, et al. Validation of the Arabic version of the cohen perceived stress scale (PSS-10) among pregnant and postpartum women. BMC Psychiatry 2010;10:1471–1244. 10.1186/1471-244X-10-111 [DOI] [PMC free article] [PubMed] [Google Scholar]
- 70. Ng SM. Validation of the 10-item Chinese perceived stress scale in elderly service workers: one-factor versus two-factor structure. BMC Psychol 2013;1:9 10.1186/2050-7283-1-9 [DOI] [PMC free article] [PubMed] [Google Scholar]
- 71. WHO. World health day 2012 - Ageing and health. Geneva: WHO, 2012. [Google Scholar]
- 72. Hashmi JA, Davis KD. Deconstructing sex differences in pain sensitivity. Pain 2014;155:10–13. 10.1016/j.pain.2013.07.039 [DOI] [PubMed] [Google Scholar]
- 73. Hardt J, Jacobsen C, Goldberg J, et al. Prevalence of chronic pain in a representative sample in the United States. Pain Med 2008;9:803–12. 10.1111/j.1526-4637.2008.00425.x [DOI] [PubMed] [Google Scholar]
- 74. Maia Costa Cabral D, Sawaya Botelho Bracher E, Dylese Prescatan Depintor J, et al. Chronic pain prevalence and associated factors in a segment of the population of São Paulo City. J Pain 2014;15:1081–91. 10.1016/j.jpain.2014.07.001 [DOI] [PubMed] [Google Scholar]
- 75. Cho NH, Jung YO, Lim SH, et al. The prevalence and risk factors of low back pain in rural community residents of Korea. Spine 2012;37:2001–10. 10.1097/BRS.0b013e31825d1fa8 [DOI] [PubMed] [Google Scholar]
- 76. Jackson T, Thomas S, Stabile V, et al. Prevalence of chronic pain in low-income and middle-income countries: a systematic review and meta-analysis. Lancet 2015;385(Suppl 2):S10 10.1016/S0140-6736(15)60805-4 [DOI] [PubMed] [Google Scholar]
- 77. Schneider S, Randoll D, Buchner M. Why do women have back pain more than men? A representative prevalence study in the federal republic of Germany. Clin J Pain 2006;22:738–47. 10.1097/01.ajp.0000210920.03289.93 [DOI] [PubMed] [Google Scholar]
- 78. Son KM, Cho NH, Lim SH, et al. Prevalence and risk factor of neck pain in elderly Korean community residents. J Korean Med Sci 2013;28:680–6. 10.3346/jkms.2013.28.5.680 [DOI] [PMC free article] [PubMed] [Google Scholar]
- 79. Mapplebeck JC, Beggs S, Salter MW. Sex differences in pain: a tale of two immune cells. Pain 2016;157(Suppl 1):S2–6. 10.1097/j.pain.0000000000000389 [DOI] [PubMed] [Google Scholar]
- 80. Bouhassira D, Lantéri-Minet M, Attal N, et al. Prevalence of chronic pain with neuropathic characteristics in the general population. Pain 2008;136:380–7. 10.1016/j.pain.2007.08.013 [DOI] [PubMed] [Google Scholar]
- 81. Torrance N, Smith BH, Bennett MI, et al. The epidemiology of chronic pain of predominantly neuropathic origin. Results from a general population survey. J Pain 2006;7:281–9. 10.1016/j.jpain.2005.11.008 [DOI] [PubMed] [Google Scholar]
- 82. Berke DS, Reidy DE, Miller JD, et al. Take it like a man: gender-threatened men’s experience of gender role discrepancy, emotion activation, and pain tolerance. Psychol Men Masc 2016;18:62–9. 10.1037/men0000036 [DOI] [Google Scholar]
- 83. Moore TM, Stuart GL. A review of the literature on masculinity and partner violence. Psychol Men Masc 2005;6:46–61. 10.1037/1524-9220.6.1.46 [DOI] [Google Scholar]
- 84. Vandello JA, Bosson JK. Hard won and easily lost: a review and synthesis of theory and research on precarious manhood. Psychol Men Masc 2013;14:101–13. 10.1037/a0029826 [DOI] [Google Scholar]
- 85. Landmark BT, Gran SV, Kim HS. Pain and persistent pain in nursing home residents in Norway. Res Gerontol Nurs 2013;6:47–56. 10.3928/19404921-20121204-01 [DOI] [PubMed] [Google Scholar]
- 86. Han C, Pae CU. Pain and depression: a neurobiological perspective of their relationship. Psychiatry Investig 2015;12:1–8. 10.4306/pi.2015.12.1.1 [DOI] [PMC free article] [PubMed] [Google Scholar]
- 87. Wiech K, Tracey I. The influence of negative emotions on pain: behavioral effects and neural mechanisms. Neuroimage 2009;47:987–94. 10.1016/j.neuroimage.2009.05.059 [DOI] [PubMed] [Google Scholar]
- 88. Parreira PC, Maher CG, Latimer J, et al. Can patients identify what triggers their back pain? Secondary analysis of a case-crossover study. Pain 2015;156:1913–9. 10.1097/j.pain.0000000000000252 [DOI] [PMC free article] [PubMed] [Google Scholar]
- 89. Bernfort L, Gerdle B, Rahmqvist M, et al. Severity of chronic pain in an elderly population in Sweden-impact on costs and quality of life. Pain 2015;156:521–7. 10.1097/01.j.pain.0000460336.31600.01 [DOI] [PubMed] [Google Scholar]
- 90. Johnson AC, Greenwood-Van Meerveld B. Stress-induced pain: a target for the development of novel therapeutics. J Pharmacol Exp Ther 2014;351:327–35. 10.1124/jpet.114.218065 [DOI] [PMC free article] [PubMed] [Google Scholar]
- 91. Keefe FJ, Wilkins RH, Cook WA, et al. Depression, pain, and pain behavior. J Consult Clin Psychol 1986;54:665–9. 10.1037/0022-006X.54.5.665 [DOI] [PubMed] [Google Scholar]
- 92. Li JX. Pain and depression comorbidity: a preclinical perspective. Behav Brain Res 2015;276:92–8. 10.1016/j.bbr.2014.04.042 [DOI] [PMC free article] [PubMed] [Google Scholar]
- 93. Pinheiro MB, Ferreira ML, Refshauge K, et al. Genetics and the environment affect the relationship between depression and low back pain: a co-twin control study of Spanish twins. Pain 2015;156:496–503. 10.1097/01.j.pain.0000460330.56256.25 [DOI] [PubMed] [Google Scholar]
- 94. Burns JW, Nielson WR, Jensen MP, et al. Specific and general therapeutic mechanisms in cognitive behavioral treatment of chronic pain. J Consult Clin Psychol 2015;83:1–11. 10.1037/a0037208 [DOI] [PubMed] [Google Scholar]
Associated Data
This section collects any data citations, data availability statements, or supplementary materials included in this article.


