

Abstract
The chemotherapeutic drug methotrexate inhibits the enzyme DHFR (dihydrofolate reductase)1, which generates tetrahydrofolate (THF), an essential cofactor in nucleotide synthesis2. Depletion of THF causes cell death by suppressing DNA and RNA production3. While methotrexate is widely used as an anti-cancer agent and the subject of over a thousand ongoing clinical trials4, its high toxicity often leads to the premature termination of its use, diminishing its potential efficacy5. To identify genes that modulate the response of cancer cells to methotrexate, we performed a CRISPR/Cas9-based screen6,7. This screen yielded FTCD, which encodes an enzyme (formimidoyltransferase cyclodeaminase) needed for the catabolism of the amino acid histidine8, a process not previously linked to methotrexate sensitivity. In cultured cancer cells, depletion of multiple genes in the histidine catabolism pathway dramatically decreased sensitivity to methotrexate. Mechanistically, histidine catabolism drains the cellular pool of THF, which is particularly detrimental to methotrexate-treated cells. Moreover, expression of the rate-limiting enzyme in histidine catabolism is associated with methotrexate sensitivity in cancer cell lines and with survival rate in patients. In vivo dietary supplementation of histidine increased flux through the histidine degradation pathway and enhanced the sensitivity of leukemia xenografts to methotrexate. Thus, the histidine degradation pathway significantly influences the sensitivity of cancer cells to methotrexate and may be exploited to improve methotrexate efficacy through a simple dietary intervention.
To identify genes that contribute to the response of cancer cells to methotrexate, we performed a genome-wide, positive-selection CRISPR/Cas9-based screen6,7 in the erythroleukemia cell line HEL. We selected this cell line for its high sensitivity to methotrexate in a competitive growth assay of 42 hematopoietic cell lines in the presence of methotrexate (Fig. 1a, Extended Data Fig. 1a-c). We focused our efforts on hematopoietic cell lines because methotrexate is most commonly used to treat hematopoietic malignancies9. The two highest-scoring10 genes in the screen were SLC19A1 and FTCD (Fig. 1b, Extended Data Fig. 1d,e). SLC19A1 is a reduced folate transporter that imports methotrexate into cells and whose depletion reduces methotrexate sensitivity in cultured cells11 and in patient tumors12,13.
Figure 1. Loss of FTCD decreases the sensitivity of cancer cells to methotrexate.

a. Selection of the HEL cell line for the CRISPR/Cas9-based screen. The genomes of 42 hematopoietic cancer cell lines were individually barcoded. The cell lines were pooled together and treated with 0, 0.1, 0.5 and 5 μM methotrexate for 6 days. Genomic barcodes were sequenced to determine the relative representation of each line in the mixed culture at the various methotrexate concentrations. The erythroleukemia HEL cell line was identified as a sensitive cell line suitable for a genome-wide, positive-selection CRISPR/Cas9-based screen. b. The two top hits in the CRISPR/Cas9-based screen6,7 were SLC19A1 and FTCD. Genes were ranked by the difference between their CRISPR score10 in the methotrexate-treated and the vehicle-treated samples. c-e. Targeting FTCD by CRISPR/Cas9 in HEL cells decreased their sensitivity to methotrexate c. Fold change in the methotrexate EC90s of HEL cells treated with methotrexate for 5 days and stably expressing the indicated constructs. Methotrexate EC90s are relative to wild-type (WT) cells (n=3, except for SLC19A1 where n=2, biological replicates). d. HEL cells stably expressing the indicated constructs were counted daily to assess their survival following treatment with 5 μM methotrexate (n=3, biological replicates). e. DIC images of HEL cells stably expressing the indicated constructs and treated with 5 μM methotrexate for three days. Scale bar = 100 μm. Presented is a representative experiment (n=3). f. Loss of FTCD decreased the sensitivity of additional cell lines (Ramos and LAMA84) to methotrexate. Shown are fold changes in the EC90s of methotrexate and the control drug, doxorubicin, compared to WT cells (n=3, biological replicates, ordinary one-way ANOVA, comparing sgFTCD to each of the other samples. For doxorubicin all p values were non-significant).
Abbreviations: sgAAVS – cells stably expressing an sgRNA targeting the non-coding AAVS locus6,7. sgFTCD – cells stably expressing an sgRNA targeting FTCD. mFTCD – cells stably expressing mouse Ftcd cDNA that is not targeted by the sgRNA used in this experiment. sgSLC19A1 – cells stably expressing an sgRNA targeting SLC19A1.
FTCD is an enzyme involved in histidine catabolism and has not been previously associated with methotrexate sensitivity. Depletion of FTCD using two distinct sgRNAs increased the EC90 (90% of maximal effective concentration) of methotrexate by more than 10-fold relative to controls (Fig. 1c-e). Importantly, expression of the murine Ftcd cDNA, which is resistant to sgRNA-mediated targeting, re-sensitized FTCD-depleted cells to methotrexate, validating the results of our screen (Fig. 1c-f). RNAi-mediated knockdown of FTCD also increased the EC90 of methotrexate (Extended Data Fig. 1f, g), suggesting that even subtle reductions in FTCD expression are sufficient to alter methotrexate sensitivity. CRISPR/Cas9-mediated depletion of FTCD also decreased the sensitivity of Ramos (Burkitt’s lymphoma) and LAMA84 (chronic myeloid leukemia) cells to methotrexate (Fig. 1f, Extended Data Fig. 1h), demonstrating that our findings are generalizable to cell lines derived from additional hematopoietic malignancies.
FTCD catalyzes two reactions in the histidine degradation pathway14 (Fig. 2a, Extended Data Fig. 2a). The formimidoyltransferase (FT) domain metabolizes THF and the histidine breakdown product formiminoglutamic acid (FIGLU) to produce glutamate and 5-formimino THF. The cyclodeaminase (CD) domain further metabolizes 5-formimino THF to 5,10-methenyl THF14. We profiled FTCD-relevant metabolites in FTCD-depleted HEL and Ramos cells using liquid chromatography and mass spectrometry (LC/MS). Depletion of FTCD increased the levels of histidine (Fig. 2b top, Extended Data Fig. 2b), and decreased those of 5,10-methenyl THF (Fig. 2b middle, Extended Data Fig. 2b) and the downstream metabolite 5-formyl THF (Fig. 2b bottom, Extended Data Fig. 2b). The modest decline in 5,10-methenyl THF is likely due to an additional pool of this metabolite, synthesized by the enzyme methylenetetrahydrofolate dehydrogenase 1 (MTHFD1). This pool of 5,10-methenyl THF is directly channeled to 10-formyl THF by MTHFD1 and is unlikely to serve as a substrate for the buildup of 5-formyl THF15. These data indicate that FTCD depletion decreases flux through the histidine degradation pathway.
Figure 2. FTCD depletion enables cancer cells to maintain THF pools and nucleotide synthesis even when treated with methotrexate.

a. The histidine degradation pathway. FTCD has two functions in the histidine degradation pathway. The FT domain metabolizes THF and the histidine breakdown product FIGLU to produce glutamate and 5-formimino THF, and the CD domain metabolizes 5-formimino THF to 5,10-methenyl THF14. b. CRISPR/Cas9-induced FTCD depletion increased levels of histidine (top), decreased levels of 5-formyl THF (bottom) in HEL and Ramos cells, and decreased levels of 5,10-methenyl THF in HEL cells and slightly decreased levels of 5,10-methenyl THF in Ramos cells (middle). c. Utilization of THF by the purine synthesis pathway (left cycle), the TMP synthesis pathway (right external cycle), the methyl cycle (right internal cycle), and by FTCD. 5,10-methenyl THF is metabolized to 5-formyl THF by the enzyme SHMT26–28. d. Greater cellular pool of THF and significantly higher abundance of nucleotides in methotrexate-treated cells following FTCD depletion. THF (top), IMP (middle) and TTP (bottom) levels were measured by LC/MS in vehicle- and methotrexate-treated HEL and Ramos cells. e. Newly-synthesized IMP (top) and TTP (bottom) in FTCD-depleted, methotrexate-treated cells shown by [U-13C] serine labeling. IMP and TTP fractional labeling is shown for vehicle-treated and methotrexate-treated HEL and Ramos cells. Right – the four carbons that are contributed to IMP or the one carbon contributed to TTP by [U-13C] serine. b, d, e - n=3, biological replicates. b, d - one-way ANOVA. e - two-way ANOVA for the unlabeled fractions.
Abbreviations: ns – non significant. SHMT – serine hydroxymethyltransferase. TYMS – thymidylate synthase. DHFR – dihydrofolate reductase. MTHFR – Methylene tetrahydrofolate reductase. MS – Methionine synthase. GART – GAR formyltransferase. AICART – AICAR formyltransferase. IMP – inosine monophosphate. TTP – thymidine triphosphate.
Methotrexate treatment causes a decrease in the cellular pool of THF, which inhibits nucleotide synthesis and is considered the main cause of cell death following treatment3. Utilization of THF by FTCD results in the synthesis of 5-formyl THF, a folate entity that has no described role as an enzyme cofactor and is considered a storage form of folate16 (Fig. 2c, Extended Data Fig. 2d). We hypothesized that the consumption of THF by FTCD for the synthesis of 5-formyl THF would be particularly harmful to cells in which the THF pool is already limiting, such as in methotrexate-treated cells. Indeed, depletion of the FTCD gene resulted in significantly higher levels of THF in methotrexate-treated cells (Fig. 2d top, Extended Data Fig. 2c, 3c, d), indicating that FTCD utilization of THF contributes to the exhaustion of THF pools observed in wild-type cells treated with methotrexate.
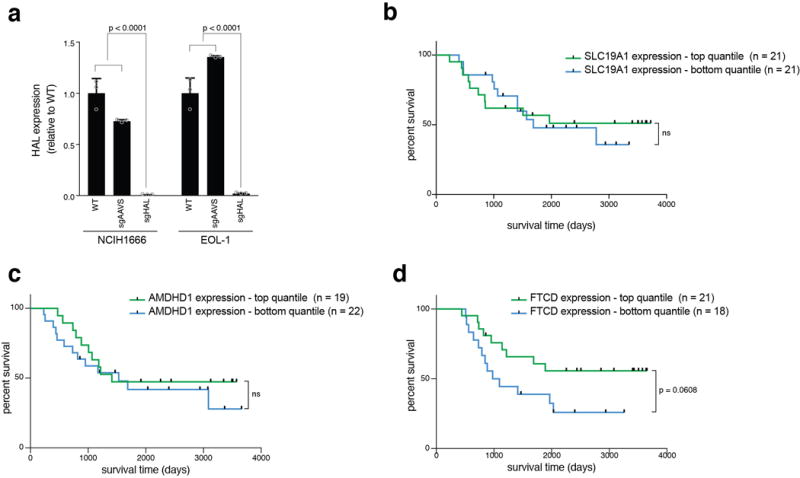
Figure 3. The histidine degradation pathway affects the sensitivity of cancer cells to methotrexate and HAL expression is associated with treatment response in acute lymphoblastic leukemia (ALL) patients.

a. CRISPR/Cas9-induced HAL depletion decreased the sensitivity of HEL and Ramos cells to methotrexate. Shown is the average fold change in the methotrexate EC90 relative to WT (n=2, biological replicates, one-way ANOVA, as multiple comparisons between sgHAL and each of the other samples). b. Greater cellular pool of THF in methotrexate-treated cells following HAL depletion. Top - THF levels were measured by LC/MS in vehicle- and methotrexate-treated HEL and Ramos cells. Newly synthesized adenosine monophosphate (AMP, middle) and TTP (bottom) in HAL-depleted and control cells, treated with methotrexate, shown by [U-13C] serine labeling (n=3, biological replicates, for THF - one-way ANOVA, for AMP and TTP two-way ANOVA for the unlabeled fraction) c. HAL expression is significantly higher in cells that are more sensitive to methotrexate. The response to methotrexate was determined in a pooled fashion using genomically barcoded cell lines (Fig. 1a). HAL expression was measured by qPCR (n=4 for resistant cell lines and n=6 for sensitive cell lines, biologically independent samples, KS test). d-e. Differences in HAL expression are associated with methotrexate sensitivity in cancer cell lines. d. Cell lines were ranked by HAL expression according to RNAseq data21. Green - cell lines with high HAL expression. Blue - cell lines with low HAL expression. e. HAL expression (by qPCR) and methotrexate EC90 are shown for each of the colored cell lines from Fig. 3d (Low HAL - n=3, high HAL - n=7, KS test, individual EC90 values: n=2, biological replicates). f. CRISPR/Cas9- depletion of HAL in EOL-1 and NCIH1666 cells decreased their sensitivity to methotrexate. Shown are fold changes in methotrexate EC90 compare to WT (n=2, biological replicate, one-way ANOVA). g. HAL expression predicts better survival in pediatric ALL patients treated with a regimen that included methotrexate. Kaplan-Meier curves of overall survival of ALL patients with high (top quantile, green) or low (bottom quantile, blue) expression of HAL24 (n=21).
We observed significantly higher levels of IMP and TTP following methotrexate treatment in FTCD-depleted cells compared to control cells (Fig. 2d middle and bottom), suggesting that the increased THF pool size in these cells contributes to nucleotide biosynthesis. To examine the ability of methotrexate-treated, FTCD-depleted cells to synthesize nucleotides, we used [U-13C] serine to label newly synthesized nucleotides in cells treated with methotrexate. Loss of FTCD significantly increased the labeling of IMP and TTP in methotrexate-treated cells (Fig. 2e), without changing the overall labeling efficiency (Extended Data Fig. 2e,f), or the cellular pools of glycine and serine (Extended Data Fig. 3a,b). These results suggest that FTCD depletion enables the survival of methotrexate-treated cells by sparing cellular THF pools, and thus allowing de novo nucleotide synthesis to continue.
To determine the contribution of other components of the histidine degradation pathway (Fig. 2a) to methotrexate sensitivity, we genetically targeted histidine ammonia lyase (HAL) and amidohydrolase domain containing 1 (AMDHD1), two histidine degradation pathway enzymes that function upstream of FTCD17–19. Similar to our findings with FTCD, CRISPR/Cas9-mediated depletion of these enzymes decreased the sensitivity of cells to methotrexate (Fig. 3a, Extended Data Fig. 4a). As in FTCD-depleted cells, methotrexate-treated, HAL-depleted cells had significantly higher levels of THF (Fig. 3b top), and higher rates of nucleotide synthesis as monitored by [U-13C] serine tracing in comparison to control cells (Fig. 3b middle and bottom). Interestingly, while control lines show increased total serine and [U-13C] serine levels upon methotrexate treatment, HAL-depleted HEL cells show total and [U-13C] serine levels that are similar to vehicle-treated cells (Extended Data Fig. 4d, f). The increased serine levels in methotrexate-treated control cells are likely the result of reduced serine usage due to limiting cellular levels of THF. Glycine labeling appears to be the same in all samples (Extended Data Fig. 4c, e). These data suggest that like the depletion of FTCD, that of HAL results in a higher availability of reduced folate and thus greater nucleotide synthesis rates in methotrexate-treated cells.
We found that the expression of HAL (the rate-limiting enzyme in the histidine degradation pathway20), but not of FTCD or AMDHD1, was significantly higher (Fig. 3c, Extended Data Fig. 4b) in hematopoietic cell lines that we identified as highly sensitive to methotrexate (Fig. 1a, Extended Data Fig. 1a-c). To follow up this finding, we analyzed RNAseq data from 1010 cell lines21 to identify those with the highest and lowest expression of HAL (Fig. 3d), and found that lines with high HAL expression were more sensitive to methotrexate than those with low expression (Fig. 3e). Depletion of HAL in two high HAL-expressing lines (EOL-1 and NCIH1666) substantially decreased their methotrexate sensitivity (Fig. 3f, Extended Data Fig. 5a), revealing a functional role for HAL in the response of these cells to the drug. Thus, cells with endogenously low or exogenously-lowered HAL expression are both less sensitive to methotrexate than control cells.
Methotrexate is used as standard of care in the treatment of the most common pediatric malignancy, acute lymphoblastic leukemia (ALL)22, with relatively high success rates that unfortunately are accompanied by severe toxicity5. Currently, treatment-outcome prediction markers are lacking23, leading physicians to prescribe methotrexate regimens based on clinical parameters instead of personalized pharmacogenetic factors. Remarkably, we found that young ALL patients with high HAL expression in the ALL cells have significantly higher survival rates, compared to patients in the same study24 with low HAL expression (Fig. 3g). Expression levels of SLC19A1, the transporter for methotrexate, as well as the histidine degradation pathway enzymes AMDHD1 and FTCD, showed no significant association with patient survival (Extended Data Fig. 5b-d). These data warrant the further investigation of the expression level of HAL as a prediction factor for treatment success rate in ALL patients treated with methotrexate.
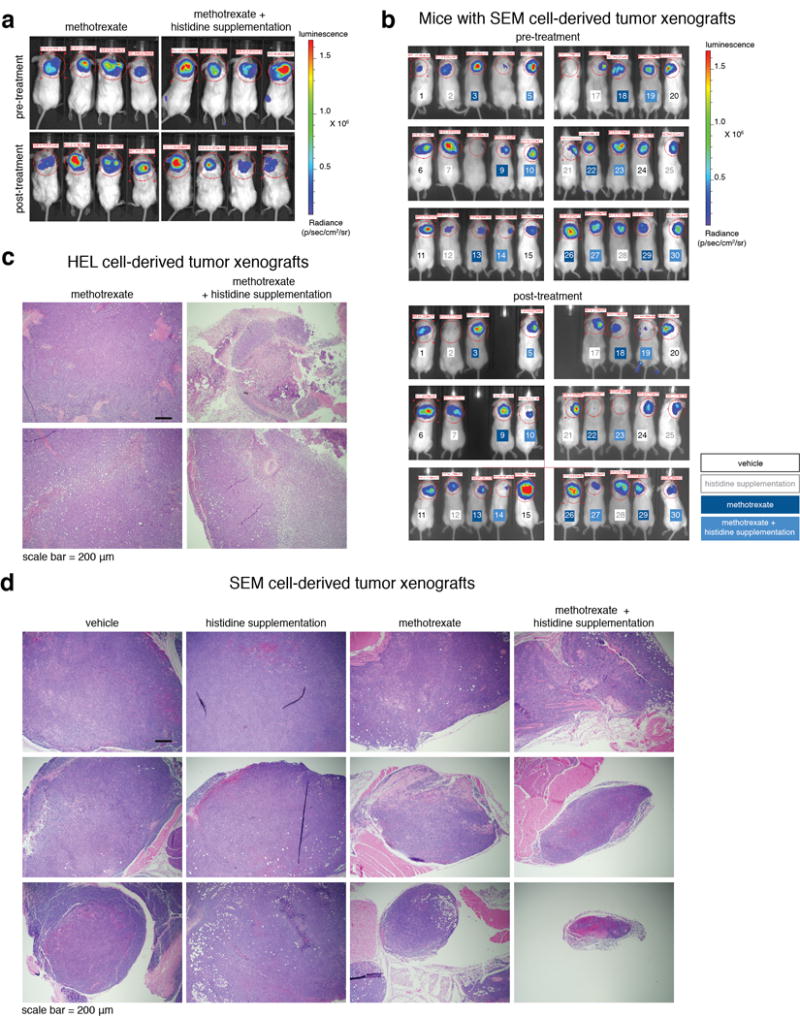
The association between expression levels of the rate-limiting enzyme in the histidine degradation pathway and methotrexate sensitivity in cancer cell lines and in patients, raised the possibility that increasing flux through this pathway could enhance the cytotoxic effects of methotrexate. We hypothesized that in vivo histidine supplementation would increase histidine degradation and consumption of THF by FTCD, which might enhance the toxic effects of methotrexate on tumor cells. To assess the response of cancer cells to methotrexate in the presence of above-normal levels of histidine, we generated tumors by injecting HEL or SEM cells subcutaneously into NOD-SCID mice and treated the tumor-bearing mice with vehicle, histidine, methotrexate, or a combination of histidine and methotrexate (Fig. 4a). In order to reliably assess the contribution of histidine supplementation, we intentionally used a mild regimen of methotrexate comprised of doses lower than those normally used in mice25.
Figure 4. In vivo histidine supplementation increases flux through the histidine degradation pathway and sensitizes tumors to methotrexate.

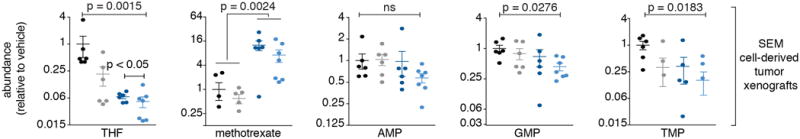
a. Workflow for the in vivo assessment of the methotrexate-sensitivity of tumor xenografts following histidine supplementation. HEL or SEM cells were injected subcutaneously into NOD-SCID mice. Three weeks later tumor size was assessed by in vivo imaging and mice were randomly divided into four experimental groups: vehicle-treated, histidine supplementation, methotrexate-treated, and histidine supplementation combined with methotrexate treatment. The treatments were followed by a second imaging session. b, c. The combination of methotrexate and histidine supplementation is the only treatment that resulted in a significant reduction in tumor size. Fold changes in tumor size as measured in vivo before and after the different treatments are presented for HEL cell-derived tumors (b), and SEM cell-derived tumors (c) (non-parametric one-way ANOVA, KW test). d. The combination of methotrexate treatment and histidine supplementation caused cancer cell death. Hematoxylin-eosin (H&E) staining of tumors from mice injected with HEL cells and treated with the different regimes is presented at two magnifications. Mitotic cells (blue arrows) and apoptotic or necrotic cells (orange arrows) are marked in the bottom panel. e, f. The combination of methotrexate and histidine supplementation was the only treatment that resulted in significant necrosis in tumors. Necrotic areas as detected by H&E staining (d, top three rows, right column) were measured in the different groups (non parametric one-way ANOVA, KW test). g. THF levels decreased following methotrexate treatment and decreased even further when methotrexate was combined with histidine supplementation. Methotrexate levels were not different in tumors from mice treated with methotrexate alone or in combination with histidine supplementation. Nucleotide abundance was significantly lower in tumors from mice treated with methotrexate and histidine supplementation compared to tumors from vehicle-treated mice (non parametric one-way ANOVA, KW test. Methotrexate –two tailed t test).
b, d, e - vehicle n=5, histidine n=4, methotrexate n=6, methotrexate + histidine n=6. c, f - n=6, n=7, n=7, n=7 for the same groups. g - n=5, n=4, n=5, n=6, for the same groups.
Abbreviations: AMP – adenosine monophosphate. GMP – guanosine monophosphate. TMP – thymidine monophosphate.
As expected, tumors from mice treated with this reduced dosing of methotrexate did not have a significant decrease in size (Fig. 4b, c, Extended Data Fig. 6a, b). However, tumors from mice given both methotrexate and histidine showed a marked decrease in tumor size that was significantly greater than in any of the other treatment cohorts (Fig. 4b,c). Additionally, tumors from mice treated with methotrexate and histidine supplementation appeared histologically worse and contained large necrotic areas and what morphologically appeared to be necrotic or apoptotic cells (Fig. 4d-f, Extended Data Fig. 6c, d, 7a). Organs known to be adversely affected by methotrexate showed no further toxicity in mice treated with the combined therapy compared to mice treated with methotrexate alone (Extended Data Fig. 7b, 9a), and no difference was observed in the weight loss of the mice treated with methotrexate alone compared to methotrexate treatment supplemented with histidine (Extended Data Fig. 9b). No enhanced toxicity was observed in mice treated with the combined therapy compared to methotrexate alone even when the mice were treated for 15 days (Extended Data Fig. 10–11).
According to our hypothesis, histidine supplementation should increase the flux through the histidine degradation pathway and cause increased consumption of THF, a limiting metabolite in methotrexate-treated tumors. Remarkably, THF levels were significantly lower in tumors from mice treated with the combined therapy compared to methotrexate alone, implying lower THF availability in these tumors, although methotrexate levels were essentially the same (Fig. 4g, Extended Data Fig. 8). Both methotrexate and folate levels were very similar in the plasma of mice treated with methotrexate alone or in combination with histidine supplementation (Extended Data Fig. 9e, f). Metabolites of the histidine degradation pathway were increased in HEL cell-derived tumors in mice treated with histidine supplementation (Extended Data Fig. 9c,d).
Lower THF availability should compromise the capacity of cells to synthesize nucleotides essential for cell proliferation and viability. Indeed, tumors from mice treated with both methotrexate and histidine had levels of AMP, GMP, and TMP that were significantly lower than those found in tumors from vehicle-treated mice (Fig. 4g, Extended Data Fig. 8). Collectively, our data indicate that histidine supplementation can increase the efficacy of methotrexate in mice in vivo by enhancing the depletion of THF within tumor cells.
Taken together, our results provide evidence for a surprising role of the histidine degradation pathway in the cellular response to the widely used chemotherapy agent methotrexate. Endogenous expression levels of HAL, the rate-limiting enzyme of the pathway, are associated with the sensitivity of cancer cell lines to methotrexate, and the overall survival of ALL patients treated with methotrexate. These findings suggest that HAL expression might serve as a clinical predictor for better responders to methotrexate treatment among ALL-bearing patients, and may be informative for decisions regarding therapy strategies. Furthermore, both genetic perturbation and dietary enhancement of the pathway changed the sensitivity of hematopoietic cancer cells to the chemotherapy. As standard protocols for administering methotrexate are often accompanied by severe toxicity5, we suggest that dietary supplementation with histidine may represent a relatively low-risk intervention that might allow for reduced dosing of this toxic agent and thus a greater clinical benefit.
Methods
Barcoding and co-culture of 42 hematopoietic cell lines
Cell lines used in this manuscript were authenticated by STR analysis and were tested and found negative for mycoplasma.
Construction of unique barcoded plasmids
The oligonucleotides BC-top and BC-bottom were annealed and phosphorylated (T4 PNK, NEB) to generate a linear DNA fragment containing a 5′-AgeI overhang, a 3′-EcoRI overhang, and a degenerate NNNNNNN 7-mer (N is A, T, G, C). The annealed product was cloned into pLKO to generate a collection of pLKO-BC plasmids harboring unique 7-mer barcodes that were subsequently determined by Sanger sequencing, as similarly described elsewhere29.
BC-top: CCGGTTTTTAGCATCGCCNNNNNNNCTCGCGGCCGCAGGTCCATG
BC-bottom: AATTCATGGACCTGCGGCCGCGAGNNNNNNNGGCGATGCTAAAAA
Virus production
HEK-293T cells were co-transfected with a pLKO-BC plasmid, the VSV-G envelope plasmid and the ΔVPR lentiviral packaging plasmid using XTremeGene 9 Transfection Reagent (Roche). Culture medium was exchanged 16 hours after transfection with the same medium instead supplemented with 20% inactivated fetal bovine serum (IFS). The virus-containing supernatant was collected 48 hours after transfection and passed through a 0.45 mm filter to eliminate cells.
Transduction of cell lines
Cells were pelleted, then seeded at a density of 300,000 cells/mL in 6-well plates in 2 mL of RPMI containing 8 μg/mL polybrene (EMD Millipore), and then transduced with lentivirus by centrifugation at 2,200 RPM for 90 min at 37°C. After a 24-hour incubation, cells were pelleted to remove virus and then re-seeded into fresh culture medium containing puromycin, and selected for 72 hours.
Competitive survival of barcoded cell lines
42 hematopoietic cancer cell lines that each carried a stably incorporated specific genomic barcode were pooled together and treated for 6 days with methotrexate (0, 0.1, 0.5 and 5 μM). Genomic DNA (gDNA) samples were collected at days 2, 4 and 6 and barcode abundances were determined by high-throughput sequencing (Illumina MiSeq).
Positive-selection CRISPR/Cas9-based screen
Prior to the screen, the methotrexate EC90 of HEL cells was determined in culture conditions similar to the screen. Detailed protocols for the CRISPR/Cas9-based screen are described elsewhere30–32. In short, the sgRNA library7 was transformed and propagated for virus production as described above, followed by HEL transduction at efficiency of 60% to avoid more than one sgRNA in each cell. After selection of transduced cells by puromycin, cells were divided into two replicates each of DMSO- and methotrexate-treated groups and were cultured for 14 days. 100 × 106 cells were harvested for genomic DNA purification and sgRNA library de-convolution by HiSeq deep sequencing. Sequencing reads were aligned to the sgRNA library and the abundance of each sgRNA was calculated. The counts from all replicates of the initial cell populations were combined to generate the initial reference dataset. The counts from each sample were normalized for sequencing depth. sgRNAs with fewer than 40 reads in the initial reference dataset were omitted from downstream analyses. The log2 fold change in abundance of each sgRNA between the final and initial reference populations was calculated and used to define a CRISPR Score (CS) for each gene10. The CS is the average log2 fold change in abundance of all sgRNAs targeting a given gene. Genes targeted by fewer than four distinct sgRNAs in the initial reference dataset were omitted from downstream analyses.
Gene targeting using single sgRNAs
To generate HEL, Ramos, LAMA84, EOL-1, and NCIH1666 cells stably expressing the indicated sgRNAs, the following oligonucleotides were cloned into the pLentiCRISPR V1 viral vector.
Oligos used for sgRNA cloning
sgAAVS: caccgTCCCCTCCACCCCACAGTG (sense), aaacCACTGTGGGGTGGAGGGGAc (antisense). sgFTCD_1: caccgGCAGGTTGAGCGCGATGCGG (sense), aaacCCGCATCGCGCTCAACCTGCc (antisense). sgFTCD_2: caccgGGAGCCATCACACAGACCCC (sense), aaacGGGGTCTGTGTGATGGCTCCc (antisense). sgSLC19A1: caccgTGCGCGGGTCTACAACGGCG (sense), aaacCGCCGTTGTAGACCCGCGCAc (antisense). sgHAL: caccgGCAGGCAGCTCACTGAGGGA (sense), aaacTCCCTCAGTGAGCTGCCTGCc (antisense). sgAMDHD1: accgATGGAAATTCACCAGGCCGG (sense), aaacCCGGCCTGGTGAATTTCCATc (antisense).
To generate lentivirus, 3 × 10⁶ HEK-293T cells were seeded in a 10 cm plate in DMEM supplemented with 10% IFS. 24 hours later, the cells were transfected with the above sgRNA pLenti-encoding plasmids alongside the ΔVPR envelope and CMV VSV-G packaging plasmids using the XTremeGene 9 Transfection Reagent (Roche). 12 hours after transfection, the medium was aspirated and replaced with 8 ml fresh medium. Virus-containing supernatants were collected 48 hours after the transfection and passed through a 0.45 μm filter to eliminate cells. Transduction of cells was done as described above.
Gene knockdowns using shRNAs
Lentiviral shRNAs were obtained from The RNAi Consortium33, Lentivirus production and viral transduction of HEL cells were performed as described above, followed by a three-day selection with puromycin. Knockdown was verified 48 hours after completion of selection by qPCR.
shRNA sequences
GFP – TGCCCGACAACCACTACCTGA. RFP – CGCGTGATGAACTTCGAGGAC. LacZ – CCAACGTGACCTATCCCATTA. FTCD shRNA 1 – CCGGGTAGCTTCCCGACTTAT. FTCD shRNA 2 – CGAGAAGGAGAACCTCTTCAT. SLC19A1 shRNA 1 – CGACGGTGTTCAGAATGTGAA. SLC19A1 shRNA 2 – GATTGCATCTTCTCTGTCTAA.
Methotrexate treatment of cell lines in culture
Unless otherwise indicated, 5 μM methotrexate (Sigma) was added to RPMI supplemented with 10% IFS for at least 3 days. Due to their relatively low sensitivity to methotrexate, Ramos cells were treated with 20 μM methotrexate.
Cell survival assays
Cells were seeded at a cell density of 50,000 cells/ml in 96 well plates. Three hours later cells were treated with 7-10 concentrations of methotrexate or doxorubicin in triplicate. Cells were incubated for 5 days, followed by ATP-based, cell viability assay (CellTiter Glo, Promega). Survival curves were calculated by best-fit analysis of the drug log μM to fold-change of treated cells over vehicle-treated cells. All survival assays included technical triplicate per sample, per experiment.
Cell counting
Cells were counted using a coulter counter (Beckman Z2). Viability percentage was calculated by FACS-based (BD LSR flow cytometer) viability assay using 7-AAD staining (Thermo Fisher Scientific). Each experiment included technical triplicates per sample.
Metabolite profiling by mass spectrometry
Sample preparation – for polar metabolite detection
Cells in culture: Two million cells were harvested, washed once with 0.9% NaCl and resuspended in extraction buffer (80% methanol, 20% H2O plus isotopically-labeled internal standards). Samples were then mixed by vortexing for 10 seconds and debris was pelleted by a 10 minute spin at 13,000 RPM. Supernatant was then transferred to a new tube and dried using a liquid nitrogen dryer. Tumor samples: Tumors were collected and immediately snap-frozen in liquid nitrogen. Tumors were thawed by homogenization (Kimble cordless handheld homogenizer) in extraction buffer, followed by the procedure described for cultured cells samples. All metabolites measured in tumors were normalized to an average of 4 amino acids (phenylalanine, leucine, valine and tyrosine) as an internal loading control. Plasma samples: Blood was collected from the submandibular vein into anti-coagulant tubes (Microvette, Sarstedt), and immediately placed on ice. Samples were spun for 6 minutes at 3,000 RPM and supernatants were collected. 10 μl from each sample was used for further LC/MS analysis by extraction in 90 μl extraction buffer and sample preparation as described for cultured cells.
Sample preparation for folate detection
Protocol for folate detection was described34, and adapted with a minor change: the extraction buffer used was 80% methanol, 20% 12.5 mM sodium ascorbate. All subsequent steps were as published34. Briefly, samples were washed once (0.9% NaCl), then extracted in extraction buffer (80% methanol, 20% 12.5 mM sodium ascorbate, plus aminopterin as internal standard), mixed by vortexing for 10 seconds and debris was pelleted by a 10 minute spin at 13,000 RPM. Supernatants were split for polar and folate detection and dried using a liquid nitrogen dryer manifold. Polar samples were resuspended in water to be run on the MS. Folate samples were resuspended in reconstitution buffer (0.5% ascorbic acid, 1% K2HPO4 and 0.5% BME) containing rat serum (sigma, R9759). The rat serum contains the enzymes required to strip the poly-glutamate tail from the measured folate. Rat endogenous folate was removed from the rat serum by activated carbon treatment (sigma, C9157). Poly-glutamate tail removal was carried out for 2 hours in 37°. After the Poly-glutamate tail removal pH was adjusted to pH = 4 using formic acid and samples were loaded on Bond Elute-pH columns (Agilent, 14102062) for a pH-based cleanup. Columns were eluted with 300 μl elution buffer (50% methanol, 0.25% NH4OAc, 0.5% BME), followed by drying the samples using liquid nitrogen dryer manifold and resuspension in 50 μl water.
Polar metabolite profiling by LC/MS
Dried polar samples were resuspended in 50 μL water and 2 μL was injected into a ZIC-pHILIC 150 × 2.1 mm (5 μm particle size) column (EMD Millipore). Analysis was conducted on a QExactive benchtop orbitrap mass spectrometer equipped with an Ion Max source and a HESI II probe, which was coupled to a Dionex UltiMate 3,000 UPLC system (Thermo Fisher Scientific). External mass calibration was performed using the standard calibration mixture every 7 days. Chromatographic separation was achieved using the following conditions: Buffer A was 20 mM ammonium carbonate, 0.1% ammonium hydroxide; buffer B was acetonitrile. The column oven and autosampler tray were held at 25°C and 4°C, respectively. The chromatographic gradient was run at a flow rate of 0.150 ml/min as follows: 0–20 min.: linear gradient from 80% to 20% B; 20–20.5 min.: linear gradient from 20% to 80% B; 20.5–28 min.: hold at 80% B. The mass spectrometer was operated in full-scan, polarity switching mode with the spray voltage set to 3.0 kV, the heated capillary held at 275°C, and the HESI probe held at 350°C. The sheath gas flow was set to 40 units, the auxiliary gas flow was set to 15 units, and the sweep gas flow was set to 1 unit. The MS data acquisition was performed in a range of 70–1000 m/z, with the resolution set at 70,000, the AGC target at 10e6, and the maximum injection time at 20 msec. Relative quantitation of polar metabolites was performed with XCalibur QuanBrowser 2.2 (Thermo Fisher Scientific) using a 5 ppm mass tolerance and referencing an in-house library of chemical standards.
Histidine was normalized to isotopically-labeled histidine as an internal standard, IMP, AMP and TTP levels were normalized to isotopically-labeled glutamate as an internal standard.
Detection of folate species by LC/MS
Detection of folate species was performed on the same instrumentation described above. In general, instrument settings remained the same unless specified. Following removal of the poly-glutamate tails from folate species34, samples were resuspended in 50 μL water and 15 μL was injected onto an Ascentis® Express C18 HPLC column (2.7 μm × 15 cm × 2.1 mm; Sigma Aldrich). The column oven and autosampler tray were held at 30°C and 4°C, respectively. The following conditions were used to achieve chromatographic separation: Buffer A was 0.1% formic acid; buffer B was acetonitrile with 0.1% formic acid. The chromatographic gradient was run at a flow rate of 0.250 mL/min as follows: 0-5min.: gradient was held at 5%B; 5-10 min.: linear gradient of 5% to 36%B; 10.1-14.0 min.: linear gradient from 36%-95% B; 14.1-18.0 min.: gradient was returned to 5% B. The mass spectrometer was operated in full-scan, positive ionization mode. MS data acquisition was performed using three narrow-range scans: 438-450 m/z; 452-462 m/z; and 470-478 m/z, with the resolution set at 70,000, the AGC target at 10e6, and the maximum injection time of 150 msec. Relative quantitation of folate species was performed with XCalibur QuanBrowser 2.2 (Thermo Fisher Scientific) using a 5 ppm mass tolerance. Non-glutamated folate species were identified using chemical standards (see below), together with comparison of experimental MS2 spectra with in silico predicted spectra (Supplementary Fig. 1) Mirror plots were created using R and structures were identified based on the known parental structure (HMDB www.hmdb.ca), using a combination of ChemDraw (Perkin Elmer, Waltham, MA), CFM:ID35 (cfmid.wishartlab.com), METLIN (www.metlin.scripps.edu) and Sirius36,37 (version 3.5.1; University of Jena, Germany).
Folate forms standards: aminopterin (Sigma, A3411), folate (Schircks Laboratories, 16.203), THF (Schircks Laboratories, 16.207), 5-formyl THF (Schircks Laboratories, 16.221), triglutamate 5-formyl THF (Schircks Laboratories, 16.283), 5,10-methenyl THF (Schircks Laboratories, 16.230), 5-methyl THF (Schircks Laboratories, 16.235).
Levels of all folate forms, as well as methotrexate were normalized to aminopterin as an internal standard.
MS reagents
Chloroform was purchased from Sigma-Aldrich and was HPLC grade (ethanol-stabilized). Acetonitrile was purchased from Merck Millipore and was LC/MS Hypergrade. All other solvents were purchased from Fisher and were Optima LC/MS grade. Folate standards were purchased from Schircks laboratories, Switzerland. A mix of 17 isotopically-labeled amino acids (Cambridge Isotope Laboratories, Inc.) was used as the internal standard. FIGLU standard was purchased from Dalton Research Molecules, catalog number DC-001551.
Labeling with [U-13C] serine
500,000 cells were seeded in RPMI containing 10% dialyzed IFS and cultured for 24 h. Prior to the labeling experiments, HEL cells were treated with 5 μM methotrexate for 48 hours and Ramos cells were treated with 20 μM methotrexate for 72 hours. Vehicle-treated cells were treated with equivalent concentrations of DMSO for the same times. Cells were counted to correct for variations in cell numbers of the different genotypes due to various levels of drug-sensitivity. For FTCD-null cells (Fig. 2e) HEL cells were treated with 5 μM methotrexate for 48 hours, and Ramos cells were treated with 20 μM methotrexate for 72 hours to decrease THF levels and nucleotide synthesis in WT cells. The media was then replaced with [U-13C] serine-containing media by counting 1 × 10⁶ cells that were washed once with PBS, and reseeded in RPMI containing 10% dialyzed IFS that contained [U-13C] serine and no unlabeled serine. Cells were incubated in [U-13C] serine plus methotrexate for additional 24 hours followed by cell harvesting and LC/MS analysis. For HAL-null cells (Fig. 3 b), Ramos cells were treated with 20 μM methotrexate for 48 hours prior to [U-13C] serine labeling to decrease THF levels and nucleotide synthesis in WT cells. The media was then replaced with [U-13C] serine-containing media, and cells incubated in [U-13C] serine plus methotrexate for additional 24 hours followed by cell harvesting and LC/MS analysis. HEL cells were treated with 5 μM methotrexate for 24 hours, in parallel to the [U-13C] serine labeling. Natural abundances of labeled nucleotides were corrected as previously described38,39.
qPCR
Cell pellets were washed once with PBS prior to RNA purification using Trizol (ambion). The Reverse Transcriptase reaction (RT) was done using 2 μg RNA from each sample (Super Script III, Thermo Fisher Scientific). qPCR reactions were done with Sybr green reagent (Roche) and according to manufacturer instructions. qPCR instrument used for all reactions is QuantStudio 6 Flex (Applied Biosystems). Reference genes used in each qPCR run were UBC and HPRT.
Primers used for qPCR:
FTCD: Forward primer: TGCGAGAAGGAGAACCTCTT, Reverse primer: CTCGATGATCCGCTCCTTAG. HAL: Forward primer: GGCTGAAGGTGGTCTGAACT, Reverse primer: AGTCAACAGACGAGGGATGG. AMDHD1: Forward primer: AGTCTCACACACACGGATCG, Reverse primer: GCCTCCGAACTGGTAAATCA. SLC19A1: Forward primer: GAGAGCTTCATCACCCCCTA, Reverse primer: GGCCAGGTAGGAGTACGACA. mouse Ftcd: Forward primer: AACCTGCTAAGCACCAAGGA, Reverse primer: GGACCTTTTTCAGACGTCCA. mouse Hal: Forward primer: GGTGGCCTTAGAGGACAATG, Reverse primer: GCTCCCGGTATTTGCTGTAG. mouse Amdhd1: Forward primer: TCCACGAGTTTGCAATGAAG, Reverse primer: CTCCACCGTGAAGTTGATCC. GFP: Forward primer: ACAACGTCTATATCATGGCCGA, Reverse primer: GAAGTTCACCTTGATGCCGTTC. UBC: Forward primer: ATTTGGGTCGCGGTTCTT, Reverse primer: TGCCTTGACATTCTCGATGGT. HPRT: Forward primer: TGACACTGGCAAAACAATGCA, Reverse primer: GGTCCTTTTCACCAGCAAGCT.
Mouse tumor xenografts
HEL and SEM cells were transduced with R-luciferase expressing vector (FUW-RLuc-T2A-PuroR), and selected with puromycin. 2 × 10⁶ cells were injected subcutaneously into 50 NOD-SCID mice (HEL) or 30 NOD-SCID mice (SEM). Three weeks after injection, tumor size was imaged using the IVIS Spectrum in vivo imaging system (PerkinElmer) following IP injection of 50 μg per mouse of the water-soluble substrate Coelenterazine (Nanolight Technologies). 24 mice (HEL) or 27 mice (SEM) with similar tumor sizes were divided into four experimental groups: vehicle-treated (saline), histidine supplementation (400 μl of histidine solution of 46 mg/ml, histidine maximum solubility at 25°), methotrexate-treated (50 mg/kg methotrexate, based on the weight measured at the day of first imaging), and histidine supplementation combined with methotrexate treatment. Mice were then injected daily for 5 days. All solutions were warmed to 37° prior to injection to reduce stress. After five days of treatment, tumor size was monitored, and tissues were collected for LC/MS and histology. The Committee for Animal Care at MIT approved all animal procedures carried out in this study. Mice were euthanized when tumors reached the size limit of 1cm or if other symptoms indicative of low health status appeared. These include: lethargy, drop in weight (10% over a day or 20% since the beginning of the experiment), reduced appetite, lack of movement, hunched back, hair loss.
We have complied with all relevant ethical regulations while conducting animal experiments. Sample size was determined as the minimal amount of mice absolutely necessary for reliable, significant results (no less than 6 and no more than 8 per cohort, depending on the availability of age-matched mice in the colony). Mice were distributed randomly between the different groups. Injections and imaging were all done by N.K. and were not done blindly. Figure analysis of necrotic areas in H&E slides was done blindly. Participating mice: NOD-SCID mice - NOD.CB17-Prkdcscid/NCrCrl (originally purchased from Charles River and maintained at the Whitehead mouse facility by self breeding). HEL cell-derived tumors experiment - 24 females. Ages 8-11.5 weeks. Mean 10.7 weeks. SEM cell-derived tumors experiment - 26 females. Ages 12-18 weeks. Mean 14 weeks. HEL cell-derived tumors long term experiment - mice 1-22 females. mice 23-31 males. Ages 6-10 weeks. Mean 10 weeks.
Plasmid construction
Cloning into pLentiCRISPR plasmids is described above. Mouse cDNA constructs (mouse Ftcd, mouse Hal and mouse Amdhd1) were cloned into the backbone plasmid pWPI (a kind contribution from the Didier Trono lab, Addgene plasmid number 12254) that was cut at the Pme1 site, and PCR-amplified mouse cDNA was inserted by ligation. The primers used for each gene incorporated a 5′ kozak sequence and Pme1 sites flanking the cloned gene on the 5′ and 3′ sides and are listed below. The luciferase-expression plasmid used for in vivo imaging is FUW-RLuc-T2A-PuroR, which is an FUW lentiviral backbone with the R-luciferase gene inserted downstream to a constitutive UBC promoter. The R-luciferase gene was cloned using EcoRI. The R-luciferase ORF is 936bp long, missing its stop codon and is in frame with the T2A-PuroR.
Primers used for the cloning
Mouse Ftcd: GTACGTTTAAACCTCGAGGCCACCATGTCTCAGTTGGTGGAATG (Forward primer), TTCAGTTTAAACTCACTCCTTTCGGGCT (Reverse primer).
Mouse Hal: GTACGTTTAAAC CTCGAGGCCACCATGCCTAGGTACACAGTGCA (Forward primer), TTCAGTTTAAAC TTAAAGATCGTCAGACTCTGGG (Reverse primer).
Mouse Amdhd1: GTACGTTTAAAC CTCGAGGCCACCATGACGAGCAGCCACC (Forward primer), TTCAGTTTAAAC TCACTTCTTGTAGATGACTTTTCC (Reverse primer).
Pme site - GTTTAAAC, kozak sequence - CTCGAGGCCACC.
Plasmids used in this study
pLentiCRISPR sgAAVS (Addgene number 83906), pLentiCRISPR sgFTCD_1 (Addgene number 102312),pLentiCRISPR sgFTCD_2 (Addgene number 102313),pLentiCRISPR sgSLC19A1 (Addgene number 102314), pLentiCRISPR sgHAL (Addgene number 102315), pLentiCRISPR sgAMDHD1 (Addgene number 102316), pWP1_mFTCD (Addgene number 102317), pWP1_mHAL (Addgene number 102318), pWP1_mAMDHD1 (Addgene number 102319), FUW-RLuc-T2A-PuroR (Addgene number 102320).
Patient survival curves
Patient phenotypic and RNAseq data for HAL, FTCD, AMDHD1, and SLC19A1 from the Therapeutically Applicable Research to Generate Effective Treatments (TARGET) initiative managed by the NCI were downloaded from the UCSC Xena Genomics Browser (http://xena.ucsc.edu) and the DCC Open sections of the TARGET Data Matrix (https://ocg.cancer.gov/programs/target/data-matrix) on August 15, 2017. Information about TARGET can be found at http://ocg.cancer.gov/programs/target. We then focused on a particular patient subset: the TARGET Substudy Acute Lymphoblastic Leukenia (ALL) Expansion Phase 2 (phs000218.v18.p7), and further centered our analysis on patients treated with the COG AALL0232 high-risk ALL protocol (ClinicalTrials.gov Identifier NCT00075725). For patients with multiple represented tumor samples, only the first sample was used for downstream analyses. Overall survival was plotted for the upper and lower quartile of HAL, FTCD, AMDHD1, and SLC19A1 expression. Survival curves were compared by the log-rank test and p-values indicated.
Kaplan-Meier curves were plotted using Prism version 7.0b. End points for patients include death and dropout of patients due to reasons other than death, in which cases survival data are integrated in the curve up to the last day of follow-up. p value was calculated using log-rank Mantel-Cox test. We have complied with all relevant ethical regulations while conducting this patient-derived data collection.
Statistical Tests Used in the Study
Error bars indicate standard error of the mean (SEM) unless otherwise noted.
Center bars indicate mean.
KS test - two-tailed Kolmogorov–Smirnov test.
KW test - Kruskal-Wallis test, Dunn’s post hoc test.
For all H&E results - different mice within each group showed similar results.
Data Availability Statement
The authors declare that all data generated or analyzed during this study are included in this published version and its supplementary information files. Extended Data Figures 1–10, as well as Source Data for Figures 1- 4 and for Extended Data Figure 10 are provided with the online version of the paper.
Extended Data
Extended Data Figure 1. Loss of FTCD decreases the sensitivity of cancer cells to methotrexate.
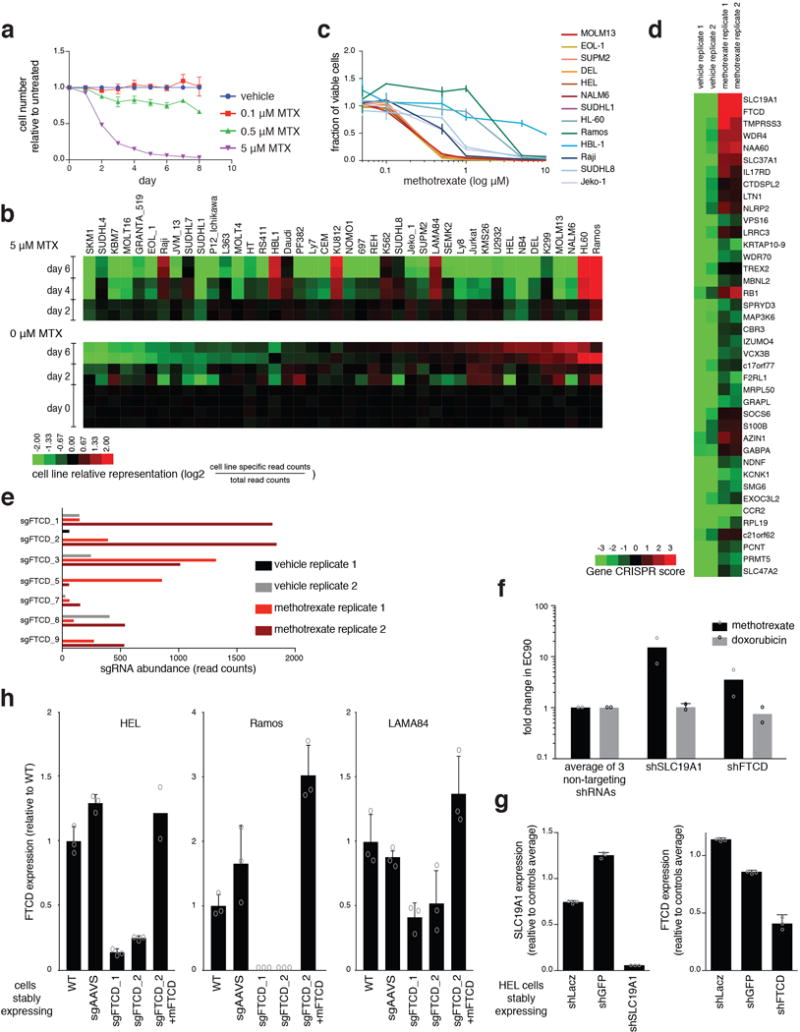
a. Relative daily cell counts of the mixed culture of 42 genomically-barcoded hematopoietic cancer cell lines. List of cell lines can be found in Source Data_1, sheet “barcoded cell lines”. We focused our efforts on hematopoietic cell lines because methotrexate is most commonly used to treat hematopoietic malignancies9. Cells were co-cultured and treated with three concentrations of methotrexate (0.1, 0.5, or 5 μM). Cell counts are presented relative to the vehicle-treated co-culture. n=3, biological replicates. Error bars indicate SD. b. Sequencing results of the competitive co-culture experiment. Heatmap of relative barcode abundance for each indicated cell line following treatment with 5 μM methotrexate or vehicle after 2, 4, or 6 days compared to those in the initial cultures. Raw data of sequencing results can be found in Source Data_1 sheet “Counts_sequencing”. c. Validation of the results of the competitive co-culture experiment as shown by individual dose-response curves of seven relatively sensitive cell lines (MOLM13, EOL-1, SUPM2, DEL, HEL, NALM6, SUDHL1), and six relatively resistant cell lines (HL-60, Ramos, HBL-1, Raji, SUDHL8, Jeko-1). n=2, biological replicates. Each biological replicate included technical triplicate. Error bars indicate SD. d. Top 40 genes that scored in the genome-wide CRISPR/Cas9-based positive selection screen. These genes had the largest differential CRISPR scores between vehicle- and methotrexate-treated samples. The heatmap represents the CRISPR score of two biological replicates of each screen (vehicle- and methotrexate-treated). CRISPR score of all genes can be found in Source Data_1, sheet “CRISPR score”. e. Abundance of each of the individual sgRNAs targeting FTCD in the screen. Read counts for each sgRNA is presented for each of the screen biological replicates of the vehicle-treated and methotrexate-treated samples. See also Source Data_1, sheet “screen rpm” for read counts raw data, including the genes HAL and AMDHD1. f. Fold-change in methotrexate EC90 and doxorubicin EC90 in HEL cells stably expressing shRNA targeting either SLC19A1 or FTCD compared to the average of three non-targeting shRNAs (shGFP, shRFP, and shLacZ). n=2, biological replicates. Each biological replicate included technical triplicate. g. Expression levels of SLC19A1 (left) and FTCD (right) in HEL cells stably expressing non-targeting shRNAs (shLacZ and shGFP) or targeting shRNAs (shSLC19A1 and shFTCD). Expression levels were measured by qPCR and normalized to the average of two control genes, UBC and HPRT. n=3, technical replicates. h. Validation of genetic depletion of FTCD by the CRISPR/Cas9 system in HEL, Ramos and LAMA84 cell lines. Expression of FTCD was measured by qPCR and normalized to the average of two control genes, UBC and HPRT. n=3 (except for HEL cells expressing sgFTCD_2 + mFTCD, then n=2 due to loss of RNA from one sample), biological replicate. Error bars indicate SD. Raw data of survival curves of these lines can be found in Source Data_1, sheet “Survival MTX”.
Extended Data Figure 2. FTCD depletion enables cancer cells to maintain THF pools and nucleotide synthesis even when treated with methotrexate (part 1).
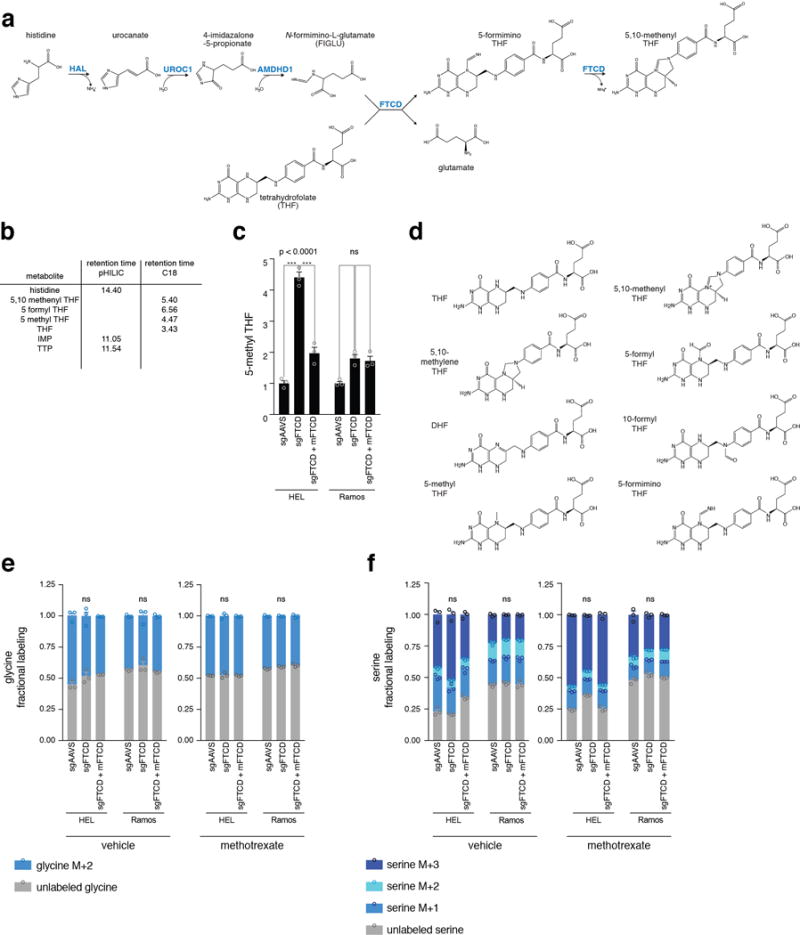
a. The histidine degradation pathway as previously described14,17–19. Enzymes are marked in blue. b. Metabolites detected by LC/MS and their corresponding retention times. The retention time for each detected metabolite is listed. The LC column used for the detection of each metabolite is also indicated. c. Greater pool of 5-methyl THF in vehicle-treated HEL cells following FTCD depletion. It is not readily clear why, in vehicle-treated HEL cells, FTCD depletion caused a reduction in THF levels (Fig. 2e). However, 5-methyl THF levels in these cells were increased significantly (Extended Data Fig. 2c and 3c), indicating that there was no depletion in the overall recyclable amounts of THF in these cells. 5-methyl THF levels were measured by LC/MS in vehicle-treated HEL and Ramos cells. 5-methyl THF levels were normalized to aminopterin as an internal standard. p-values were calculated using one-way ANOVA. n=3, biological replicates. d. Chemical structures of the folate entities found in cells and mentioned in Fig. 2c. e-f. Labeling rate by [U-13C] serine is not different between FTCD-depleted cells and control cells. Fractional labeling of glycine (e) and serine (f) is unchanged by FTCD depletion in HEL and Ramos cells in vehicle-and methotrexate-treated cells. Glycine and serine levels were normalized to isotopically-labeled glutamate as an internal standard. p-values were calculated for the unlabeled fraction by one-way ANOVA. n=3, biological replicates.
Source data for Fig. 2 and Extended Data Fig. 2 and 3 can be found in the file Source Data_2.
Abbreviation: UROC1 – urocanate hydratase 1.
Extended Data Figure 3. FTCD depletion enables cancer cells to maintain THF pools and nucleotide synthesis even when treated with methotrexate (part 2).
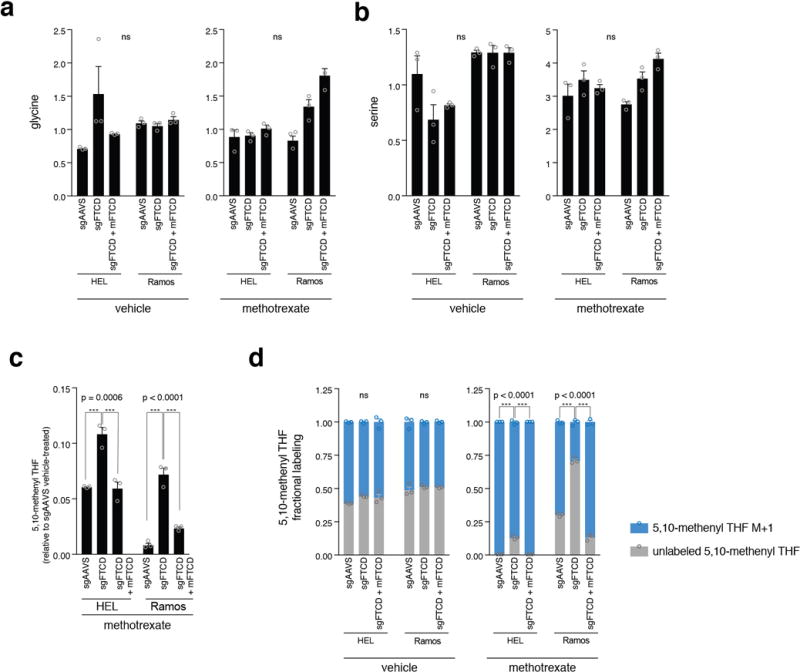
a-b. Pool sizes of glycine (a) and serine (b) are not significantly different between FTCD-depleted and control cells. Glycine and serine levels were measured in vehicle- or methotrexate-treated HEL and Ramos cells. p-values were calculated by one-way ANOVA. n=3, biological replicates. c, d. Greater cellular pool of 5,10-methenyl THF in methotrexate-treated cells following FTCD depletion. [U-13C] serine labeling of 5,10-methenyl THF showed higher abundance of unlabeled 5,10-methenyl THF in FTCD-depleted cells, compared to control cells. This implies higher availability of 5,10-methenyl THF in these cells at the time of labeling onset, which agrees with the higher levels of both THF and 5,10-methenyl THF in the methotrexate-treated FTCD-depleted cells compared to the methotrexate-treated control cells. c. 5,10-methenyl THF levels were measured by LC/MS in vehicle- and methotrexate-treated HEL and Ramos cells. 5,10-methenyl THF levels were normalized to aminopterin as an internal standard. p-values were calculated by one-way ANOVA. n=3 biological replicates. d. HEL cells were treated with 5 μM methotrexate for 48 hours, and Ramos cells were treated with 20 μM methotrexate for 72 hours to decrease THF levels and nucleotide synthesis in WT cells. The media was then replaced with [U-13C] serine-containing media, and cells were incubated in [U-13C] serine plus methotrexate for additional 24 hours followed by cell harvesting and LC/MS analysis. Higher abundance of unlabeled 5,10-methenyl THF implies higher availability of reduced folate at the time of labeling onset. 5,10-methenyl THF levels were normalized to aminopterine as an internal standard. p-values were calculated for the unlabeled fraction by one-way ANOVA. n=3, biological replicates.
Extended Data Figure 4. The histidine degradation pathway affects the sensitivity of cancer cells to methotrexate and HAL expression is associated with treatment response in acute lymphoblastic leukemia (ALL) patients (part 1).
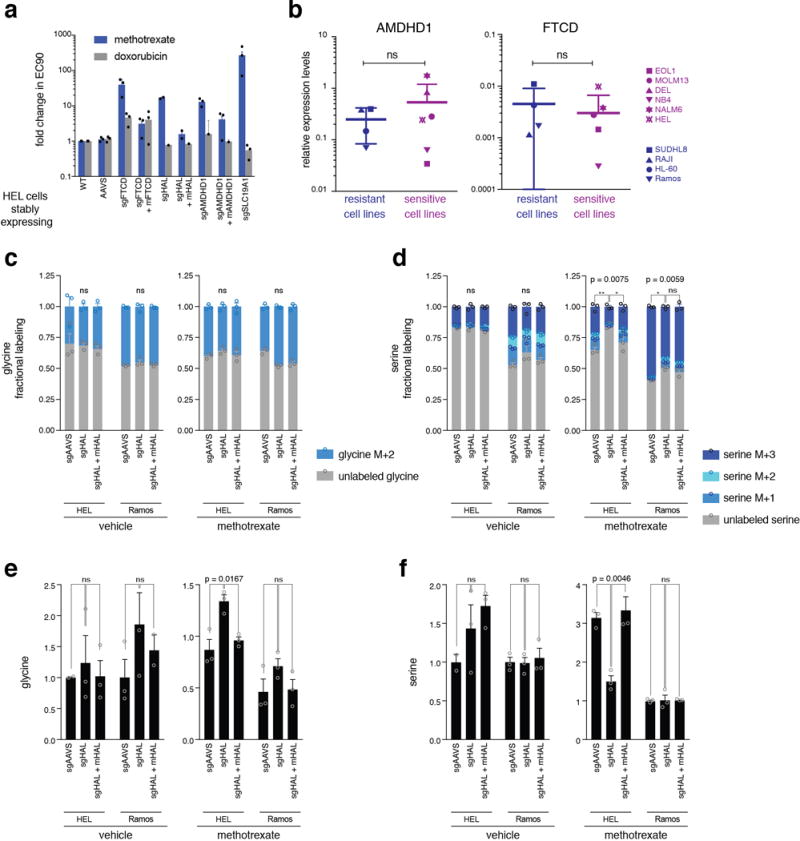
a. Genetic depletion of the enzymes HAL and AMDHD1 decreased sensitivity to methotrexate, but not to a control drug, doxorubicin. Cell viability after treatment with varying concentrations of methotrexate and doxorubicin was used to calculate the EC90s. n=3, biological replicates. Raw data of survival curves can be found in Source Data_3, sheet “Survival MTX”. b. Expression levels of AMDHD1 (left) and FTCD (right) were not significantly different across methotrexate-sensitive hematopoietic cell lines compared to methotrexate-resistant cell lines. The response to methotrexate was determined in a pooled fashion using genomically-barcoded cell lines (Fig. 1a and Extended Data Fig. 1a-c). Expression levels of AMDHD1 and FTCD were measured by qPCR and normalized to the average of control genes (UBC and HPRT). p-values were calculated using the KS test. n=4 for resistant cell lines and n=6 for sensitive cell lines (biologically independent samples). Each qPCR included three technical replicates. c. Fractional labeling of glycine by [U-13C] serine is unchanged by HAL depletion in HEL and Ramos cells in vehicle-and methotrexate-treated cells. d. Uptake of [U-13C] serine is higher in methotrexate-treated control cells but not in methotrexate-treated HAL-deficient cells. e. Glycine levels are not significantly different between HAL-deficient and control cells except for HEL cells treated with methotrexate. f. Serine levels are not significantly different between HAL-deficient and control cells except for HEL cells treated with methotrexate, where HAL-deficient HEL cells have similar levels of serine as vehicle-treated cells. For c-f: Glycine and serine levels were normalized to isotopically-labeled glutamate as an internal standard. p-values were calculated for the unlabeled fraction (c, d) or to total values (e, f) by one-way ANOVA. n=3, biological replicates. Source data for Fig. 3b-d and Extended Data Fig. 4c-f can be found in the file Source Data_3, sheet “metabolite profiling”.
Extended Data Figure 5. The histidine degradation pathway affects the sensitivity of cancer cells to methotrexate and HAL expression is associated with treatment response in acute lymphoblastic leukemia (ALL) patients (part 2).
a. Validation of genetic depletion of HAL by the CRISPR/Cas9 system in NCIH1666 and EOL-1 cells. Expression levels of HAL were measured by qPCR and normalized to the average of two control genes, UBC and HPRT. p-values were calculated by two-way ANOVA. n=3 technical replicates. Error bars indicate SD. Raw data for survival assays Fig. 3e, f can be found in Source Data_3, sheets “cell lines survival” and “HAL KO survival”. b-d. Expression levels of SLC19A1 (b), AMDHD1 (c), or FTCD (d) do not predict survival of pediatric ALL patients treated with a regimen that includes methotrexate. Kaplan-Meier curves of overall survival of ALL patients with high (top quantile, colored green) and low (bottom quantile, colored blue)24 expression of each of the assayed genes. Patient sample size for each group is indicated. p-values were calculated using the log-rank (Mantel-Cox) test. Raw data for ALL patients gene expression can be found in Source Data_3, sheet “ALL patients”.
Extended Data Figure 6. In vivo histidine supplementation increases flux through the histidine degradation pathway and sensitizes tumors to methotrexate (part 1).
a. In vivo imaging of luciferase-expressing HEL tumor xenografts. Mice were imaged before (top images) and after (bottom image) five days of methotrexate treatment alone or in combination with histidine supplementation. For panels a,c, HEL cell-derived tumor-bearing mice: vehicle n=5, histidine supplementation n=4, methotrexate n=6, methotrexate + histidine supplementation n=6. Four mice per group are presented. b. In vivo imaging of luciferase-expressing SEM tumor xenografts. Mice were imaged before (top images) and after (bottom image) five days of treatment. All mice are presented. Mice are numbered in color by their experimental group. For panels b,d, SEM cell-derived tumor-bearing mice: vehicle n=6, histidine supplementation n=7, methotrexate n=7, methotrexate + histidine supplementation n=7. c. Additional images of H&E analyses of HEL cell-derived tumor sections from methotrexate-treated and methotrexate plus histidine supplementation-treated mice. d. H&E images of SEM cell-derived tumor sections from all treatment groups. Three mice per group are presented.
Source data for Fig. 4 and Extended Data Fig. 6–8 can be found in the file Source Data_4.
Extended Data Figure 7. In vivo histidine supplementation increases flux through the histidine degradation pathway and sensitizes tumors to methotrexate (part 2).
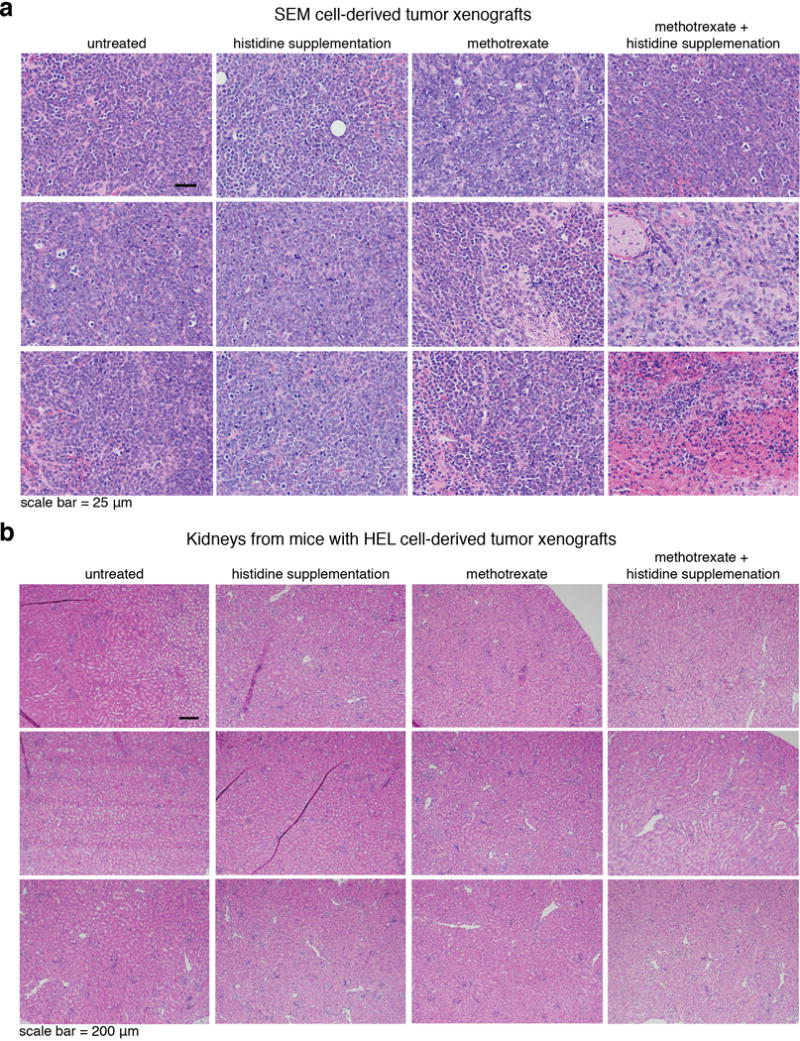
a. Higher magnification of H&E images of tumor sections from SEM cell-derived tumor-bearing mice from all groups. b. H&E analyses of kidney sections from HEL cell-derived tumor-bearing mice from all experimental groups.
Extended Data Figure 8. In vivo histidine supplementation increases flux through the histidine degradation pathway and sensitizes tumors to methotrexate (part 3).
THF levels decreased following methotrexate treatment and decreased even further when methotrexate was combined with histidine supplementation. Methotrexate levels were not different in tumors from mice treated with methotrexate alone or in combination with histidine supplementation. Nucleotide abundance was significantly lower in tumors from mice treated with methotrexate and histidine supplementation compared to tumors from vehicle-treated mice. p-values were calculated using non parametric one-way ANOVA for all comparisons (KW test), except for methotrexate – p values were calculated by two tailed t test. vehicle n=6, histidine n=6, methotrexate n=6, methotrexate + histidine n=7.
Extended Data Figure 9. In vivo histidine supplementation increases flux through the histidine degradation pathway and sensitizes tumors to methotrexate (part 4).
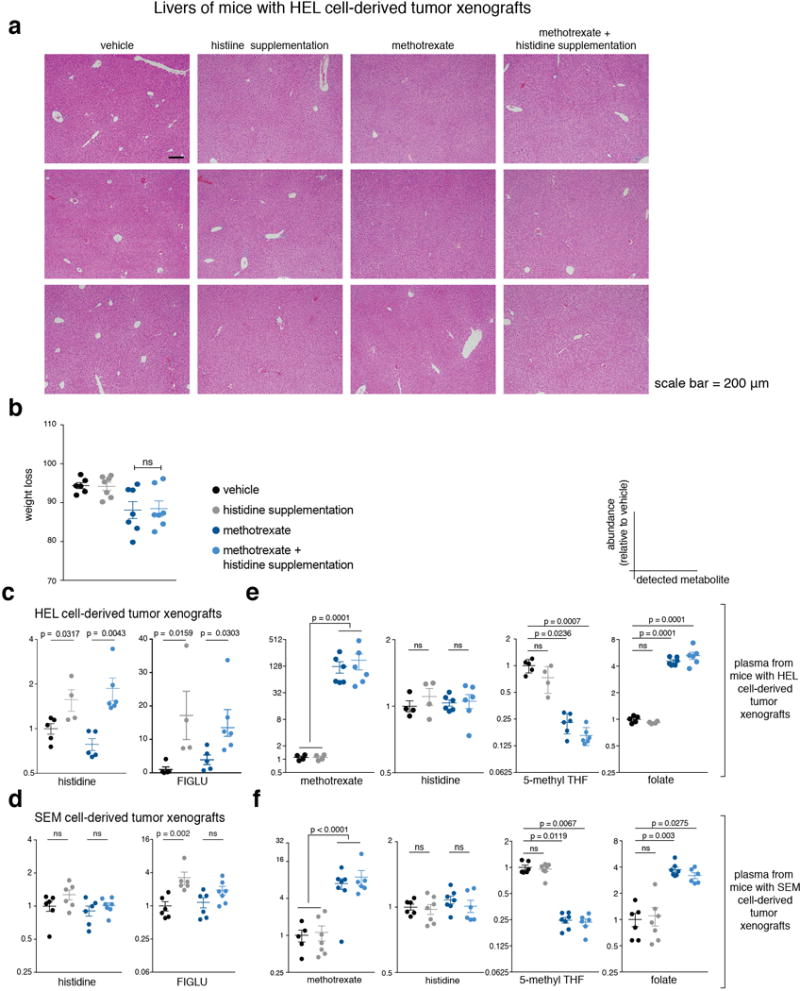
a. H&E analyses of liver sections from HEL cell-derived tumor-bearing mice from all experimental groups. b. Weight loss as percentage of the first experimental day, prior to treatment. p-value was calculated using non parametric t test (Mann-Whitney). c, d. Metabolites of the histidine degradation pathway were increased in HEL tumors from mice treated with histidine supplementation. Histidine (left) and FIGLU (right) levels were measured in tumors by LC/MS and normalized to isotopically-labeled histidine as an internal standard. p-values were calculated using non parametric t test (Mann-Whitney). All metabolites measured in tumors were normalized to an average of 4 amino acids (phenylalanine, leucine, valine and tyrosine) as an internal loading control. For HEL cell-derived tumor-bearing mice: vehicle n=5, histidine supplementation n=4, methotrexate n=5, methotrexate + histidine supplementation n=6. For SEM cell-derived tumor-bearing mice: vehicle n=6, histidine supplementation n=6, methotrexate n=6, methotrexate + histidine supplementation n=7 e, f. Plasma levels of methotrexate, histidine, 5-methyl THF and folate. Methotrexate was detected in the plasma of methotrexate-treated mice only (left chart). No significant difference in histidine levels was detected (second chart to the left). 5-methyl THF levels were significantly lower in the plasma of methotrexate-treated mice (second chart to the right). Folate levels increased in the plasma of methotrexate-treated mice (right chart). Metabolite levels were measured from fresh plasma samples by LC/MS and normalized to isotopically-labeled histidine or to aminopterin as an internal standard. p-values were calculated using non parametric one-way ANOVA. Group sizes are the same as in panels c,d.
Extended Data Figure 10. In vivo histidine supplementation sensitizes tumors to methotrexate without enhancement of treatment toxicity (part 1).
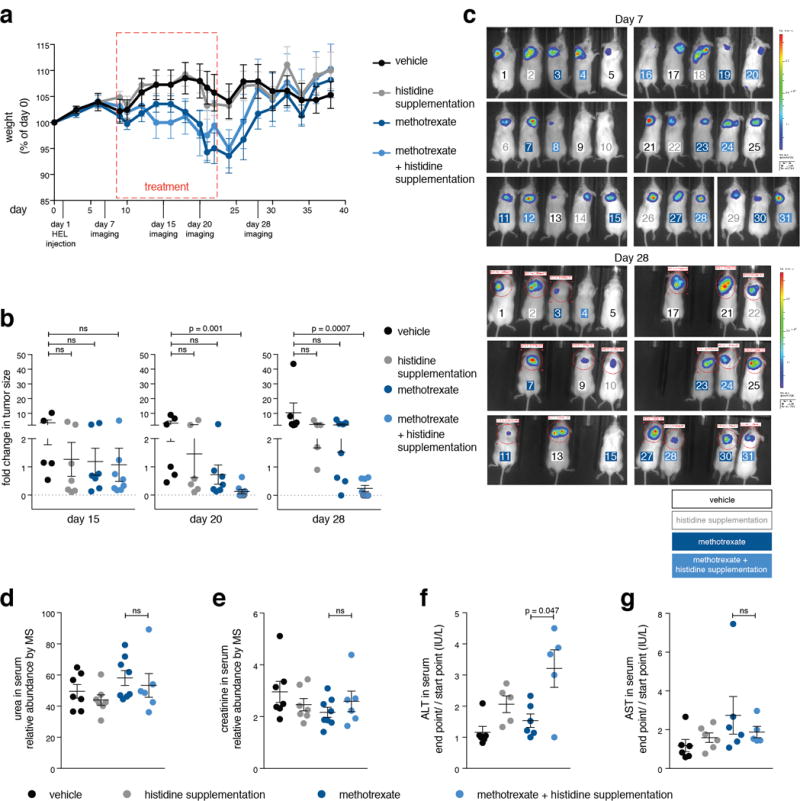
a. We evaluated whether methotrexate treatment combined with histidine supplementation might be more toxic than methotrexate alone by setting up a longer treatment regime of 15 days with a recovery period of two weeks. During the experiment we monitored weight loss and observed no difference between mice treated with methotrexate alone and those treated with methotrexate and histidine. NOD-SCID mice were injected with HEL cells subcutaneously on day 1, followed by weight measurement every other day, in vivo imaging of HEL cell-derived tumors (on days 7, 15, 20 and 28), treatment on days 12 to 23 (vehicle, histidine and methotrexate injections every other day), and final termination of the experiment after 40 days, unless an early euthanization was required in accordance with the guidelines for humane experimental end-point of the animal care committee at MIT. The experiment included four experimental groups: vehicle-treated (saline) (n=7), histidine supplementation (n=8), methotrexate-treated (n=8), and histidine supplementation combined with methotrexate treatment (n=8). Serum was collected at days zero and day 23 for metabolite profiling and liver diagnostics. Methotrexate dose used was 25 mg/kg based on the weight measured at day 0. Histidine dose was 18 mg per injection in 400 μl saline. b. Significant reduction in tumor size over time in mice treated with the combination of methotrexate and histidine supplementation. Tumors were imaged in vivo by luciferase expression at the indicated days. Fold changes in tumor sizes over measurements done on day 7 are presented. p-values were calculated by non parametric one-way ANOVA. Group size changed over time due to mice euthanization for humane reasons: on day 15: vehicle-treated (n=5), histidine supplementation (n=7), methotrexate-treated (n=7), and histidine supplementation combined with methotrexate treatment (n=8). on day 20: vehicle-treated (n=6), histidine supplementation (n=6), methotrexate-treated (n=7), and histidine supplementation combined with methotrexate treatment (n=8). on day 28: vehicle-treated (n=6), histidine supplementation (n=5), methotrexate-treated (n=7), and histidine supplementation combined with methotrexate treatment (n=8). c. in vivo imaging of luciferase-expressing HEL cell-derived tumors at days 7 (top) and 28 (bottom). Mice are numbered in color by their experimental group. All mice that participated in the experiment are shown, group size is the same as in panel a. d, e. No elevation in the abundance of serum markers indicative of kidney damage in methotrexate plus histidine supplementation-treated mice compared to methotrexate-treated mice. Markers of kidney toxicity (urea and creatinine) were measured by LC/MS in serum samples of the tested mice. Urea and creatinine relative abundance was normalized to isotopically-labeled valine and tryptophan as an internal standard. p-values were calculated using non parametric one-way ANOVA. Group size: vehicle-treated (n=7), histidine supplementation (n=7), methotrexate-treated (n=8), and histidine supplementation combined with methotrexate treatment (n=6). f, g. Some elevation in liver-toxicity markers in mice treated with the combined therapy compared to methotrexate alone. Markers of liver toxicity (ALT and AST) were measured by an external serum diagnostics lab (IDEXX) in serum samples of the tested mice. Measurement units are indicated. p-values were calculated using non parametric one-way ANOVA. Group size: vehicle-treated (n=6), histidine supplementation (n=6), methotrexate-treated (n=6), and histidine supplementation combined with methotrexate treatment (n=5).
Source data for Extended Data Fig. 9 can be found in the file Source Data_5.
Extended Data Figure 11. In vivo histidine supplementation sensitizes tumors to methotrexate without enhancement of treatment toxicity (part 2).
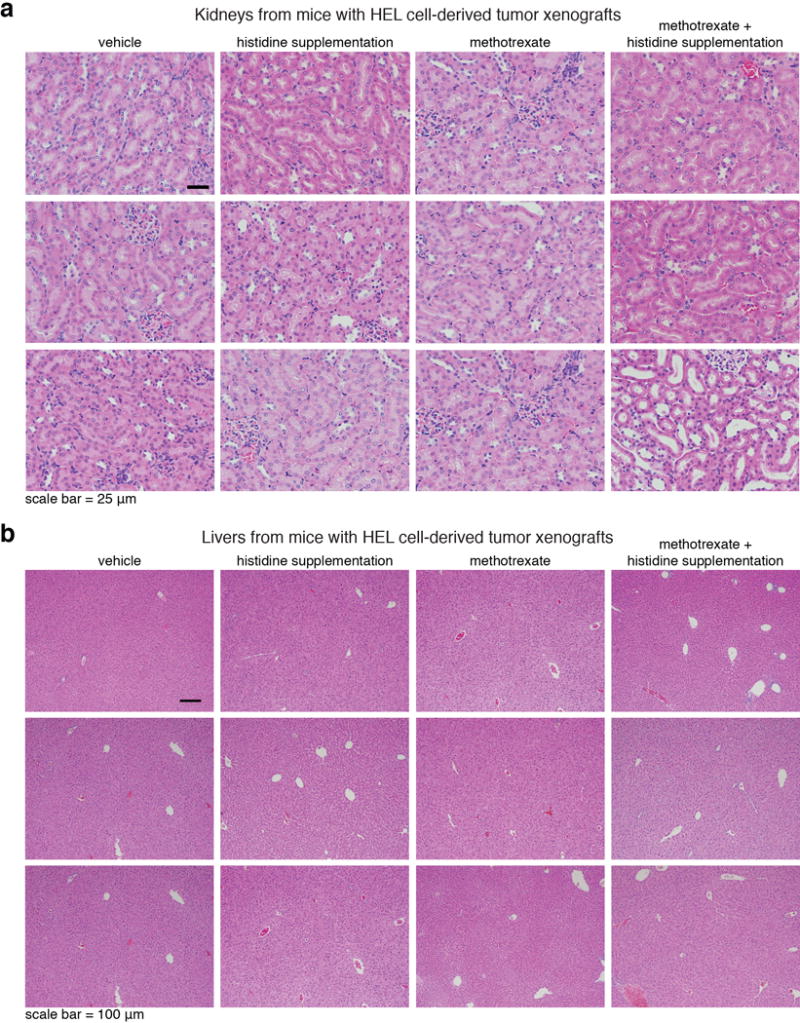
a, b. Histological analyses indicated that the kidney and liver appeared normal at the end of the two week recovery period. See also Supplementary Figure 3a “toxicity test_extra panels”, top panel. a. H&E analyses of kidney sections from mice from all experimental groups. Tissues were collected at the conclusion of the experiment, after two weeks recovery post treatment. Group sizes are the same as in Extended Data Fig. 9a. b. H&E analyses of liver sections from mice from all experimental groups. Group sizes are the same as in Extended Data Fig. 9a. Tissues were collected at the conclusion of the experiment, after two weeks recovery post treatment. See also Supplementary Figure 3b “toxicity test_extra panels”, bottom panel: No differences in the overall tissue morphology between methotrexate-treated mice and mice treated with methotrexate and histidine supplementation in intestines collected immediately at the end of a 5 day treatment. H&E analyses of intestine sections from mice from all experimental groups of mice bearing SEM tumors xenografts. These samples were collected immediately after the conclusion of a 5 day-therapy regime of daily injections, to allow the detection of acute damage to the intestine following the treatment and before recovery. This data show no difference in immediate damage to the intestine of mice treated with either methotrexate alone or methotrexate in combination with histidine supplementation.
Supplementary Material
Acknowledgments
We thank all members of the Sabatini lab for their advice and help. We thank Dr. Walter W. Chen and Dr. Lisa Shinefeld for helpful comments on the manuscript, Dr. Michael E. Pacold for useful advice, Dr. Malkiel Cohen for the R-luciferase expression vector, and Professor Matt Lazzara (University of Virginia), Professor Doug Lauffenburger (MIT), Dr. Marina Zaitseva (FDA), Professor Ayad M. Al-Katib (Wayne State University School of Medicine) and Professor Randy Jensen (University of Utah) for kindly providing cell lines. We thank Dr. Jacob Selhub (Tufts University) for helpful advice in the folate field. This work was supported by grants from NIH/NCI (R01 CA129105) to D.M.S. and the Department of Defense (W81XWH-15-1-0337) to E.F. Fellowship support was provided by EMBO (Long-Term Fellowship ALTF 350-2012) and the AACR (16-40-38-KANA) to N.K., by the American Cancer Society (PF-12-099-01-TBG) and the Koch Institute (Ludwig Postdoctoral Fellowship) to J.R.C., and by the EMBO (Long-Term Fellowship ALTF 1-2014) to M.A.-R. Additional support to N.K. was provided by the Women In Science/Revson Foundation Award (Weizmann Institute) and The Advancement of Women in Science Award (The Hebrew University). D.M.S. is an investigator of the Howard Hughes Medical Institute and an American Cancer Society Research Professor.
Footnotes
Author Contributions
N.K and D.M.S. formulated the research plan and interpreted experimental results. N.K. designed and performed all experiments with assistance from J.R.C. and M.A.-R. H.R.K. performed data analysis for the CRISPR/Cas9-based screen, CCLE gene expression data, and ALL patient data. J.R.C. carried out the genomic barcoding of 42 hematopoietic cell lines. E.F. and C.A.L. ran the metabolite-profiling core facility and E.F., C.A.L., S.H.C. and T.K advised and helped planning experiments for metabolites detection by LC/MS, S.H.C. and T.K assisted with LC/MS sample preparation and method running. L.D.S. designed and prepared some figures for the manuscript and N.K. and D.M.S. wrote the manuscript and all the authors edited it.
Competing interests
The authors declare no competing interests.
References
- 1.Farber S, Diamond LK. Temporary remissions in acute leukemia in children produced by folic acid antagonist, 4-aminopteroyl-glutamic acid. The New England journal of medicine. 1948;238:787–793. doi: 10.1056/NEJM194806032382301. [DOI] [PubMed] [Google Scholar]
- 2.Lieberman I, Ove P. Control of growth of mammalian cells in culture with folic acid, thymidine, and purines. The Journal of biological chemistry. 1960;235:1119–1123. [PubMed] [Google Scholar]
- 3.Hitchings GH, Burchall JJ. Inhibition of folate biosynthesis and function as a basis for chemotherapy. Advances in enzymology and related areas of molecular biology. 1965;27:417–468. doi: 10.1002/9780470122723.ch9. [DOI] [PubMed] [Google Scholar]
- 4.clinicaltrials.gov <https://clinicaltrials.gov/ct2/results?cond=&term=methotrexate&cntry1=&state1=&recrs=> 2017
- 5.Howard SC, McCormick J, Pui CH, Buddington RK, Harvey RD. Preventing and Managing Toxicities of High-Dose Methotrexate. The oncologist. 2016;21:1471–1482. doi: 10.1634/theoncologist.2015-0164. [DOI] [PMC free article] [PubMed] [Google Scholar]
- 6.Shalem O, et al. Genome-scale CRISPR-Cas9 knockout screening in human cells. Science. 2014;343:84–87. doi: 10.1126/science.1247005. [DOI] [PMC free article] [PubMed] [Google Scholar]
- 7.Wang T, Wei JJ, Sabatini DM, Lander ES. Genetic screens in human cells using the CRISPR-Cas9 system. Science. 2014;343:80–84. doi: 10.1126/science.1246981. [DOI] [PMC free article] [PubMed] [Google Scholar]
- 8.Solans A, Estivill X, de la Luna S. Cloning and characterization of human FTCD on 21q22.3, a candidate gene for glutamate formiminotransferase deficiency. Cytogenetics and cell genetics. 2000;88:43–49. doi: 10.1159/000015483. doi: 15483. [DOI] [PubMed] [Google Scholar]
- 9.Wilson PM, Danenberg PV, Johnston PG, Lenz HJ, Ladner RD. Standing the test of time: targeting thymidylate biosynthesis in cancer therapy. Nature reviews Clinical oncology. 2014;11:282–298. doi: 10.1038/nrclinonc.2014.51. [DOI] [PubMed] [Google Scholar]
- 10.Wang T, et al. Identification and characterization of essential genes in the human genome. Science. 2015;350:1096–1101. doi: 10.1126/science.aac7041. [DOI] [PMC free article] [PubMed] [Google Scholar]
- 11.Assaraf YG, Schimke RT. Identification of methotrexate transport deficiency in mammalian cells using fluoresceinated methotrexate and flow cytometry. Proceedings of the National Academy of Sciences of the United States of America. 1987;84:7154–7158. doi: 10.1073/pnas.84.20.7154. [DOI] [PMC free article] [PubMed] [Google Scholar]
- 12.Matherly LH, Taub JW. Methotrexate pharmacology and resistance in childhood acute lymphoblastic leukemia. Leukemia & lymphoma. 1996;21:359–368. doi: 10.3109/10428199609093433. [DOI] [PubMed] [Google Scholar]
- 13.Guo W, et al. Mechanisms of methotrexate resistance in osteosarcoma. Clinical cancer research : an official journal of the American Association for Cancer Research. 1999;5:621–627. [PubMed] [Google Scholar]
- 14.Mao Y, et al. Structure of the bifunctional and Golgi-associated formiminotransferase cyclodeaminase octamer. The EMBO journal. 2004;23:2963–2971. doi: 10.1038/sj.emboj.7600327. [DOI] [PMC free article] [PubMed] [Google Scholar]
- 15.Hatefi Y, Osborn MJ, Kay LD, Huennekens FM. Hydroxymethyl tetrahydrofolic dehydrogenase. The Journal of biological chemistry. 1957;227:637–647. [PubMed] [Google Scholar]
- 16.Field MS, Szebenyi DM, Stover PJ. Regulation of de novo purine biosynthesis by methenyltetrahydrofolate synthetase in neuroblastoma. The Journal of biological chemistry. 2006;281:4215–4221. doi: 10.1074/jbc.M510624200. [DOI] [PubMed] [Google Scholar]
- 17.La Du BN, Howell RR, Jacoby GA, Seegmiller JE, Zannoni VG. The enzymatic defect in histidinemia. Biochemical and biophysical research communications. 1962;7:398–402. doi: 10.1016/0006-291x(62)90323-6. [DOI] [PubMed] [Google Scholar]
- 18.humancyc.org 2017
- 19.Yu C, et al. The development of PIPA: an integrated and automated pipeline for genome-wide protein function annotation. BMC bioinformatics. 2008;9:52. doi: 10.1186/1471-2105-9-52. [DOI] [PMC free article] [PubMed] [Google Scholar]
- 20.Brand LM, Harper AE. Studies on the production and assessment of experimental histidinemia in the rat. Biochimica et biophysica acta. 1976;444:294–306. doi: 10.1016/0304-4165(76)90246-4. [DOI] [PubMed] [Google Scholar]
- 21.broadinstitute.org/ccle, <broadinstitute.org/ccle>
- 22.Cooper SL, Brown PA. Treatment of pediatric acute lymphoblastic leukemia. Pediatric clinics of North America. 2015;62:61–73. doi: 10.1016/j.pcl.2014.09.006. [DOI] [PMC free article] [PubMed] [Google Scholar]
- 23.Kodidela S, Suresh Chandra P, Dubashi B. Pharmacogenetics of methotrexate in acute lymphoblastic leukaemia: why still at the bench level. European journal of clinical pharmacology. 2014;70:253–260. doi: 10.1007/s00228-013-1623-4. [DOI] [PubMed] [Google Scholar]
- 24.Roberts KG, et al. Targetable kinase-activating lesions in Ph-like acute lymphoblastic leukemia. The New England journal of medicine. 2014;371:1005–1015. doi: 10.1056/NEJMoa1403088. [DOI] [PMC free article] [PubMed] [Google Scholar]
- 25.Liem NL. Characterization of childhood acute lymphoblastic leukemia xenograft models for the preclinical evaluation of new therapies. Blood. 2004;103:3905–3914. doi: 10.1182/blood-2003-08-2911. [DOI] [PubMed] [Google Scholar]
- 26.Holmes WB, Appling DR. Cloning and characterization of methenyltetrahydrofolate synthetase from Saccharomyces cerevisiae. The Journal of biological chemistry. 2002;277:20205–20213. doi: 10.1074/jbc.M201242200. [DOI] [PubMed] [Google Scholar]
- 27.Stover P, Schirch V. Serine hydroxymethyltransferase catalyzes the hydrolysis of 5,10-methenyltetrahydrofolate to 5-formyltetrahydrofolate. The Journal of biological chemistry. 1990;265:14227–14233. [PubMed] [Google Scholar]
- 28.Stover P, Kruschwitz H, Schirch V. Evidence that 5-formyltetrahydropteroylglutamate has a metabolic role in one-carbon metabolism. Advances in experimental medicine and biology. 1993;338:679–685. doi: 10.1007/978-1-4615-2960-6_141. [DOI] [PubMed] [Google Scholar]
- 29.Birsoy K, et al. Metabolic determinants of cancer cell sensitivity to glucose limitation and biguanides. Nature. 2014;508:108–112. doi: 10.1038/nature13110. [DOI] [PMC free article] [PubMed] [Google Scholar]
- 30.Wang T, Lander ES, Sabatini DM. Single Guide RNA Library Design and Construction. Cold Spring Harbor protocols. 2016;2016 doi: 10.1101/pdb.prot090803. pdb prot090803. [DOI] [PMC free article] [PubMed] [Google Scholar]
- 31.Wang T, Lander ES, Sabatini DM. Viral Packaging and Cell Culture for CRISPR-Based Screens. Cold Spring Harbor protocols. 2016;2016 doi: 10.1101/pdb.prot090811. pdb prot090811. [DOI] [PMC free article] [PubMed] [Google Scholar]
- 32.Wang T, Lander ES, Sabatini DM. Large-Scale Single Guide RNA Library Construction and Use for CRISPR-Cas9-Based Genetic Screens. Cold Spring Harbor protocols. 2016;2016 doi: 10.1101/pdb.top086892. pdb top086892. [DOI] [PMC free article] [PubMed] [Google Scholar]
- 33.Consortium, T.R. The RNAi Consortium shRNA Library. 2017 < https://http://www.broadinstitute.org/rnai-consortium/rnai-consortium-shrna-library>.
- 34.Chen L, Ducker GS, Lu W, Teng X, Rabinowitz JD. An LC-MS chemical derivatization method for the measurement of five different one-carbon states of cellular tetrahydrofolate. Analytical and bioanalytical chemistry. 2017 doi: 10.1007/s00216-017-0514-4. [DOI] [PMC free article] [PubMed] [Google Scholar]
- 35.Allen F, Pon A, Wilson M, Greiner R, Wishart D. CFM-ID: a web server for annotation, spectrum prediction and metabolite identification from tandem mass spectra. Nucleic acids research. 2014;42:W94–99. doi: 10.1093/nar/gku436. [DOI] [PMC free article] [PubMed] [Google Scholar]
- 36.Bocker S, Duhrkop K. Fragmentation trees reloaded. Journal of cheminformatics. 2016;8:5. doi: 10.1186/s13321-016-0116-8. [DOI] [PMC free article] [PubMed] [Google Scholar]
- 37.Duhrkop K, Shen H, Meusel M, Rousu J, Bocker S. Searching molecular structure databases with tandem mass spectra using CSI:FingerID. Proceedings of the National Academy of Sciences of the United States of America. 2015;112:12580–12585. doi: 10.1073/pnas.1509788112. [DOI] [PMC free article] [PubMed] [Google Scholar]
- 38.Fernandez CA, Des Rosiers C, Previs SF, David F, Brunengraber H. Correction of 13C mass isotopomer distributions for natural stable isotope abundance. Journal of mass spectrometry : JMS. 1996;31:255–262. doi: 10.1002/(SICI)1096-9888(199603)31:3<255::AID-JMS290>3.0.CO;2-3. doi:10.1002/(SICI)1096-9888(199603)31:3<255::AID-JMS290>3.0.CO;2-3. [DOI] [PubMed] [Google Scholar]
- 39.Lewis CA, et al. Tracing compartmentalized NADPH metabolism in the cytosol and mitochondria of mammalian cells. Molecular cell. 2014;55:253–263. doi: 10.1016/j.molcel.2014.05.008. [DOI] [PMC free article] [PubMed] [Google Scholar]
Associated Data
This section collects any data citations, data availability statements, or supplementary materials included in this article.
Supplementary Materials
Data Availability Statement
The authors declare that all data generated or analyzed during this study are included in this published version and its supplementary information files. Extended Data Figures 1–10, as well as Source Data for Figures 1- 4 and for Extended Data Figure 10 are provided with the online version of the paper.