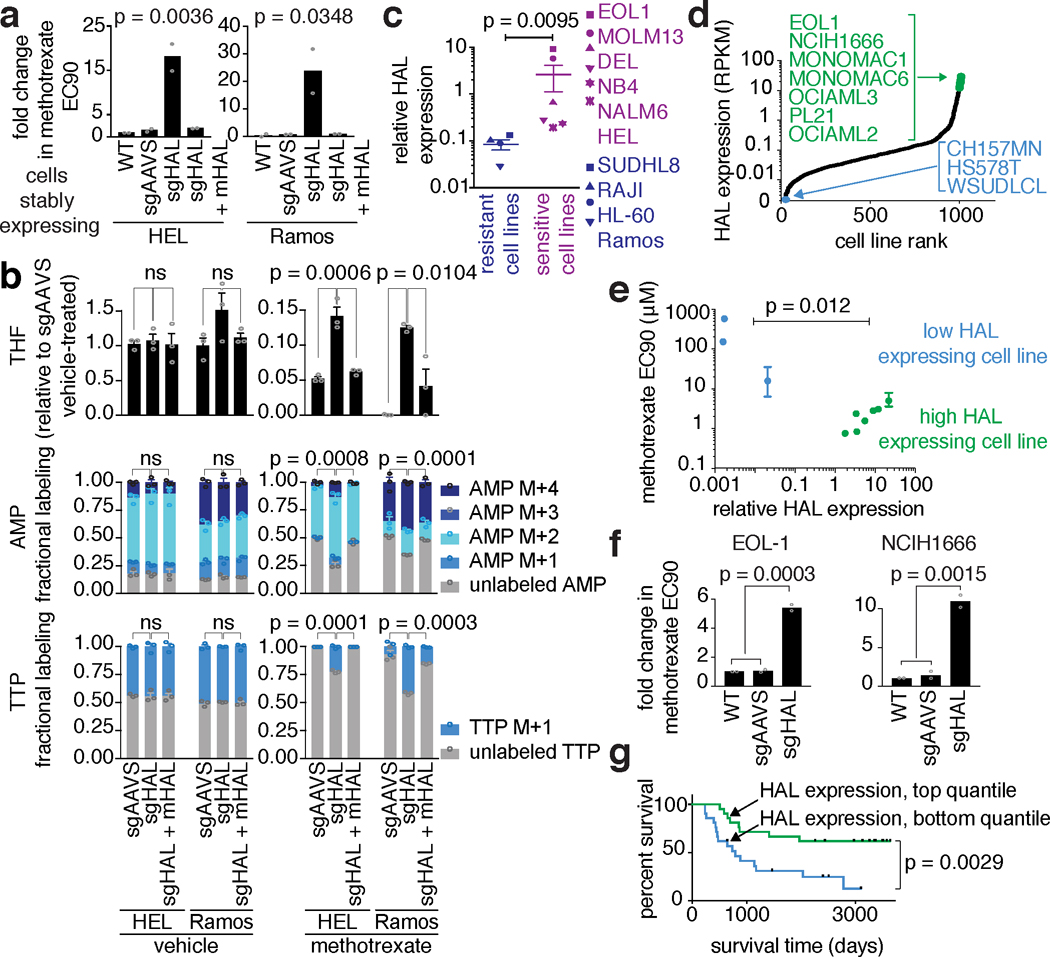
Figure 3. The histidine degradation pathway affects the sensitivity of cancer cells to methotrexate and HAL expression is associated with treatment response in acute lymphoblastic leukemia (ALL) patients.
a. CRISPR/Cas9-induced HAL depletion decreased the sensitivity of HEL and Ramos cells to methotrexate. Shown is the average fold change in the methotrexate EC90 relative to WT (n=2, biological replicates, one-way ANOVA, as multiple comparisons between sgHAL and each of the other samples). b. Greater cellular pool of THF in methotrexate-treated cells following HAL depletion. Top - THF levels were measured by LC/MS in vehicle- and methotrexate-treated HEL and Ramos cells. Newly synthesized adenosine monophosphate (AMP, middle) and TTP (bottom) in HAL-depleted and control cells, treated with methotrexate, shown by [U-13C] serine labeling (n=3, biological replicates, for THF - one-way ANOVA, for AMP and TTP two-way ANOVA for the unlabeled fraction) c. HAL expression is significantly higher in cells that are more sensitive to methotrexate. The response to methotrexate was determined in a pooled fashion using genomically barcoded cell lines (Fig. 1a). HAL expression was measured by qPCR (n=4 for resistant cell lines and n=6 for sensitive cell lines, biologically independent samples, KS test). d-e. Differences in HAL expression are associated with methotrexate sensitivity in cancer cell lines. d. Cell lines were ranked by HAL expression according to RNAseq data21. Green - cell lines with high HAL expression. Blue - cell lines with low HAL expression. e. HAL expression (by qPCR) and methotrexate EC90 are shown for each of the colored cell lines from Fig. 3d (Low HAL - n=3, high HAL - n=7, KS test, individual EC90 values: n=2, biological replicates). f. CRISPR/Cas9- depletion of HAL in EOL-1 and NCIH1666 cells decreased their sensitivity to methotrexate. Shown are fold changes in methotrexate EC90 compare to WT (n=2, biological replicate, one-way ANOVA). g. HAL expression predicts better survival in pediatric ALL patients treated with a regimen that included methotrexate. Kaplan-Meier curves of overall survival of ALL patients with high (top quantile, green) or low (bottom quantile, blue) expression of HAL24 (n=21).

