Abstract
Neuroimaging plays a critical role in the setting in traumatic brain injury (TBI). Diffusion tensor imaging (DTI) is an advanced magnetic resonance imaging technique that is capable of providing rich information on the brain’s neuroanatomic connectome. The purpose of this article is to systematically review the role of DTI and advanced diffusion techniques in the setting of TBI, including diffusion kurtosis imaging (DKI), neurite orientation dispersion and density imaging, diffusion spectrum imaging, and q-ball imaging. We discuss clinical applications of DTI and review the DTI literature as it pertains to TBI. Despite the continued advancements in DTI and related diffusion techniques over the past 20 years, DTI techniques are sensitive for TBI at the group level only and there is insufficient evidence that DTI plays a role at the individual level. We conclude by discussing future directions in DTI research in TBI including the role of machine learning in the pattern classification of TBI.
Keywords: diffusion tensor imaging, tractography, traumatic brain injury
Traumatic brain injury(TBI) is a common problem that affects 1.7 million people and results in 275,000 hospitalizations and 52,000 deaths in the United States annually. The incidence in emergency room visits related to TBI has been increasing over the past decade.1–3 Adults older than 75 years of age have higher rates of hospitalization and death.1 The most common causes of TBI are motor vehicle accidents, falls, sports-related injury, and assault,1–3 with falls being the most common overall while motor vehicle accidents are the most common cause of TBI-related deaths.1 In the military population, TBI is common in soldiers who have been exposed to an explosion.4 According to the Veterans Health Administration, the cost of treating a patient with TBI for the first year averages $11,700, whereas the cost of treating a non-TBI patient is $2400.4 The clinical symptoms from TBI range from mild cognitive impairment to severe disability.
Neuroimaging plays a critical role in the acute setting to guide appropriate management by detecting injuries that require intervention or further monitoring. For example, in the setting of severe TBI, the detection of an epidural hematoma may require emergent neuro-surgical management. However, in the setting of a concussion, conventional magnetic resonance imaging (MRI) is typically normal.5 Many advanced neuroimaging techniques are actively being researched in an attempt to better diagnose concussions.
In contrast, diffusion tensor imaging (DTI) is an advanced MRI technique that came into existence in the mid-1980s and is capable of providing rich information on the brain’s neuroanatomic connectome.6,7 DTI metrics are thought to reflect the integrity of microstructural properties of white matter and have been applied extensively as neuroimaging biomarkers to study a range of clinical conditions.8
This article will review the potential benefits and challenges of using DTI in TBI. First, we briefly introduce the fundamental principles that subtend DTI. We then present an overview of DTI, and image acquisition techniques and processing methods for techniques beyond DTI. Next, we review clinical applications of DTI, with a focus on its use in imaging TBI. We then conclude with a discussion on future directions of DTI research.
FUNDAMENTALS OF DTI IMAGING
The white matter of the human brain is composed of axons. These axons travel from gray matter wherein the cell bodies of the neurons are located to other areas of the brain or spinal cord. Axon bundles traveling together constitute white matter tracts, which putatively connect functionally specialized yet segregated regions of the brain.
Conventional MRI is unable to visualize many of these white matter tracts. This is because conventional MRI contrast resolution is based solely on T1 and T2 relaxation times and white matter tracts have similar T1 and T2 relaxation times irrespective of the direction of the tracts.
DTI allows for visualization of these white matter tracts by imaging the anisotropy of water diffusion9–13 (Fig. 1). Many excellent books and review articles have been published discussing DTI imaging methodology in detail.11–16
FIGURE 1.
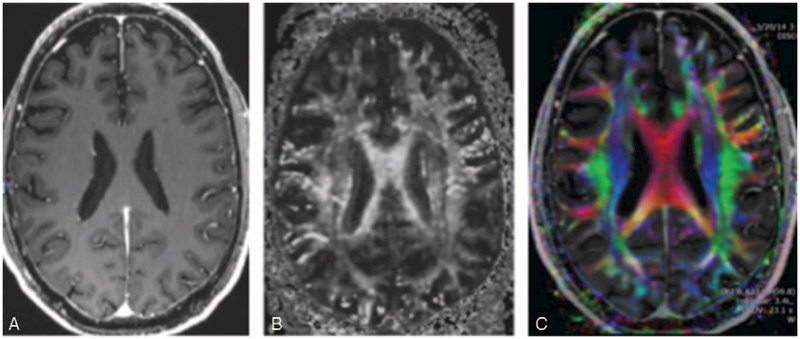
(A) T1-weighted inversion recovery prepared fast spoiled gradient-recalled (IR-FSPGR) postcontrast image. There is no ability to distinguish the different fiber tracts. For example, all of the white matter tracts within the centrum semiovale and the same intensity and directional information cannot be obtained. (B) DTI fractional anisotropy gray scale image. There is varying signal intensities within the white matter tracts within the centrum semiovale and fiber tracts are visualized separately. (C) DTI color-coded fractional anisotropy. The colors correspond to the direction of the fiber tracts with red, blue, and green tracts denoting transverse, superior-inferior, and anterior-posterior directions, respectively. Different components of white matter fascicles can be much more clearly delineated.
Mori15 explains the concept of water diffusion by providing the analogy of an ink drop falling onto a piece of paper, with the subsequent diffusion (or spread) of the ink on the paper. As the ink spot grows over time, the rate of growth correlates to the rate of diffusion. If we extend this heuristic, isotropic diffusion occurs when the ink drop grows equally in all directions. Anisotropic diffusion occurs if the ink drop grows preferentially in 1 direction, such as would be seen if the ink drop fell onto a piece of fabric made up of woven fibers that were more tightly packed in 1 direction. In white matter tracts, water tends to have preferential diffusion along the axons and the shape of the ink spot would be more elliptical. Cell membranes, axons, and myelin sheaths contribute to white matter tract anisotropy, with axons thought to be the major component.17
The pulse sequence for any DTI imaging technique is a spin-echo diffusion-weighted pulse sequence. DTI is able to image the anisotropy of white matter tracts by applying diffusion weighting in multiple different spatial directions using diffusion-sensitizing gradients. For example, the same white matter tract has different diffusivity constants depending on the direction of the diffusion-sensitizing gradient applied (Fig. 2). For each diffusion-sensitizing gradient, there is a 4D data set with x, y, z spatial locations with a diffusion constant that is proportional to the magnitude or rate of water diffusion. This process needs to be repeated with a minimum of 6 diffusion-sensitizing gradients and will ultimately yield a set of vectors that can be used to generate a structural connectivity map of the brain.
FIGURE 2.
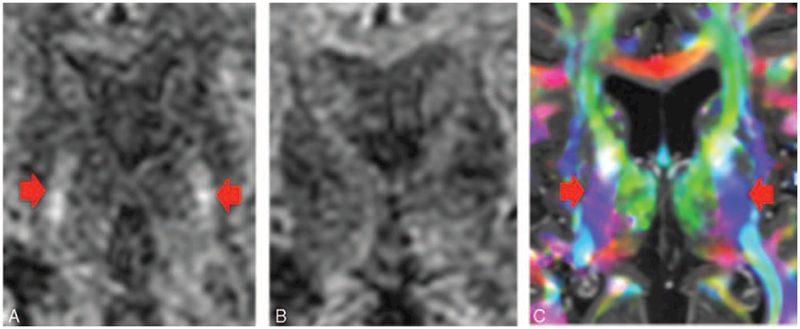
(A) Diffusion-weighted image. The corticospinal tracts (CSTs) coursing through the posterior limb of the internal capsule (denoted by the arrows) are hyperintense. (B) Diffusion-weighted image with different gradient direction. Note that the CST coursing through the posterior limb of the internal capsule have lost their signal. The diffusion signal goes down if the gradient is applied along the axis of diffusion. Therefore, if the diffusion-encoding gradient is directed superior–inferior, then the CST will decrease in signal intensity on the diffusion-weighted image. Similarly, if the diffusion-encoding gradient is directed anterior–posterior, then the superior longitudinal fasciculus will decrease in signal intensity. Finally, if the diffusion-encoding gradient is directed transversely, then the portions of the corpus callosum will decrease in signal intensity. (C) DTI color-coded fractional anisotropy map. The CSTs running through the posterior limb of the internal capsule are denoted by the blue color, which indicates the tracts are coursing in the superior–inferior direction.
KEY CONSIDERATIONS IN PERFORMING TRACTOGRAPHY
The first key consideration in performing tractography is determining the diffusion model and whether to choose a model-based or model-free technique. The second key consideration is how to deal with the uncertainty in the tractography whether to perform deterministic or probabilistic tractography.
Model-Based Versus Model-Free Techniques
The most commonly used model-based technique is DTI. Other model-based approaches include diffusion kurtosis imaging (DKI) and neurite orientation dispersion and density imaging (NODDI).18 The model-based approaches are based on an assumption of the fiber orientation within each voxel. For example, a single tensor model is based on the assumption that the voxel is composed of a single fiber orientation, whereas a 2-tensor model assumes that voxels are composed of 2-fiber orientations. DTI uses a Gaussian approximation for diffusion. DKI is based on a Kurtosis model, which characterizes the non-Gaussianity of the diffusion. In order to recover the brain’s complex neuroanatomic connectome, sampling must be performed along with many different diffusion-sensitizing orientations, called high angular sampling. We will therefore discuss high angular resolution diffusion imaging (HARDI) acquisition technique. We will also discuss multi-band acquisitions, a method to speed up acquisition.
In contrast to the assumptions used in the model-based diffusion techniques, the model-free approaches estimate the fiber orientation with a 3D measurement of the water diffusion in the voxel of interest.
The 3D data acquired for these approaches are called q-space signal.19 These model-free methods have the potential for more accurate characterization of the structural and orientation of the white matter tracts. The most commonly used model-free technique is diffusion spectrum imaging (DSI).
Deterministic Versus Probabilistic Tractography
Deterministic tractography assumes a single orientation at each voxel, such that a single tract is determined at each voxel. All of the clinical applications are based on deterministic tractography. Probabilistic tractography is based on a distribution of multiple possible orientations at each voxel with each orientation having an associated probability.
IMAGE ACQUISITION
DTI Imaging Acquisition
The simplest form of DTI is the single tensor (or single ellipsoid) model. This form requires at least 2 B-values: 1 B = 0 mm/s2 reference image and 1 additional B-value (eg, B ¼ 1000 mm/s2) upon which the diffusion-sensitizing gradients are applied. Two B-values are required in order to perform a Gaussian model for the diffusion process. Another requirement for this single tensor DTI is the use of a minimum of 6 diffusion-sensitizing gradients, which is also referred to as directions; this obtains enough information to reconstruct the orientation and anisotropy information. The field of view for DTI imaging has no overlap and no skip between successive slices. Slice thickness and matrix size are variably set, but a standard protocol typically consists of a thickness of 2.0 mm and a matrix of 128 × 128.20,21Techniques that use few directions (such as the single tensor model using 6 directions) are unable to resolve crossing fibers. Accurate measurement of parameters such as fractional anisotropy (FA) requires approximately 25 to 30 diffusion directions depending on signal to noise ratio (SNR) of the individual diffusion-weighted images.22
The total number of volumes in a DTI series can be defined as of volumes in a DTI series = References volumes + of diffusionen-coding volumes.
The total number of images in a DTI series can be defined as of images in a DWI series = slices in B0 reference image + additional B values × of directions × of slicesinthe brain.
For example, the number of images in a DTI series for acquisition with 40 directions, 63 slices in the brain, and a B0 reference image of 63 images would equal 63 + 1 × 40 × 63 a total of 2583 images. This sequence takes approximately 8 minutes on a 3-Tesla scanner. Each image in a DTI series is referred to as a diffusion constant map, which represents the raw data for a particular gradient direction and a particular B-value. Thus, after repeating acquisition for all directions and all B-values, each pixel will have a magnitude associated with each gradient direction.
SNR and Tradeoffs
As with any MRI sequence, the goal of DTI is to provide the optimum SNR. For a single magnetic resonance (MR) image, the SNR is defined by the equation23:
where:S represents the mean signal intensity within a region of interest
σ represents the standard deviation within that region of interest
SNR is most commonly measured in the B = 0 reference image. Repetition of acquisition with the same diffusion-sensitizing gradient can be performed with data averaging on the MRI scanner to improve SNR. The addition of more encoding directions can also improve the SNR in addition to the ability to resolve crossing fibers. These SNR improving techniques come with the penalty of longer scan acquisition. Longer sequences have their own potential undesirable consequences such as motion artifact. There is still debate regarding the tradeoff between repeat acquisition and more encoding directions, with some studies suggesting that more encoding directions are better at improving SNR (eg,24,25); however, there is evidence to the contrary (eg,26).
Acquisition Issues
DTI relies on echo planar imaging (EPI) pulse sequences, which can take several minutes to acquire, when whole brain coverage is desired. Parallel imaging can reduce distortion,27 with a reduction in echo time that can balance the loss in SNR as a result of g-factor noise. Multi-band sequences have revolutionized DTI by parallelizing slice excitation28 and acquiring several slices simultaneously.29 The total scan time can be reduced by 3- to 5-fold depending on coil sensitivity and by acquiring multiple slices simultaneously and separating the simultaneous acquisitions mathematically, with very little penalty on SNR.29 This accelerated scan protocol also reduces the time during which subject movement can occur during a scan. Movement artifacts can bias both FA and mean diffusivity (MD) DTI metrics,28 which are discussed further below, leading to spurious conclusions, particularly at the group level.30 Recently, multiband imaging has been shown to reduce the biased effects of subject motion.31
Diffusion Kurtosis Imaging Acquisition
DKI is similar to DTI, but provides further characterization of the water diffusion by estimating the kurtosis of the distribution. Kurtosis is a dimensionless higher-order statistic that quantifies the non-Gaussianity of a distribution. Two distributions with the same mean and variance may have different kurtosis values. For example, a positive kurtosis measurement means that the distribution is more strongly peaked.32 In addition to the standard diffusion tensor in DTI, DKI also requires an additional tensor called the diffusional kurtosis tensor. Thus, a minimum of 3 B-values are required33 and a minimum of 15 different diffusion gradient directions are also required.34,35
The key advantages of DKI are the improved ability to resolve intravoxel crossing fibers resulting in an overall improvement of white matter tractography36 and the added specificity and sensitivity of DKI metrics such as mean kurtosis or radial kurtosis.37 DKI acquisition can typically be performed on conventional MRI scanners. A limitation of DKI is its longer scan time than DTI, typically requiring 10 to 20 minutes per acquisition.
HARDI Acquisition
HARDI is an acquisition technique used in DTI that uses high number of directions (eg, 40 or more). HARDI are typically acquired with higher diffusion sensitization than DTI. HARDI acquisitions are most often followed by spherical deconvolution-based processing methods such as constrained spherical deconvolution (CSD). CSD is able to resolve multiple fiber orientations within a single voxel.38 The limitation of HARDI acquisition is the longer scan time. Each additional direction requires another diffusion sensitizing gradient.
Q-Space Acquisition
As is true with any DTI sequence, the pulse sequence for the acquisition of Q-space is a spin-echo diffusion-weighted pulse sequence. Q-space acquisition uniquely uses a series of 2 short, but very strong diffusion gradients applied to ‘‘label’’ the molecule during the diffusion process. Then, a displacement distribution function (or probability density function) is derived to calculate the 3D diffusion-driven displacement measurement of MR signal at each point (qx, qy, qxz) within the Q-space. A diffusion-weighted image is acquired for each diffusion-encoding step (q-value). Thus, a total of Nqx × Nqy × Nqz diffusion-weighted images are required to sample Q-space of size Nqx, Nqy, Nq.39 The large number of images required to obtain Q-space information is a limitation of bringing this technology to clinical application. There are several Q-space based techniques, most notably DSI and q-ball imaging (QBI). Q-space sampling schemes are displayed in Fig. 3.40
FIGURE 3.

Representation of q-space sampling schemes: single-shell (A), multi-shell (B), and Cartesian (C). The black dots in the left and middle panel indicate 64 gradient directions, optimized on the half-sphere, the red dots those same gradient directions mirrored on the other side of the sphere. The blue and green dots in the middle panel represent a similar sampling on a shell with a lower b-value (or q-value). The Cartesian sampling is shown for a 7 × 7 × 7 cubic grid for visualization purposes (DSI default is 11 × 11 × 11). The black dots again represent points in q-space with qz ≥ 0 and the red dots indicate qz < 0.
DSI Acquisition
DSI is a Q-space based technique that uses HARDI acquisition with a 3D Cartesian sampling scheme of each voxel.39 This method of processing was developed in attempt to resolve multiple intravoxel fiber crossings by imaging the spectra of water diffusion.41 DSI uses the probability density function to describe the diffusion process within each voxel, and it requires a sufficient signal sample to resolve this diffusion probability density function. In order to achieve the sufficient signal, repeated diffusion gradients42 and high spectral bandwidth41 are required. DSI acquisition involves up to 5 to 10 times more data. DSI with 515 diffusion-encoding gradients takes approximately 1 hour, whereas reducing the number of diffusion-encoding gradients to 203 reduces the time to approximately 30 minutes.43 These longer scan times allow for increased motion artifact. Despite these high requirements and long image acquisition times, DSI is now clinically available.44
Q-Ball Acquisition
QBI is a model-free Q-space based technique that uses HARDI acquisition with a spherical sampling scheme of each voxel involving only a single-shell B-value.39 QBI also requires repeated gradients and high bandwidth; however, these are 2 to 3 times lower than that of DSI. In addition, QBI does not require as great a demand for the gradient performance as compared with DSI. Consequently, QBI is more efficient, but is not as accurate as DSI; however, QBI is more feasible for clinical applications.43
Neurite Orientation Dispersion and Density Imaging Acquisition
Projections from a cell body of a neuron are referred to as neurites and may take the form of either axons or dendrites. Neurite density and orientation dispersion estimates are 2 key contributing factors to FA. NODDI acquisition is a technique that uses a 2-shell HARDI acquisition and a 3-compartment model [including the intracellular volume (ICV), extracellular volume (ECV), and cerebrospinal fluid] in an attempt to separate out neurite density from orientation dispersion estimates in an attempt to improve the map, dendrites, and axons in the brain.18
IMAGE PROCESSING
DTI Processing
DTI, the most common and simplest method of diffusion imaging, processes the diffusion anisotropy data with a Gaussian model and a mathematical process referred to as diagonalization of the tensor.45,46 For each voxel, a set of directions and magnitudes forming a 3D ellipsoid can be generated, which represents the local cytoarchitecture. The 3D ellipsoid is characterized with 3 eigenvectors defining the axes with 3 associated eigenvalues (l) defining the lengths. MD is a scalar metric representing total amount of diffusion at a voxel and is calculated as the average of the 3 eigenvalues.47 FA is a scalar metric representing the relative anisotropy at a voxel and is a scalar metric between 0 and 1. FA is calculated as the square root of the sum of squares of the diffusivity differences divided by the square root sum of squares of the diffusivities.47 FA can characterize the 3D ellipsoid as linear, planar, or spherical. An FA value of 0 would represent perfectly isotropic diffusion, which is equal diffusion in all directions. An FA of 1 would represent an infinite cylinder (Fig. 4).
FIGURE 4.
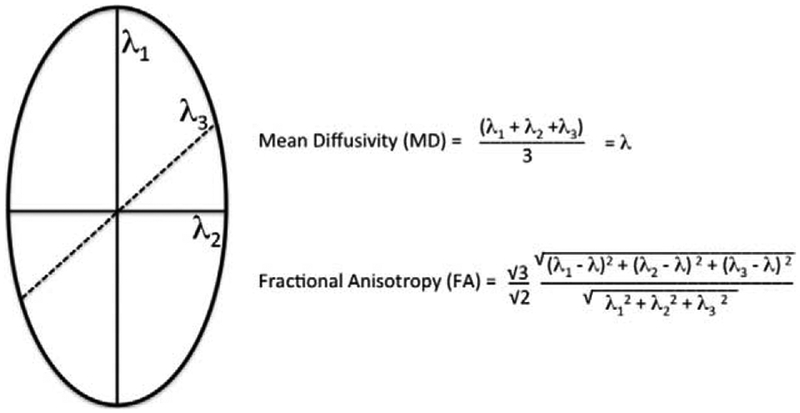
3D ellipsoid with MD and FA.
The diffusion tensor model assumes that there is a single ellipsoid with all axons traveling in the same direction within each imaging voxel. This model requires 7 measurements including 1 B0 and 6 gradient directions to determine the 3D ellipsoid and is therefore time efficient; however, the key limitation is the ability to assess fiber tracts crossing within a voxel. For many of the voxels in the human brain, this assumption is not true.48,49 In fact, it has recently been suggested that over 90% of voxels contain crossing fibers50 and resolving these intravoxel crossing fibers is particularly important for visualization of smaller tracts.51 DTI and advanced techniques are summarized in Table 1.
TABLE 1.
Summary of Diffusion Techniques
| Technique | Information Acquired at Each Voxel | Advantages | Disadvantages | |
|---|---|---|---|---|
| Model-based techniques | DTI | 3D diffusion tensor | Short acquisition time; validated metrics; reproducible; hardware readily available | Hypothesis driven and the assumption may not be accurate for voxels containing multiple fiber orientations |
| DKI | 3D diffusion and 3D kurtosis tensors | Better at resolving intravoxel crossing fibers; Hardware readily available | Longer scan times; Hypothesis driven and the assumption may not be accurate for voxels containing multiple fiber orientations | |
| NODDI | Orientation dispersion, intracellular volume fraction, free water component | Intracellular volume fraction should be like FA except should not go down as much in regions of fiber crossings. Only a few parameters are fitted. | Longer scan times to acquire 2 b-shells. Long processing time. | |
| CSD | 3D fiber orientation distribution | Can resolve fiber crossings; Tolerable acquisition times | No validated metrics | |
| Model-free techniques | DSI | 3D diffusion displacement distribution | Can resolve fiber crossings | Long acquisition time; no validated metrics; hardware demands |
| QBI | 3D fiber orientation distribution | Can resolve fiber crossings; tolerable acquisition times | No validated metrics; hardware demands |
CSD, constrained spherical deconvolution; DKI, diffusion kurtosis imaging; DSI, diffusion spectrum imaging; DTI, diffusion tensor imaging; NODDI, neurite orientation dispersion and density imaging; QBI, Q-ball.
DKI Processing
Although DTI uses a Gaussian water diffusion probability function, DKI uses a non-Gaussian probability function. In addition to the DTI metrics of FA and MD, DKI processing provides an additional set of metrics including the mean, axial, and radial kurtosis.32 These additional metrics help characterize the non-Gaussianity of the water diffusion distribution.32 A positive kurtosis value would mean that the curve is more strongly peaked than a Gaussian distribution with the same variance. DKI processing helps resolve crossing fiber tracks, which are within a voxel36 (Fig. 5).
FIGURE 5.
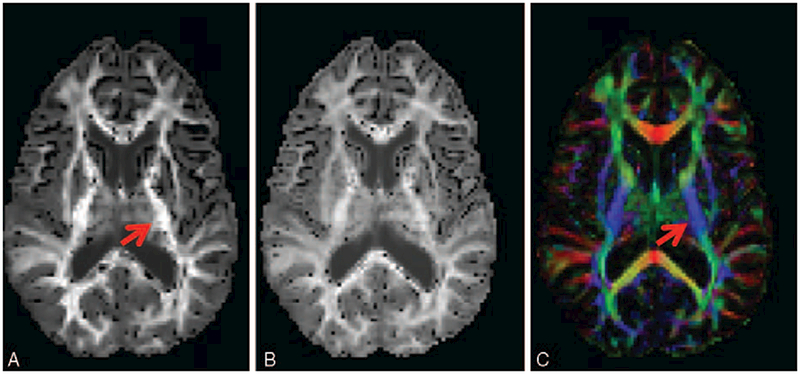
DKI images showing diffusion-encoded color DEC-map (A), and mean and radial kurtosis (B and C, respectively). Nonzero Kurtosis means non-Gaussian diffusion, with positive kurtosis indicating that the distribution is more peaked. In terms of neuronal tissue, this is often caused by restricted diffusion, as for instance is the case inside axons. Arrows indicate the posterior limb of the internal capsule (similar to Fig. 2), wherein the high radial kurtosis is an indication of restricted diffusion perpendicular to the main fiber orientation (CST). Acquisition: 112 × 112 matrix with 22.4 × 22.4 cm field-of-view, 70 axial slices of 2 mm thickness. 6 b = 0 images, 60 gradient directions at b ¼ 1200 s/mm2 and 60 gradient directions at b = 2500 s/mm2. TE/TR = 107 ms/10.3 s, acquisition time 21m33.
Constrained Spherical Deconvolution processing
Recovering the single or multiple-fiber orientations in each voxel is done on the basis of the diffusion properties of a single fiber. These single-fiber properties can be derived from the diffusion tensor or obtained directly from the data in regions with 1-fiber orientation, such as the posterior limb of the internal capsule or corpus callosum. With this knowledge, the measured diffusion signals are mathematically deconvolved to obtain a fiber orientation distribution that contains the orientations of all fibers within that voxel. CSD works optimally with high b-values (eg, 2500–3000 s/mm2) but can still resolve crossing fibers at regular clinical b-values.
DSI Processing
Recall that DSI is a model-free approach. The signal at each voxel within the diffusion-weighted spin echo images is reconstructed into a 3D probability density function of spin displacements using the 3D Fourier transform of the signal. DSI is able to resolve multiple intravoxel fiber crossings by imaging the spectra of water diffusion.41 On a 3T scanner, it was found that if the bmax (diffusion sensitivity) is optimized, DSI can achieve similar angular precision for both higher and lower number of diffusion gradients. Thus, the DSI scan with 515 gradients with bmax of 6500 s/mm2 and DSI scan with 203 gradients and bmax of 4000 s/mm2 can achieve similar angular precision of 8 degrees for single fibers and 30 degrees for crossing fibers.43
QBI Processing
Recall that QBI is also a model-free approach. Vector math called the Funk Radon Transform is used and geometric tomography and probability distributions to describe the diffusion process within each voxel are determined (Fig. 6). This probability distribution is similar in concept to the fiber orientation distribution from CSD. This process helps to resolve intravoxel fiber crossings, and ultimately, a fiber orientation distribution function (fODF) is obtained. Optimizing the bmax for QBI has found similar angular precision as DSI for single and crossing fibers for QBI when using both high number of diffusion gradients (493 diffusion gradients with bmax of 3000 s/mm2) and lower number of diffusion gradients (253 diffusion gradients with bmax of 2500 s/mm2).43
FIGURE 6.
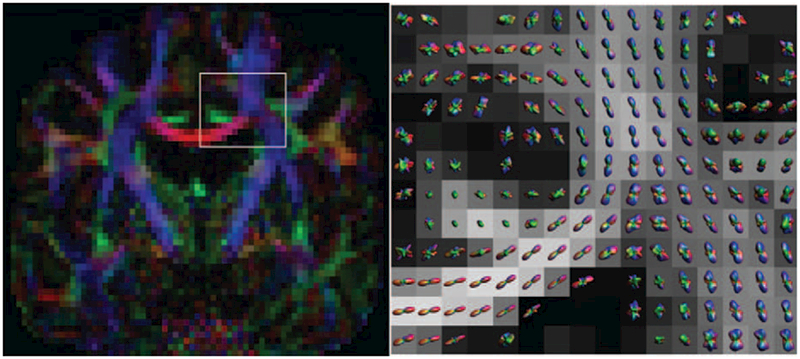
Example output from a Q-ball Imaging scan. On the left, a conventional diffusion-encoded color map. On the right, a zoomed region—as indicated—with the probability distributions in each voxel shown over an FA map. Clear single-fiber areas (corpus callosum) and crossing fiber areas (more laterally) can be observed in these voxel-wise distributions, with QBI being able to resolve these fiber crossings. QBI acquisition: 112 × 112 matrix with 22.4 × 22.4cm field-of-view, 70 axial slices of 2 mm thickness. 6 b = 0 images, 60 gradient directions at b = 2500s/mm2. SENSE acceleration factor 2, TE/TR = 107ms/10.3 s, acquisition time 11m20s.
Neurite Orientation Dispersion and Density Imaging processing
NODDI’s 3-compartmental tissue requires a unique model for each compartment. The white matter ICV is composed of the volume bounded by the membranes of the neurites and the ODF is modeled with the Watson distribution. The white matter ECV is composed of the space between the neuritis. The ECV is not restricted by the membranes of the neurites and an anisotropic Gaussian model is used. The CSF compartment is modeled by an isotropic diffusion model. A NODDI sequence can be performed in 10 minutes18 (Fig. 7).
FIGURE 7.
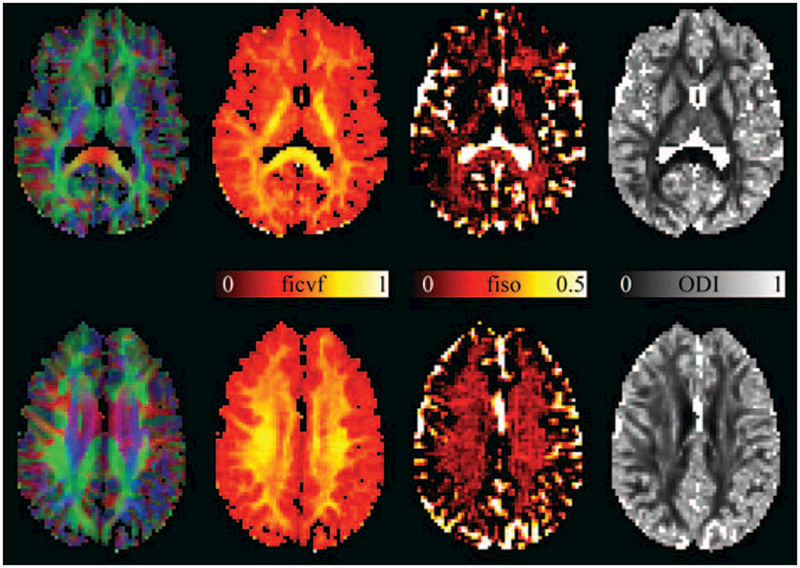
Example images from model parameters from NODDI, the intracellular volume fraction (ficvf), isotropic volume fraction (fiso), and orientation dispersion index (ODI). The color-encoded DEC map is shown on the left to indicate location within the brain. Values of ficvf are high in neurite-rich areas such as white matter, as can most clearly be seen in the internal capsule and the splenium of the corpus callosum. The fiso maps accurately highlight the ventricles and surrounding CSF that have a very high isotropic diffusivisity. The orientation dispersion index (ODI) maps the dispersion of neurites around the principal diffusion direction. In single-fiber regions in the white matter, this can be regarded as an indication of the coherence of the axons in that voxel. This can most clearly be seen in the posterior limb of the internal capsule, wherein the ODI is low indicating high axonal coherence. NODDI scan parameters: 96 × 96 matrix, 240 × 240 mm FOV, 50 slices of 2.5 mm thickness, 11 b = 0 images, and 8, 32, and 64 DWIs at b-values of 300, 700, and 2500 s/mm2, respectively. SENSE acceleration factor 2, TE/TR 71.7/5200 ms, acquisition time 9m58 s.
CLINICAL PRACTICE OF DTI
There are multiple workstations available to the radiologist, which allow the selection of a tract by drawing a region of interest (ROI) to “seed” or select the fiber tracts of interest entering through this ROI (Fig. 8). Additional “include” and “exclude” boundaries can be set to isolate the tract of interest. The typical parameters are as follows: FA threshold of 0.2, maximum angle between current major eigenvector and previous major eigenvector of 37 degrees, minimum fiber length of 50 mm, and number of starting points per voxel of 8.52 DTI is typically used in clinical applications such as mapping a tract before a neurosurgical procedure.
FIGURE 8.
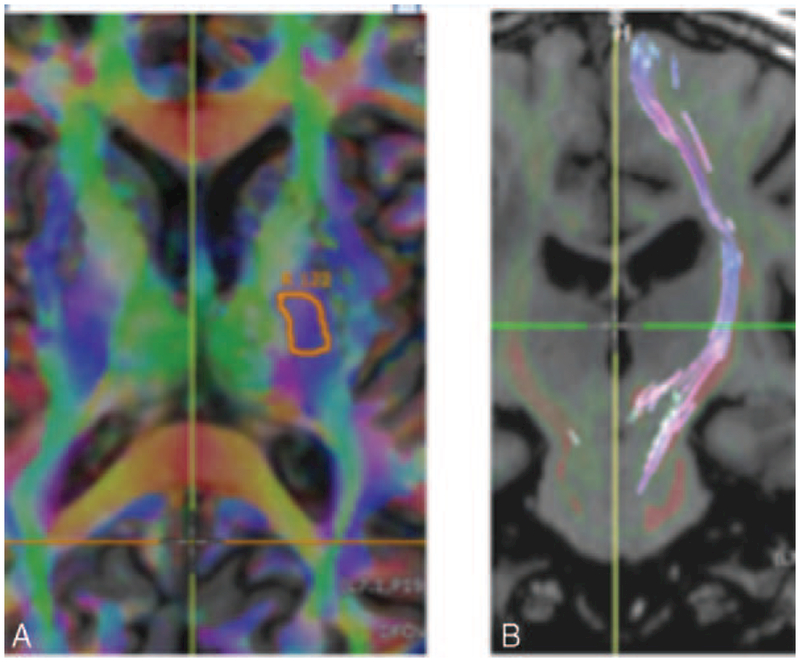
(A) Axial DTI Anisotropy map overlaid on a T1 IR-FSPGR image demonstrates a ‘‘seed’’ site at the left CST at the left posterior limb of the internal capsule. (B) Coronal T1 IR-FSPGR image with the left CST colored and coursing superior-inferior.
One of the limitations that the radiologist commonly experiences is that a high fraction of fibers in the ROI does not travel the full distance. One reason for this is that a fiber tract of interest crosses several other tracts before reaching its final destination. These locations of crossing fibers have a reduced FA. A voxel may contain 2 white matter tracts coursing in different directions. This would result in loss of anisotropy. Such a voxel will have low diffusion signal intensity and will appear dark. Fiber crossing causes a problem in clinical DTI, as some tracts simply cannot be visualized throughout their course (Fig. 9). In clinical practice, this can be a major limitation for performing tractography, and this is the problem that more advanced methods are currently trying to solve.
FIGURE 9.
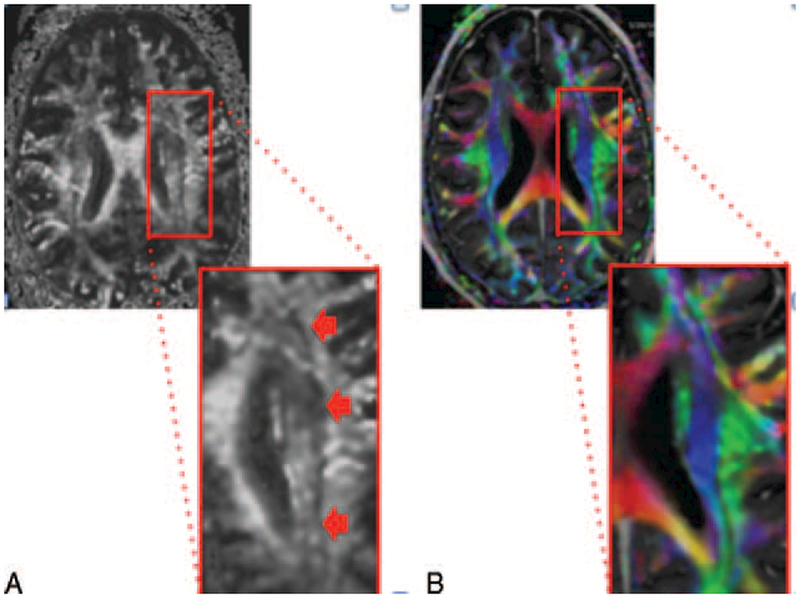
Figure illustrating fiber tract crossing. (A) The image on the left is a DTI fractional anisotropy gray scale image. The dark band denoted by the arrows in the corona radiata white matter represents the intersection between the superior-inferior oriented corticospinal tract located medially and the anterior-posterior oriented superior longitudinal fasciculus. The dark pixels at the interface between these 2 perpendicularly oriented tracts occur because the tensor model cannot distinguish between low anisotropy as a result of a weak primary bundle and low anisotropy as a result of crossing fibers. (B) The image on the right is a DTI anisotropy color map, which shows the blue corticospinal tract and the green superior longitudinal fasciculus with a thin black line at the interface.
DTI CLINICAL APPLICATIONS
The majority of clinical applications of tractography involve preoperative neurosurgical planning to identify a specific white matter tract coursing in the vicinity of the lesion. This can help the neurosurgeon determine the amount of tissue he can take before reaching the white matter tract of interest (Fig. 10).
FIGURE 10.
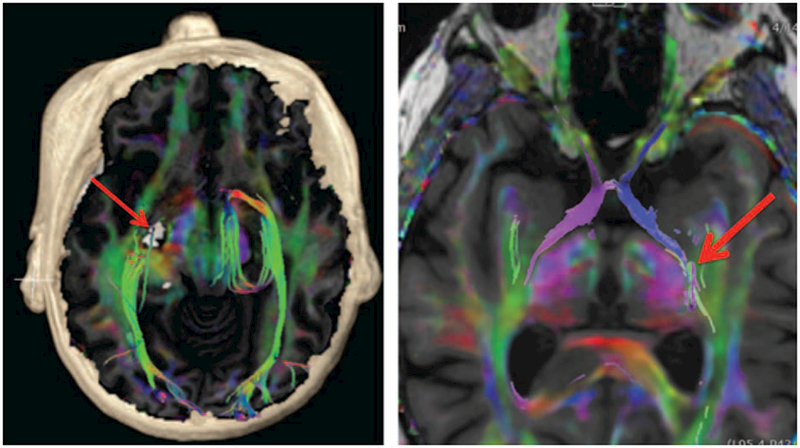
Example of clinical DTI imaging. Axial-fused T1 IR-FSPGR and color FA map with volume rendering (left image) was performed for preoperative planning in a patient with a presumed cavernous malformation (red arrow) in close proximity to the lateral geniculate nucleus with selective tractography of the optic radiations (predominantly green tracts bilaterally). Axial-fused T1 IR-FSPGR and color FA map with selective tractography of the bilateral optic tracts (left side is blue and right side is purple) extending toward the lateral geniculate nucleus (red arrow). Note that the chiasm and the optic nerves can also be seen further anteriorly.
DTI TBI APPLICATIONS
There have been numerous studies involving DTI in the TBI population. We will review the current literature and provide a discussion on future DTI research.
Review of Current Literature of DTI Studies in TBI
There are many DTI studies in the literature for TBI. Many studies have found decreased FA and increased MD in the TBI population as compared with the control group.53–70 The mechanism of decreased FA is thought to be as a result of demyelination or disruption of the microstructure of the tissue.
For example, 1 study by Hart et al70 studied 26 retired NFL players, of whom 39% were cognitively impaired and 59% were cognitively normal. DTI analysis revealed statistically significant reduced FA in the bilateral frontal, bilateral parietal, corpus callosum, and left temporal lobe in the cognitively impaired group, but no statistically significant difference between the cognitively unimpaired group and the controls.70
Another study by Wilde et al53 imaged 43 children with moderate to severe TBI and compared them with controls who had sustained orthopedic injury. Statistically significant decreased FA was found in the cingulum bundle in the TBI group.53
Miles et al57 imaged 17 patients with mild TBI and 29 age-matched controls and found decreased FA in the centrum semiovale, corpus callosum, and posterior limb of the internal capsule.
Newcombe et al imaged 33 patients with moderate to severe TBI and compared them with 28 age-matched controls. This study analyzed whole brain white matter injury by assessing the proportion of voxels falling below a critical FA threshold. A statistically significant reduced FA was found in the TBI group.
Many studies, including those mentioned, demonstrate the common finding of decreased FA at the group level; however, the specific locations of decreased FA are variable. This variability may be as a result of the heterogeneity of the cohorts involved in these studies, such as severity and locations of TBIs, variability of the timing of imaging, and variability of imaging parameters.71 DTI has been found to be sensitive for detection of acute and chronic TBI changes within the brain at the group level.72
Despite the sensitivity of decreased FA at the group level of TBI, the finding of decreased FA lacks specificity. Alterations in FA can be seen in a variety of other neurological conditions, particularly those that affect the white matter.
In conclusion, DTI techniques are sensitive for TBI at the group level only for population-based research. There remains insufficient evidence at the present time to suggest that DTI plays a clinical role in patients with TBI at the individual level.72,73
FUTURE DTI RESEARCH IN TBI
As a result of the fact that conventional MRI can be normal in mild TBI, there is a strong need for bringing advanced neuroimaging including DTI to clinical practice at the individual level. In addition to advances in acquisition and processing of DTI, there are continued improvements in clinical scanner performance. These improvements are helping advanced DTI techniques become a part of routine clinical protocols.
Despite all of these advances, DTI has limited application to TBI at the individual patient level. One barrier is a current lack of reference imaging data across an age-stratified normal population. A solution is to have a normative database with variations. Then, it will be possible to perform advanced computational analysis of the patient’s scan and compare the results with the normative database in assessment for injury. At the Joint ASNR-ACR-HII-ASFNR TBI workshop on May 23, 2014 in Montreal, Canada, these issues were discussed including the formation of a consensus of the ideal database, normal control subject, and standardizing clinical and research neuroimaging protocols. With a normative database, future DTI research with computer-aided diagnosis and machine learning (ML) could be performed and has the potential for a more refined diagnosis.
Pattern Classification in TBI
The heterogeneity of TBI is considerable, and this variability represents a major obstacle in finding effective treatments at the individual level.74 Pattern classification, synonymous with ML, has become a core tool for studying neuroimaging data during the past decade. As a result of their inherent multivariate nature, pattern classifiers may be capable of revealing effects that may otherwise be invisible with conventional univariate statistics.75–77 In this sense, ML tools may reveal patterns of brain signal data consistent with etiological, symptom-based, prognostic, and pathoanatomic classifications of TBI.74
Pattern classification refers to the process of training a computer algorithm to ‘‘learn’’ from past experience. Classifiers operate on ‘‘features,’’ or descriptive variable categories (eg, DTI FA values) for the purpose of either prediction or description. When applied in a predictive capacity, classification takes place within a supervised framework and each set of features is paired with an outcome label.78 Together, these can be used to predict a binary diagnosis (eg, microbleed or normal) or multilevel outcome (eg, 1–15 on the Glasgow Coma Scale). For example, ML applied to DTI data was able to discriminate between patients with microbleeds and age-matched controls with a high degree of accuracy.79 Combining DTI with additional MRI metrics has also been successful in classifying patients with mild TBI from controls with up to 86% accuracy.80
Ideally, however, ML algorithms could be applied for the dual purpose of classification and interpretation of the informative MRI features that are used for prediction. Great care should be taken when attempting this, as data features are typically assigned weights in order to collaboratively optimize discrimination using a multidimenstional hyperplane. Therefore, data features that absorb noise with little information on their own may be assigned a strong weight.81 When the data features are statistically independent, as would be the case for independent component features, this issue is less problematic.82,83 However, in most applications, data features should be back projected into their native space before interpretation.81
In supervised learning, each data feature must be assigned a label (eg, TBI or healthy control). In many instances, however, the number of labels may be unknown. For example, one may wish to understand the number of underlying symptom clusters that exist under the broad definition of TBI. In this case, unsupervised learning may be appropriate. For example, nonnegative matrix factorization has recently been applied to ADHD data to uncover both the number of archetypal patient ‘‘clusters’’ in this population, as well as the phenotypic and neuroimaging linkages that are associated with each group.84 Unsupervised analysis applied to DTI data has recently revealed a linkage between induction of MCP-1 following TBI and a predisposition for development of Alzheimer disease.85
Structure-Function Integration
As discussed above, development of a canonical DTI reference atlas across the lifespan is imperative. Nonetheless, in isolation, DTI may prove insufficient to fully understand the neural and cellular underpinnings of TBI, and a multimodal fusion approach may be more effective. In addition to clustering and pattern classification methods, structural connectivity measures derived from DTI data have been used as priors in estimating effective connectivity measures from functional MRI data within the context of dynamic causal modeling analysis.86 An integrated structure-function approach that combines clinical information may yield insights into the phenomenology of TBI and future directions for treatment pathways.
Footnotes
The authors report no conflicts of interest.
REFERENCES
- 1.Faul M, National Center for Injury Prevention and Control (U.S.). Traumatic brain injury in the United States: emergency department visits, hospitalizations, and deaths, 2002–2006. http://purl.fdlp.gov/GPO/gpo41911. Accessed March 1, 2010.
- 2.Marin JR, Weaver MD, Yealy DM, et al. Trends in visits for traumatic brain injury to emergency departments in the United States. JAMA. 2014;311:1917–1919. [DOI] [PubMed] [Google Scholar]
- 3.Centers for Disease C, Prevention. Nonfatal traumatic brain injuries related to sports and recreation activities among persons aged </=19 years-United States, 2001–2009. MMWR Morb Mortal Wkly Rep. 2011; 60:1337–1342. [PubMed] [Google Scholar]
- 4.Bass E, Golding H, United States. Congressional Budget Office. The Veterans Health Administration’s treatment of PTSD and traumatic brain injury among recent combat veterans A CBO study. Washington, DC: Congress of the United States, Congressional Budget Office; 2012. http://purl.fdlp.gov/GPO/gpo18872. Accessed May 15, 2012. [Google Scholar]
- 5.McCrory P, Meeuwisse W, Johnston K, et al. Consensus statement on concussion in sport: the 3rd International Conference on Concussion in Sport held in Zurich, November 2008. J Athl Train. 2009;44:434–448. [DOI] [PMC free article] [PubMed] [Google Scholar]
- 6.Golby AJ, Kindlmann G, Norton I, et al. Interactive diffusion tensor tractography visualization for neurosurgical planning. Neurosurgery. 2011;68:496–505. [DOI] [PMC free article] [PubMed] [Google Scholar]
- 7.Gong G, He Y, Concha L, et al. Mapping anatomical connectivity patterns of human cerebral cortex using in vivo diffusion tensor imaging tractography. Cerebral Cortex. 2009;19:524–536. [DOI] [PMC free article] [PubMed] [Google Scholar]
- 8.Johansen-Berg H Behavioural relevance of variation in white matter microstructure. Curr Opin Neurol. 2010;23:351–358. [DOI] [PubMed] [Google Scholar]
- 9.Basser PJ. New histological and physiological stains derived from diffusion-tensor MR images. Ann N Y Acad Sci. 1997;820:123–138. [DOI] [PubMed] [Google Scholar]
- 10.Basser PJ, Mattiello J, LeBihan D. Estimation of the effective self-diffusion tensor from the NMR spin echo. J Magn Reson B. 1994;103:247–254. [DOI] [PubMed] [Google Scholar]
- 11.Le Bihan D, Mangin JF, Poupon C, et al. Diffusion tensor imaging: concepts and applications. J Magn Reson Imaging. 2001;13:534–546. [DOI] [PubMed] [Google Scholar]
- 12.Le Bihan D Looking into the functional architecture of the brain with diffusion MRI. Nat Rev Neurosci. 2003;4:469–480. [DOI] [PubMed] [Google Scholar]
- 13.Mori S, Zhang J. Principles of diffusion tensor imaging and its applications to basic neuroscience research. Neuron. 2006;51:527–539. [DOI] [PubMed] [Google Scholar]
- 14.Basser PJ, Jones DK. Diffusion-tensor MRI: theory, experimental design and data analysis-a technical review. NMR Biomed. 2002;15:456–467. [DOI] [PubMed] [Google Scholar]
- 15.Mori S Introduction to Diffusion Tensor Imaging. New York: Elsevier; 2007. [Google Scholar]
- 16.Behrens T J-B H. Diffusion MRI: From Quantitative Measurements to In Vivo Neuroanatomy. London: Academic Press; 2009. [Google Scholar]
- 17.Beaulieu C The basis of anisotropic water diffusion in the nervous system-a technical review. NMR Biomed. 2002;15:435–455. [DOI] [PubMed] [Google Scholar]
- 18.Zhang H, Schneider T, Wheeler-Kingshott CA, et al. NODDI: practical in vivo neurite orientation dispersion and density imaging of the human brain. NeuroImage. 2012;61:1000–1016. [DOI] [PubMed] [Google Scholar]
- 19.PT. C Principles of Nuclear Magnetic Resonance Microscopy. New York: Oxford University Press; 1991. [Google Scholar]
- 20.Mori S, Wakana S, Nagae-Poetscher LM, et al. MRI Atlas of Human White Matter. Amsterdam: Elsevier; 2005. [Google Scholar]
- 21.Jones DK, Leemans A. Diffusion tensor imaging. Methods Mol Biol. 2011;711:127–144. [DOI] [PubMed] [Google Scholar]
- 22.Skare S, Hedehus M, Moseley ME, et al. Condition number as a measure of noise performance of diffusion tensor data acquisition schemes with MRI. J Magn Reson. 2000;147:340–352. [DOI] [PubMed] [Google Scholar]
- 23.Ogura A, Miyai A, Maeda F, et al. [Accuracy of signal-to-noise ratio measurement method for magnetic resonance images]. Nihon Hoshasen Gijutsu Gakkai Zasshi. 2003;59:508–513. [DOI] [PubMed] [Google Scholar]
- 24.Ni H, Kavcic V, Zhu T, et al. Effects of number of diffusion gradient directions on derived diffusion tensor imaging indices in human brain. AJNR Am J Neuroradiol. 2006;27:1776–1781. [PMC free article] [PubMed] [Google Scholar]
- 25.Correia MM, Carpenter TA, Williams GB. Looking for the optimal DTI acquisition scheme given a maximum scan time: are more b-values a waste of time? Magn Reson Imaging. 2009;27:163–175. [DOI] [PubMed] [Google Scholar]
- 26.Lebel C, Benner T, Beaulieu C. Six is enough? Comparison of diffusion parameters measured using six or more diffusion-encoding gradient directions with deterministic tractography. Magn Reson Med. 2012;68: 474–483. [DOI] [PubMed] [Google Scholar]
- 27.Bammer R, Auer M, Keeling SL, et al. Diffusion tensor imaging using single-shot SENSE-EPI. Magn Reson Med. 2002;48:128–136. [DOI] [PubMed] [Google Scholar]
- 28.Moeller S, Yacoub E, Olman CA, et al. Multiband multislice GE-EPI at 7 tesla, with 16-fold acceleration using partial parallel imaging with application to high spatial and temporal whole-brain fMRI. Magn Reson Med. 2010;63:1144–1153. [DOI] [PMC free article] [PubMed] [Google Scholar]
- 29.Feinberg DA, Setsompop K. Ultra-fast MRI of the human brain with simultaneous multi-slice imaging. J Magn Reson. 2013;229:90–100. [DOI] [PMC free article] [PubMed] [Google Scholar]
- 30.Yendiki A, Koldewyn K, Kakunoori S, et al. Spurious group differences due to head motion in a diffusion MRI study. NeuroImage. 2013;88C:79–90. [DOI] [PMC free article] [PubMed] [Google Scholar]
- 31.Kong XZ. Association between in-scanner head motion with cerebral white matter microstructure: a multiband diffusion-weighted MRI study. PeerJ. 2014;2:e366. [DOI] [PMC free article] [PubMed] [Google Scholar]
- 32.DeCarlo LT. On the meaning and use of kurtosis. Psychol Meth. 1997;2: 292–307. [Google Scholar]
- 33.Jensen JH, Helpern JA, Tabesh A. Leading non-Gaussian corrections for diffusion orientation distribution function. NMR Biomed. 2014;27:202–211. [DOI] [PMC free article] [PubMed] [Google Scholar]
- 34.Jensen JH, Helpern JA. MRI quantification of non-Gaussian water diffusion by kurtosis analysis. NMR Biomed. 2010;23:698–710. [DOI] [PMC free article] [PubMed] [Google Scholar]
- 35.Tabesh A, Jensen JH, Ardekani BA, et al. Estimation of tensors and tensor-derived measures in diffusional kurtosis imaging. Magn Reson Med. 2011;65:823–836. [DOI] [PMC free article] [PubMed] [Google Scholar]
- 36.Lazar M, Jensen JH, Xuan L, et al. Estimation of the orientation distribution function from diffusional kurtosis imaging. Magn Reson Med. 2008;60: 774–781. [DOI] [PMC free article] [PubMed] [Google Scholar]
- 37.Umesh Rudrapatna S, Wieloch T, Beirup K, et al. Can diffusion kurtosis imaging improve the sensitivity and specificity of detecting microstructural alterations in brain tissue chronically after experimental stroke? Comparisons with diffusion tensor imaging and histology. NeuroImage. 2014;97:363–373. [DOI] [PubMed] [Google Scholar]
- 38.Tournier JD, Calamante F, Connelly A. Robust determination of the fibre orientation distribution in diffusion MRI: non-negativity constrained super-resolved spherical deconvolution. NeuroImage. 2007;35:1459–1472. [DOI] [PubMed] [Google Scholar]
- 39.Van AT, Granziera C, Bammer R. An introduction to model-independent diffusion magnetic resonance imaging. Topics Magn Reson Imaging. 2010;21:339–354. [DOI] [PMC free article] [PubMed] [Google Scholar]
- 40.Jones DK, Horsfield MA, Simmons A. Optimal strategies for measuring diffusion in anisotropic systems by magnetic resonance imaging. Magn Reson Med. 1999;42:515–525. [PubMed] [Google Scholar]
- 41.Wedeen VJ, Hagmann P, Tseng WY, et al. Mapping complex tissue architecture with diffusion spectrum magnetic resonance imaging. Magn Reson Med. 2005;54:1377–1386. [DOI] [PubMed] [Google Scholar]
- 42.Tian L, Yan H, Zhang D. [Diffusion spectrum magnetic resonance imaging]. J Peking Univ Health Sci. 2009;41:716–720. [PubMed] [Google Scholar]
- 43.Kuo LW, Chen JH, Wedeen VJ, et al. Optimization of diffusion spectrum imaging and q-ball imaging on clinical MRI system. NeuroImage. 2008;41: 7–18. [DOI] [PubMed] [Google Scholar]
- 44.G. K. Application Guide EP2D DSI Work-in-Progress Package for Diffusion Spectrum Imaging in Siemens. 2008.
- 45.Teipel SJ, Stahl R, Dietrich O, et al. Multivariate network analysis of fiber tract integrity in Alzheimer’s disease. NeuroImage. 2007;34:985–995. [DOI] [PubMed] [Google Scholar]
- 46.Jones DK, Cercignani M. Twenty-five pitfalls in the analysis of diffusion MRI data. NMR Biomed. 2010;23:803–820. [DOI] [PubMed] [Google Scholar]
- 47.Kaplan PE. Encyclopedia of Clinical Neuropsychology. Springer; 2011. pp. 1074. [Google Scholar]
- 48.Wheeler-Kingshott CA, Cercignani M. About ‘‘axial’’ and ‘‘radial’’ diffusivities. Magn Reson Med. 2009;61:1255–1260. [DOI] [PubMed] [Google Scholar]
- 49.DK. J Challenges and limitations of quantifying brain connectivity in vivo with diffusion MRI. Imaging Med 2010; 2:341–355. [Google Scholar]
- 50.Jeurissen B, Leemans A, Tournier JD, et al. Investigating the prevalence of complex fiber configurations in white matter tissue with diffusion magnetic resonance imaging. Hum Brain Mapp. 2013;34:2747–2766. [DOI] [PMC free article] [PubMed] [Google Scholar]
- 51.Behrens TE, Berg HJ, Jbabdi S, et al. Probabilistic diffusion tractography with multiple fibre orientations: what can we gain? NeuroImage. 2007;34: 144–155. [DOI] [PMC free article] [PubMed] [Google Scholar]
- 52.Mandl RC, Schnack HG, Zwiers MP, et al. Functional diffusion tensor imaging at 3 Tesla. Front Hum Neurosci. 2013;7:817. [DOI] [PMC free article] [PubMed] [Google Scholar]
- 53.Wilde EA, Ramos MA, Yallampalli R, et al. Diffusion tensor imaging of the cingulum bundle in children after traumatic brain injury. Develop Neuropsychol. 2010;35:333–351. [DOI] [PMC free article] [PubMed] [Google Scholar]
- 54.Arfanakis K, Haughton VM, Carew JD, et al. Diffusion tensor MR imaging in diffuse axonal injury. AJNR Am J Neuroradiol. 2002;23:794–802. [PMC free article] [PubMed] [Google Scholar]
- 55.Kumar R, Gupta RK, Husain M, et al. Comparative evaluation of corpus callosum DTI metrics in acute mild and moderate traumatic brain injury: its correlation with neuropsychometric tests. Brain Injury. 2009;23:675–685. [DOI] [PubMed] [Google Scholar]
- 56.Newcombe VF, Williams GB, Nortje J, et al. Concordant biology underlies discordant imaging findings: diffusivity behaves differently in grey and white matter post acute neurotrauma. Acta Neurochir Suppl. 2008;102:247–251. [DOI] [PubMed] [Google Scholar]
- 57.Miles L, Grossman RI, Johnson G, et al. Short-term DTI predictors of cognitive dysfunction in mild traumatic brain injury. Brain Injury. 2008;22:115–122. [DOI] [PubMed] [Google Scholar]
- 58.Newcombe VF, Williams GB, Nortje J, et al. Analysis of acute traumatic axonal injury using diffusion tensor imaging. Br J Neurosurg. 2007;21: 340–348. [DOI] [PubMed] [Google Scholar]
- 59.Wozniak JR, Lim KO. Advances in white matter imaging: a review of in vivo magnetic resonance methodologies and their applicability to the study of development and aging. Neurosci Biobehav Rev. 2006;30:762–774. [DOI] [PMC free article] [PubMed] [Google Scholar]
- 60.Wozniak JR, Krach L, Ward E, et al. Neurocognitive and neuroimaging correlates of pediatric traumatic brain injury: a diffusion tensor imaging (DTI) study. Arch Clin Neuropsychol. 2007;22:555–568. [DOI] [PMC free article] [PubMed] [Google Scholar]
- 61.Aoki Y, Inokuchi R, Gunshin M, et al. Diffusion tensor imaging studies of mild traumatic brain injury: a meta-analysis. J Neurol Neurosurg Psychiatry. 2012;83:870–876. [DOI] [PMC free article] [PubMed] [Google Scholar]
- 62.Brandstack N, Kurki T, Tenovuo O. Quantitative diffusion-tensor tractography of long association tracts in patients with traumatic brain injury without associated findings at routine MR imaging. Radiology. 2013;267:231–239. [DOI] [PubMed] [Google Scholar]
- 63.Davenport ND, Lim KO, Armstrong MT, Sponheim SR. Diffuse and spatially variable white matter disruptions are associated with blast-related mild traumatic brain injury. NeuroImage. 2012;59:2017–2024. [DOI] [PubMed] [Google Scholar]
- 64.Mayer AR, Ling JM, Yang Z, et al. Diffusion abnormalities in pediatric mild traumatic brain injury. J Neurosci. 2012;32:17961–17969. [DOI] [PMC free article] [PubMed] [Google Scholar]
- 65.Ling JM, Pena A, Yeo RA, et al. Biomarkers of increased diffusion anisotropy in semi-acute mild traumatic brain injury: a longitudinal perspective. Brain. 2012;135(Pt 4):1281–1292. [DOI] [PMC free article] [PubMed] [Google Scholar]
- 66.Wilde EA, McCauley SR, Hunter JV, et al. Diffusion tensor imaging of acute mild traumatic brain injury in adolescents. Neurology. 2008;70:948–955. [DOI] [PubMed] [Google Scholar]
- 67.Chu Z, Wilde EA, Hunter JV, et al. Voxel-based analysis of diffusion tensor imaging in mild traumatic brain injury in adolescents. AJNR Am J Neuroradiol. 2010;31:340–346. [DOI] [PMC free article] [PubMed] [Google Scholar]
- 68.Mayer AR, Ling J, Mannell MV, et al. A prospective diffusion tensor imaging study in mild traumatic brain injury. Neurology. 2010;74:643–650. [DOI] [PMC free article] [PubMed] [Google Scholar]
- 69.Mac Donald CL, Johnson AM, Cooper D, et al. Detection of blast-related traumatic brain injury in U.S. military personnel. N Engl J Med. 2011;364:2091–2100. [DOI] [PMC free article] [PubMed] [Google Scholar]
- 70.Hart J Jr, Kraut MA, Womack KB, et al. Neuroimaging of cognitive dysfunction and depression in aging retired National Football League players: a cross-sectional study. JAMA Neurol. 2013;70:326–335. [DOI] [PMC free article] [PubMed] [Google Scholar]
- 71.Hulkower MB, Poliak DB, Rosenbaum SB, et al. A decade of DTI in traumatic brain injury: 10 years and 100 articles later. AJNR Am J Neuroradiol. 2013;34:2064–2074. [DOI] [PMC free article] [PubMed] [Google Scholar]
- 72.Shenton ME, Hamoda HM, Schneiderman JS, et al. A review of magnetic resonance imaging and diffusion tensor imaging findings in mild traumatic brain injury. Brain Imag Behav. 2012;6:137–192. [DOI] [PMC free article] [PubMed] [Google Scholar]
- 73.Niogi SN, Mukherjee P. Diffusion tensor imaging of mild traumatic brain injury. J Head Trauma Rehab. 2010;25:241–255. [DOI] [PubMed] [Google Scholar]
- 74.Saatman KE, Duhaime AC, Bullock R, et al. Classification of traumatic brain injury for targeted therapies. J Neurotrauma. 2008;25:719–738. [DOI] [PMC free article] [PubMed] [Google Scholar]
- 75.Mourao-Miranda J, Bokde AL, Born C, et al. Classifying brain states and determining the discriminating activation patterns: Support Vector Machine on functional MRI data. NeuroImage. 2005;28:980–995. [DOI] [PubMed] [Google Scholar]
- 76.De Martino F, Valente G, Staeren N, et al. Combining multivariate voxel selection and support vector machines for mapping and classification of fMRI spatial patterns. NeuroImage. 2008;43:44–58. [DOI] [PubMed] [Google Scholar]
- 77.Friston KJ. Modalities, modes, and models in functional neuroimaging. Science. 2009;326:399–403. [DOI] [PubMed] [Google Scholar]
- 78.Burges JC. A tutorial on support vector machines for pattern recognition. Data Mining and Knowledge Discovery. 1998;2:121–167. [Google Scholar]
- 79.Hellyer PJ, Leech R, Ham TE, et al. Individual prediction of white matter injury following traumatic brain injury. Ann Neurol. 2013;73:489–499. [DOI] [PubMed] [Google Scholar]
- 80.Lui YW, Xue Y, Kenul D, et al. Classification algorithms using multiple MRI features in mild traumatic brain injury. Neurology. 2014;83: 1235–1240. [DOI] [PMC free article] [PubMed] [Google Scholar]
- 81.Haufe S, Meinecke F, Gorgen K, et al. On the interpretation of weight vectors of linear models in multivariate neuroimaging. NeuroImage. 2014;87:96–110. [DOI] [PubMed] [Google Scholar]
- 82.Douglas PK, Harris S, Yuille A, et al. Performance comparison of machine learning algorithms and number of independent components used in fMRI decoding of belief vs. disbelief. NeuroImage. 2011;56:544–553. [DOI] [PMC free article] [PubMed] [Google Scholar]
- 83.Douglas PK, Lau E, Anderson A, et al. Single trial decoding of belief decision making from EEG and fMRI data using independent components features. Front Hum Neurosci. 2013;7:392. [DOI] [PMC free article] [PubMed] [Google Scholar]
- 84.Anderson A, Douglas PK, Kerr WT, et al. Non-negative matrix factorization of multimodal MRI, fMRI and phenotypic data reveals differential changes in default mode subnetworks in ADHD. NeuroImage. 2014;102(Pt 1):207–219. [DOI] [PMC free article] [PubMed] [Google Scholar]
- 85.Ho L, Zhao W, Dams-O’Connor K, et al. Elevated plasma MCP-1 concentration following traumatic brain injury as a potential ‘‘predisposition’’ factor associated with an increased risk for subsequent development of Alzheimer’s disease. J Alzheimer’s Dis. 2012;31:301–313. [DOI] [PMC free article] [PubMed] [Google Scholar]
- 86.Stephan KE, Tittgemeyer M, Knosche TR, et al. Tractography-based priors for dynamic causal models. NeuroImage. 2009;47:1628–1638. [DOI] [PMC free article] [PubMed] [Google Scholar]


