

Summary
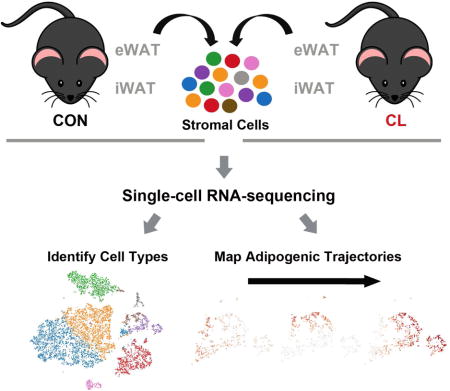
Recruitment of brown/beige adipocytes (BA) in white adipose tissue (WAT) involves proliferation and differentiation of adipocyte stem cells (ASC) in concert with close interactions with resident immune cells. To deconvolve stromal cell heterogeneity in a comprehensive and unbiased fashion, we performed single-cell RNA sequencing (scRNA-seq) of > 33,000 stromal/vascular cells from epididymal WAT (eWAT) and inguinal WAT (iWAT) under control conditions and during β3-adrenergic receptor (ADRB3) activation. scRNA-seq identified distinct ASC subpopulations in eWAT and iWAT that appeared to be differentially poised to enter the adipogenic pathway. ADRB3 activation triggered the dramatic appearance of proliferating ASC in eWAT, whose differentiation into BA could be inferred from a single time point. scRNA-seq identified various immune cell types in eWAT, including a proliferating macrophage subpopulation that occupies adipogenic niches. These results demonstrate the power of scRNA-seq to deconstruct adipogenic niches and suggest novel functional interactions among resident stromal cell subpopulations.
eTOC
Burl et al. employ single-cell RNA sequencing (scRNA-seq) of mouse adipose tissue to identify distinct subpopulations of adipocyte progenitors and immune cells. In a model of in vivo brown adipogenesis, scRNA-seq data are used to deconstruct adipogenic niches, map differentiation trajectories, and suggest novel functional interactions among resident stromal cell subpopulations.
Introduction
Sustained activation of β3-adrenergic receptors (ADRB3) induces the appearance of brown/beige adipocytes (BA) in various adipose tissue depots via de novo adipogenesis from proliferating cells and interconversion of existing white adipocytes to a BA phenotype (Barbatelli et al., 2010; Cinti, 2009; Lee et al., 2016; Lee et al., 2013; Lee et al., 2015; Lee et al., 2012; Lee et al., 2014; Rosenwald et al., 2013; Wang et al., 2013). We previously reported that this catabolic remodeling of epididymal white adipose tissue (eWAT) involves death and removal of white adipocytes by macrophages, and the recruitment and differentiation of adipocyte progenitors at the site of efferocytosis (Lee et al., 2013; Lee et al., 2012; Lee et al., 2014). Furthermore, genetic tracing, fluorescence activated cell sorting (FACS), and immunohistochemical analyses demonstrated that adipocyte stem cells (ASC) expressing the surface marker platelet-derived growth factor receptor alpha (PDGFRA) migrate to the site of efferocytosis, proliferate, and rapidly differentiate into new brown adipocytes (BA). In contrast, ADRB3 activation induces little cell proliferation or de novo adipogenesis from PDGFRA cells in inguinal WAT (iWAT), and most BA cells appear to be derived from existing white adipocytes (Himms-Hagen et al., 2000; Lee et al., 2015; Rosenwald et al., 2013) or an uncharacterized nonproliferating stromal pool (Vishvanath et al., 2016; Wang et al., 2013).
ADRB3 activation by CL 316,243 (CL) provides a powerful model of de novo adipogenesis in eWAT, since it occurs rapidly (3-4 days) in a defined tissue niche (i.e., a “crown-like structure”) and involves close interactions among various cell types, including macrophages and adipocyte progenitors (Lee et al., 2013; Lee et al., 2012; Lee et al., 2014). Nonetheless, previous investigations using genetic tracing and flow cytometry were limited in the ability assess stromal cell heterogeneity and address differentiation trajectories, since these approaches require the selection of limited gene products to tag and trace cells. While such methods can definitively identify the cell types that can contribute to tissue plasticity, the analysis is limited to markers employed, and is thus biased and not comprehensive. Recently, technologies have been developed that allow single-cell mRNA sequencing (scRNA-seq) of thousands of cells, and thereby provide information that is largely unbiased and far more comprehensive than approaches based on bulk analysis. Importantly, when combined with previous cell sorting and histochemical analyses (Lee et al., 2016; Lee et al., 2013; Lee et al., 2012; Lee et al., 2014), scRNA-seq can identify critical cell subpopulations and states, and infer differentiation trajectories.
In the experiments detailed below, we performed comprehensive and unbiased scRNA-seq of adipose tissue stromal cells (including immune cells) using the ADRB3 model of tissue remodeling of both eWAT and iWAT. Our results identified distinct subpopulations of stromal cells that express common ASC markers that appear to be differentially poised to become adipocytes. Furthermore, scRNA-seq clearly identified the adipocyte progenitor population undergoing proliferation and early differentiation. Analysis of tissue immune cells by scRNA-seq identified natural killer T lymphocytes, as well as distinct populations of macrophages/dendritic cells, including those that occupy the adipogenic niche. The resource data comprise single-cell expression profiles of > 33,000 adipose stromal cells that offer new insights into cellular complexity and mechanisms of tissue plasticity.
Results and Discussion
RNA-Seq analysis of FACS-isolated progenitors suggests a complex adipogenic trajectory
CL treatment induces proliferation of ASC that differentiate into BA in eWAT, and previous work suggested that the expression of the surface marker CD44 could be used to identify ASC undergoing adipocyte differentiation (Lee et al., 2016; Lee et al., 2013; Lee et al., 2014). To gain greater insights into the activation process, we analyzed the gene expression pattern of PDGFRA+ cells from control (CON) and CL-treated mice that were positive or negative for CD44 (Figure S1 and Table S1A–E). In controls, 4.2% of PDGFRA+ cells expressed CD44 (PDGFRA+CD44+), and these cells exhibited upregulated expression of cell cycle genes (Prc1, Cdca8, Plk1; fold change (FC) > 3.7, adjusted p <0.00002), as well as genes involved in early adipocyte differentiation (Cebpa, FC = 2.5, adjusted p < 0.000005) compared to PDGFRA+CD44− cells (Table S1D). CL increased the percentage of PDGFRA+CD44+ cells by about 4-fold (t-test, p < 0.01, n = 4 independent experiments) (Figure S1A), and further upregulated genes associated with cell migration, mitotic cytokinesis, extracellular matrix remodeling, and adipocyte differentiation compared to untreated quiescent PDGFRA+CD44−cells (Table S1E). These results confirm that CD44 expression enriches for newly-recruited ASC; however, the gene expression pattern suggested that the PDGFRA+CD44+ subpopulation contained a complex mixture of cells undergoing migration, proliferation, and differentiation. Furthermore, it was clear that bulk sequencing of FACS-isolated subpopulations was unlikely to further deconvolve this interesting heterogeneity.
scRNA-seq deconvolves progenitor heterogeneity and defines an adipogenic trajectory
In order to address stromal cell complexity and begin to unravel adipogenic trajectories in vivo, we performed scRNA-seq analysis of stromal cells isolated from eWAT of sham controls and mice infused with CL for 3 days, a time of maximal proliferation and early differentiation (Lee et al., 2013; Lee et al., 2014). Stromal cells were isolated and fractionated into lineage marker positive (Lin+) cells (mostly immune cells) and all other stromal cells (Lin−) using magnetic bead cell sorting (MACS). As detailed in the STAR Methods, separate single-cell libraries (an estimated 6,000 cells loaded per library) were prepared from control and CL-treated mice for each cell fraction (Lin+ or Lin−) and sequenced. We adopted this cell fractionation and sequencing strategy to demonstrate that single-cell profiles corresponded to the expected profiles of physically isolated cells and to gain greater depth of coverage for detecting rare cell types. Thus, 100% of single cells expressing Adgre1 (the gene encoding the macrophage antigen F4/80) were found in the eWAT Lin+ fraction, whereas more than 96% of cells expressing the ASC marker Pdgfra were found in the Lin− fraction.
Our general analytic approach was to aggregate single-cell expression of profiles of Lin+ and Lin− cells separately across experimental conditions and visualize the relationships using t-distributed stochastic neighbor embedding (t-SNE) plots. Aggregated and normalized data were subjected to K-means or graph-based clustering to identify cell types/states, which were projected onto the t-SNE plots using the 10X Genomics software package (see STAR Methods). K-means clustering of scRNA-seq data from eWAT Lin− cells from control and CL-treated mice identified eight major clusters varying from ~200 to 3200 cells per cluster (Figure 1A). A list of differentially-expressed genes (DEGs) that define the clusters are presented in Table S2A. Analysis of DEGs identified four major clusters of ASC (i.e., expressing Pdgfra and Ly6a or early adipocyte makers; clusters ASC 1, ASC 2, Diff. ASC, Pro. ASC), fibroblasts (FB), a population of vascular endothelial cells (VEC) and small populations (each < 3% of total) of natural killer T cells (NKT) and macrophages (MAC) that likely escaped capture by the Lin+ MACS beads. Two major clusters of ASC (ASC 1 and ASC 2; representing 32% and 27%, respectively) could be distinguished by overexpression of genes corresponding to regeneration (GO:0031099, p = 4.26E-5), positive regulation of secretion by cell (GO:1903532, p = 2.06E-2) and positive regulation by migration (GO:0030335, p = 3.63E-4) in cluster ASC 1, and extracellular exosome (GO:0070062, p = 3.52E-4) in cluster ASC 2.
Figure 1. Single-cell RNA-sequencing reveals adipocyte stem cell heterogeneity in mouse eWAT.
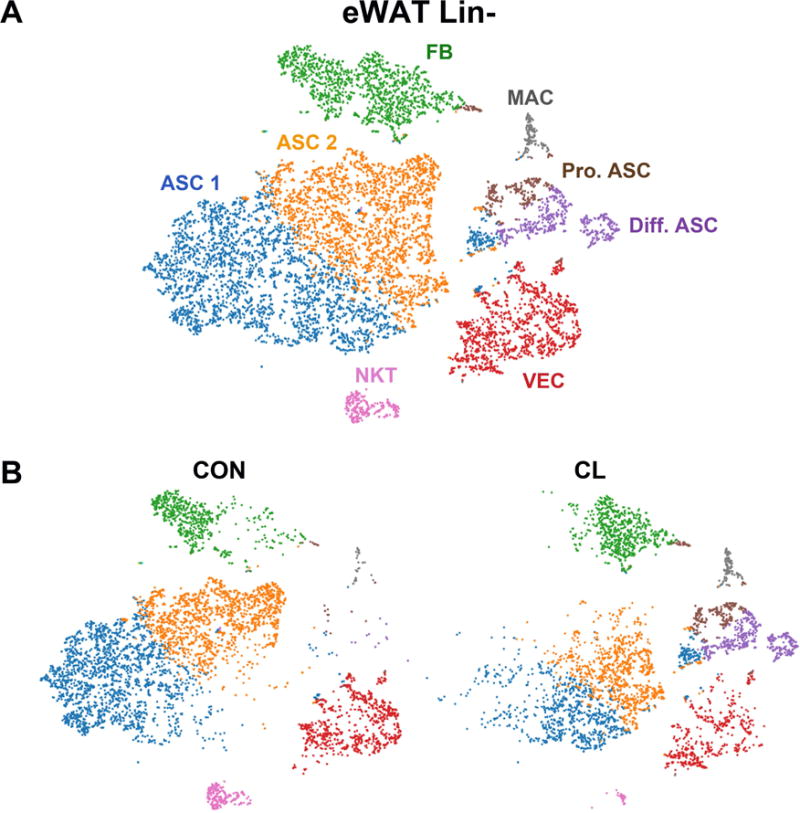
(A) t-SNE plot of 9,915 lineage negative (Lin−) stromal vascular cells from eWAT of control mice and mice treated with CL for 3 days. K-means clustering applied to the t-SNE plot identified eight major cell types/states (the table of significant DEGs used to define these clusters is presented in Table S2A). Clusters are highlighted in different colors. ASC, adipocyte stem cells; MAC, macrophages; VEC, vascular endothelial cells; NKT, natural killer T cells; FB, fibroblasts; Pro. ASC, proliferating adipocyte stem cells; Diff. ASC, differentiating adipocyte stem cells. Cell counts by cluster: ASC 1 = 3,185 (32%), ASC 2 = 2,654 (27%), FB 3 = 1,443 (15%), VEC 4 = 1,320 (13%), Diff. ASC 5 = 530 (5%), Pro. ASC 6 = 324 (3%), NKT 7 = 274 (3%), MAC 8 = 183 (2%). (B) t-SNE plot of K-means clusters from (A) split into the cells from control (CON) and CL-treated mice (CL).
Segregation of the aggregated t-SNE plot according to treatment condition (Figure 1B) demonstrated that CL treatment shifted the expression profiles of the major ASC subtypes (ASC 1 and ASC 2) and induced the appearance of two new clusters (Diff. ASC and Pro. ASC). Within cluster ASC 1, CL treatment altered expression of genes related to proteinaceous extracellular matrix (GO:0005578, p = 6.6E-7), whereas in ASC 2, CL treatment strongly upregulated genes (> 2-fold, p <1E-4) involved in cell motility (GO:2000145, p = 5E-5), migration (GO:0030334, 7.5E-5), and epithelial cell proliferation (GO:0050678, p = 7.7E-5). As mentioned, ASC 1 and ASC 2 had an overall profile that likely represents different states of a similar cell type (i.e., ASC). In this regard, it is interesting to note that nearly all (20/24) of the genes that were significantly upregulated by CL in cluster ASC 1 were also upregulated in cluster ASC 2 (Table S2B).
The cells in cluster Pro. ASC exhibited very strong induction (>60-fold) of genes that positively regulate cell cycle, leaving no doubt that the cells were actively proliferating, whereas cluster Diff. ASC was highly enriched in expression of genes involved in early adipogenesis, including CAAT enhancer binding protein alpha (Cebpa), carbonic anhydrase 3 (Car3), acylglycerol-3-phosphate O-acyltransferase 2 (Agpat2), diacylglycerol acyltransferase 2 (Dgat2), perilipin 1 (Plin1), and adiponectin (Adipoq) (Table S2A). Together, the clusters Diff. ASC and Pro. ASC contained ~10% of total putative ASC (the sum of clusters ASC 1, ASC 2, Diff. ASC and Pro. ASC) from CL-treated mice, and fewer than 0.6% of ASC from control mice.
CL treatment induces a burst of adipogenesis that peaks on the third day of treatment (Lee et al., 2012). Thus, following 3 days of CL treatment, we expected to observe ASC in different stages of adipogenesis within clusters Diff. ASC and Pro. ASC from which a differentiation trajectory might be mapped. Expression of the adipogenic master regulators Cebpa and peroxisome proliferator activated receptor gamma (Pparg) was upregulated in these clusters (circled in Figure 2A) and paralleled expression of adipocyte genes (expanded in Figure 2B). Within this overall pathway we observed cells that expressed Pdgfra and were actively dividing (Cdca8), yet had relatively low levels of Cebpa and virtually no expression of adipocyte differentiation markers Plin1 and adipogenin (Adig) (Figure 2B). Next, we identified actively dividing cells in which Pdgfra was suppressed, while Cebpa and Plin1 were upregulated, but levels of Adig remained relatively low. Lastly, we observed cells in which both Pdgfra and Cdca8 were silenced, and Cebpa, Plin1 and Adig were strongly upregulated. Importantly, the trajectory of proliferation and differentiation deduced from a single time point (3 days) is entirely consistent with that determined from extensive time course analyses with genetic tracers (Lee et al., 2013; Lee et al., 2012).
Figure 2. scRNA-seq of mouse eWAT maps an adipogenic differentiation trajectory during CL treatment.
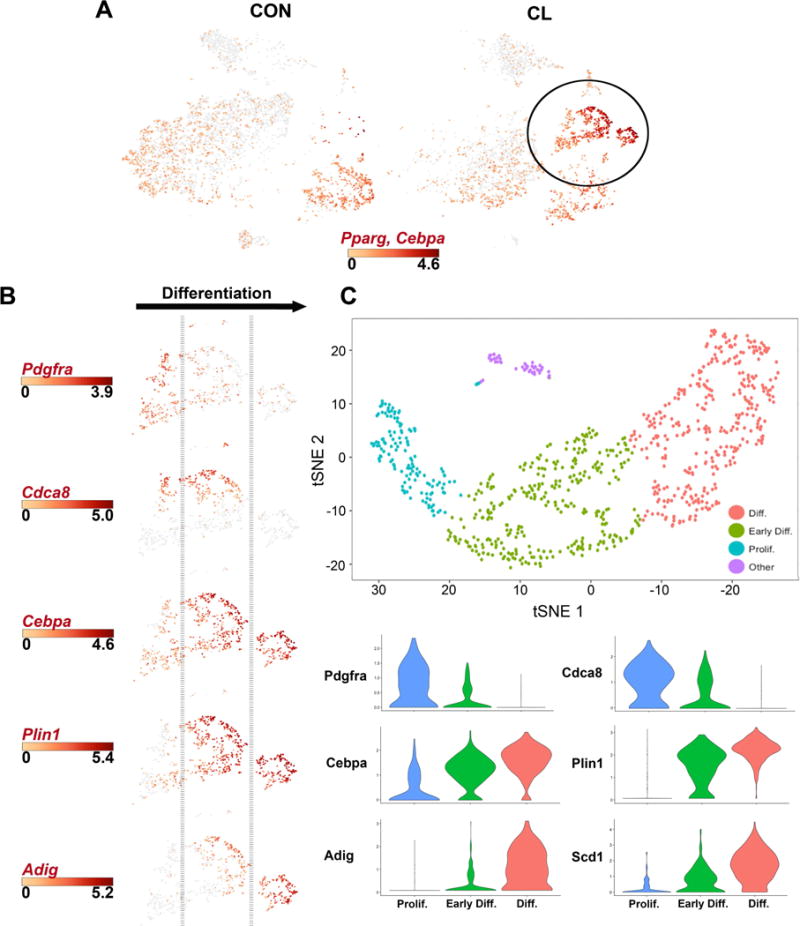
(A) Gene expression profiles of master regulators of adipogenesis, Pparg and Cebpa, in eWAT Lin− cells from CON and CL-treated mice. Scale bar represents the Log2 values of combined max gene expression. (B) Expression profiles of genes known to be involved in adipogenesis reveals a differentiation trajectory. Expression scale bars show Log2 values of max gene expression. (C) t-SNE plot and shared nearest neighbor clustering of Diff. ASC and Pro. ASC clusters from Figure 1A using the single-cell R toolkit Seurat. Independent clustering of these cells in Seurat ordered cells along a differentiation trajectory that could be defined by expression of genes in Figure 2B. Violin plots showing the mean and variance expression density in Prolif., Early Diff., and Diff. clusters for the following genes: Pdgfra, Cdca8, Cebpa, Plin1, Adig, and Scd1. Gene expression profiles corroborate the differentiating trajectory defined in Figure 2B. The complete list of DEGs that define these clusters is presented in Table S2C.
To investigate the putative adipogenic trajectory further, we performed shared nearest neighbor clustering of proliferating and differentiating cells (Diff. ASC + Pro. ASC from Figure 1A) using the single cell R tool kit Seurat (Satija et al., 2015). This analysis identified three major clusters that could be mapped to a differentiation trajectory of stem cell proliferation, early adipogenic differentiation, and late differentiation (Figure 2C and Table S2C). We used the first principal component (PC1) of these expression data as a surrogate for pseudotime to order cells along the differentiation trajectory (Figure S2A). Plotting the expression of representative adipogensis genes against pseudotime revealed a clear differentiation trajectory (Figure S2A). To expand this analysis, we correlated normalized gene expression of the single cells with the pseudotime trajectory and identified 241 genes that significantly covaried (r2 > 0.2, p < 10E-20) with the proposed differentiation trajectory (Figure S2B and Table S2D). Examples of genes that correlated positively with the adipogenic trajectory include adipogenic master regulators (Cepba, Pparg), and those involved in lipid synthesis (Fabp4, Acsl1, Lpin1), electron transport (Atp5b, Cox8a, Ndufab1) and signal transduction (Pkar2b, Mrap, Reep6). Genes that were suppressed during differentiation included proliferation genes (Mki67, Cenpf), certain ECM genes (Timp2, Col1a1, S100A6) and ASC markers (CD34, Dcn, Pdgfra).
Single-cell expression profiling supports the concept that ASC can exist in various metastable states that can be perturbed toward adipogenic or nonadipogenic fates (Lee et al., 2012; Marcelin et al., 2017; Sun et al., 2017). From this perspective, a single type of progenitor is unlikely to exist, as most cells have adipogenic potential that is realized by the proper set of local cues. Consistent with this notion, we identified a subpopulation of ASC within cluster ASC 1 having an expression profile that overlapped with cells adipogenic clusters (Diff. ASC and Pro. ASC). This population of stromal cells, which expanded following CL treatment, upregulated genes such as Cxcl12, Igf1, Adam12 and Sfrp1 that are involved in cell migration (Li et al., 2013; Sengenes et al., 2007), proliferation (Tseng et al., 2002), extracellular matrix (ECM) remodeling (Kawaguchi et al., 2002), and induction of adipogenesis (Lagathu et al., 2010; Lagathu et al., 2009), respectively (Figure S3A). An interesting feature of the total adipogenic trajectory is the pronounced upregulation of genes involved in migration and ECM remodeling and down regulation of certain ECM protease inhibitors. For example, CL treatment sharply downregulated expression of the protease inhibitors Pi16 and Timp3, which were not expressed in cells undergoing division and differentiation (Figure S3B). The reciprocal expression of extracellular activators and inhibitors (e.g., Igf1/Igfbp6 and Adam12/Timp3) suggest functional interactions in the adipogenic microenvironment. In this regard, it is known that induction of adipogenesis in cell culture models involves dramatic alterations in ECM proteins and cell shape, which are necessary and sometimes sufficient to drive the adipogenic program (Chun et al., 2006; Kawaguchi et al., 2002; Sato-Kusubata et al., 2011).
The expression of certain genes, including Pdgfra (Lee et al., 2012), Pdgfrb (Vishvanath et al., 2016), smooth muscle actin (Acta2) (Berry et al., 2016) and VE-cadherin (Cdh5) (Tran et al., 2012), has been used to tag and trace ASC differentiation in vivo. It was therefore of interest to compare the expression pattern of these genes with the adipogenic trajectories defined above. To include all of stromal cell types in eWAT, we aggregated Lin+ and Lin– cell fractions from control and CL-treated mice (17,640 cells), generated a t-SNE plot, and performed K-means clustering analysis (Figure 3 and Table S2E). As observed with the Lin-pool, cells expressing Pdgfra strongly contributed to adipogenic trajectories (e.g., Plin1, Dgat2, Adrb3, Ucp1). Furthermore, the t-SNE plot that includes all stromal cells clearly identified an adipogenic trajectory involving proliferation and differentiation (Figure S4). Pdgfrb was co-expressed with Pdgfra in ASC, as well as in a population of VEC (Figure 3). Cdh5 and Acta2 were heavily expressed in VEC and VSMC, respectively, as expected. However, unlike Pdgfra, the transcription profiles of cells expressing Cdh5 or Acta2 were largely, if not completely, unrelated to cells undergoing CL-induced adipogenesis. These data do not exclude adipogenic recruitment from other cell types under different conditions (e.g., development), and suggest that single-cell approaches might be useful in defining the range of cell types that contribute to tissue plasticity under various conditions.
Figure 3. scRNA-seq analysis of aggregated eWAT Lin+ and Lin− cells from control and CL-treated mice.
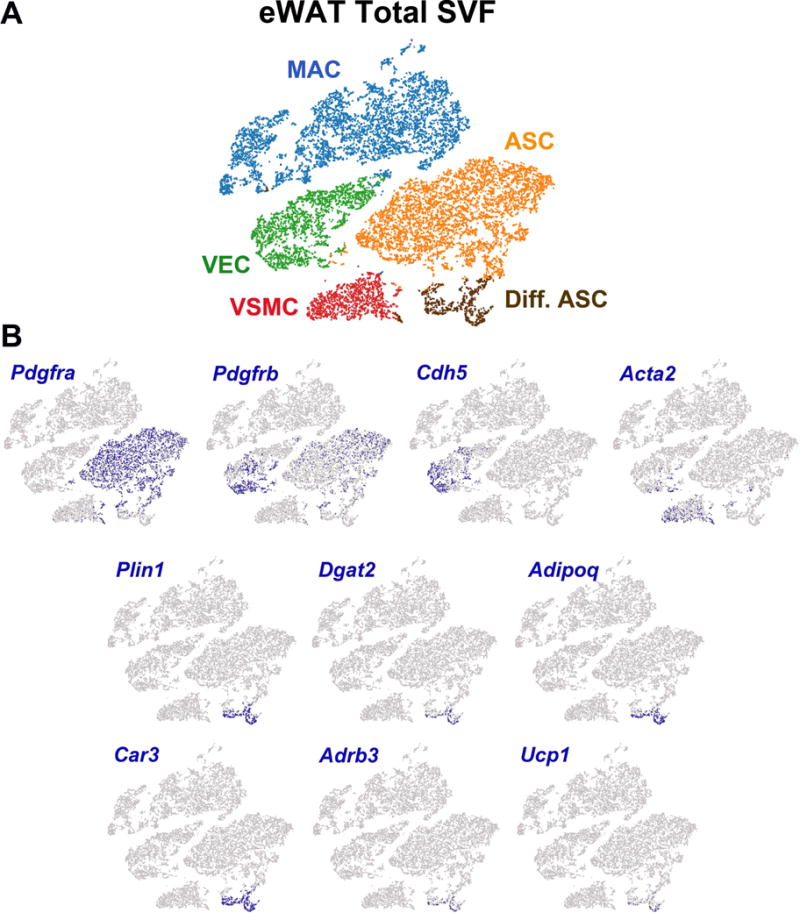
t-SNE plots represent the total population of stromal vascular cells from eWAT. (A) 17,640 cells from Lin+ and Lin− libraries of CON and CL-treated mice were clustered by K-means (five clusters) and projected onto a t-SNE plot to define general cell types. MAC, macrophages; VEC, vascular endothelial cells; VSMC, vascular smooth muscle cells; ASC, adipocyte stem cells; Diff. ASC, differentiating adipocyte stem cells. Cell types were identified by the DEGs in each cluster (Table S2E). Cell counts by cluster: MAC = 6,600 (37%), VEC = 2,675 (15%), VSMC = 1,489 (8%), ASC = 6,011 (34%), Dif. ASC = 865 (5%). (B) The data set was queried for cells expressing selected ASC marker genes, as well as cells expressing early and late markers of adipocytes. Highlighted cells express the given gene above the following thresholds: Pdgfra > 1; Pdgfrb > 1; Cdh5 > 3; Acta2 > 2; Plin1 > 3; Dgat2 > 3; Adipoq > 4; Car3 >7; Adrb3 > 2; Ucp1 > 1. Expression values are Log2 values of max gene expression.
Overall, data from bulk RNA-sequencing of FACS-sorted PDFGRA+ cells were highly consistent with data culled from single PDGFRA+ cells (Figure S5 and Tables S1 and S2A). Thus, CL treatment sharply upregulated ECM proteases, downregulated protease inhibitors, and induced early adipogenic genes. Furthermore, the top upregulated DEGs in the PDGFRA+CD44+ bulk RNA-seq were enriched in the adipogenic clusters defined by scRNA-seq (Figure S5A and Table S1 and S2A), providing cross validation of the single-cell approach. Importantly, scRNA-seq provided far higher resolution of the adipogenic trajectory. For example, scRNA-seq detected 19 cell proliferation genes whose expression was enriched an average of 27-fold in cluster Pro. ASC (Table S2A). In contrast, fewer than half of these genes were found to be significantly upregulated in FACS-isolated PDGFRA+CD44+, with an average increase of less than 5-fold (Tables S1 and S2A). Similarly, scRNA-seq identified numerous adipogenesis-related genes (e.g., Adig, Lipe, Agpat2, Dgat1 and Dgat2) that were not detected as being differentially expressed in bulk RNA-seq. The inability to detect late differentiation markers in the FACS-based approach may reflect the fact that PDGFRA expression is lost as ASC differentiate (Lee et al., 2012). Thus, since scRNA-seq is unbiased with respect to surface marker expression, it allows detection of the full range of ASC activation and differentiation. For example, scRNA-seq allowed the clear demonstration that ASC can upregulate the adipocyte gene program while proliferating and that proliferation and differentiation are not mutually exclusive (Cinti et al., 1985; Hong et al., 2015; Lee et al., 2012). In general, although bulk RNA-seq identified more genes (i.e., greater depth), it was far less sensitive to differential expression in critical subpopulations and incapable of mapping differentiation trajectories.
scRNA-seq analysis demonstrates dynamic regulation of macrophage populations and suggests functional interactions with activated progenitors
As mentioned above, ADRB3-induced de novo adipogenesis requires the clearance of dead white adipocytes by tissue macrophages, which recruit ASC to the site of efferocytosis and guide their proliferation and differentiation into new BA (Lee et al., 2013). To gain further insights into the immune cells involved, we performed scRNA-seq of Lin+ cells isolated from eWAT of control and CL-treated mice. scRNA-seq identified prominent clusters of macrophages/dendritic cells (MAC 1/DEND and MAC 2), natural killer T cells (NKT), vascular endothelial cells (VEC), vascular smooth muscle cells (VSMC), and a small population (< 3%) of reticulocytes (Figure 4A and Table S2F). K-means clustering also identified small clusters of proliferating (Prolif.) cells that were closely associated with clusters of NKT cells and macrophage/dendritic cells. As expected, CL increased the number of macrophages in clusters MAC 1/DEND and MAC 2 by 1.9- and 2.7-fold, respectively (chi square, p < 0.00001) (Figure 4B). CL treatment significantly reduced the number of NKT cells (chi square, p <0.00001), without significantly shifting their transcriptional profile (Figure 4B and Table S2F).
Figure 4. scRNA-seq analysis of lineage+ eWAT stromal cells of control and CL-treated mice.
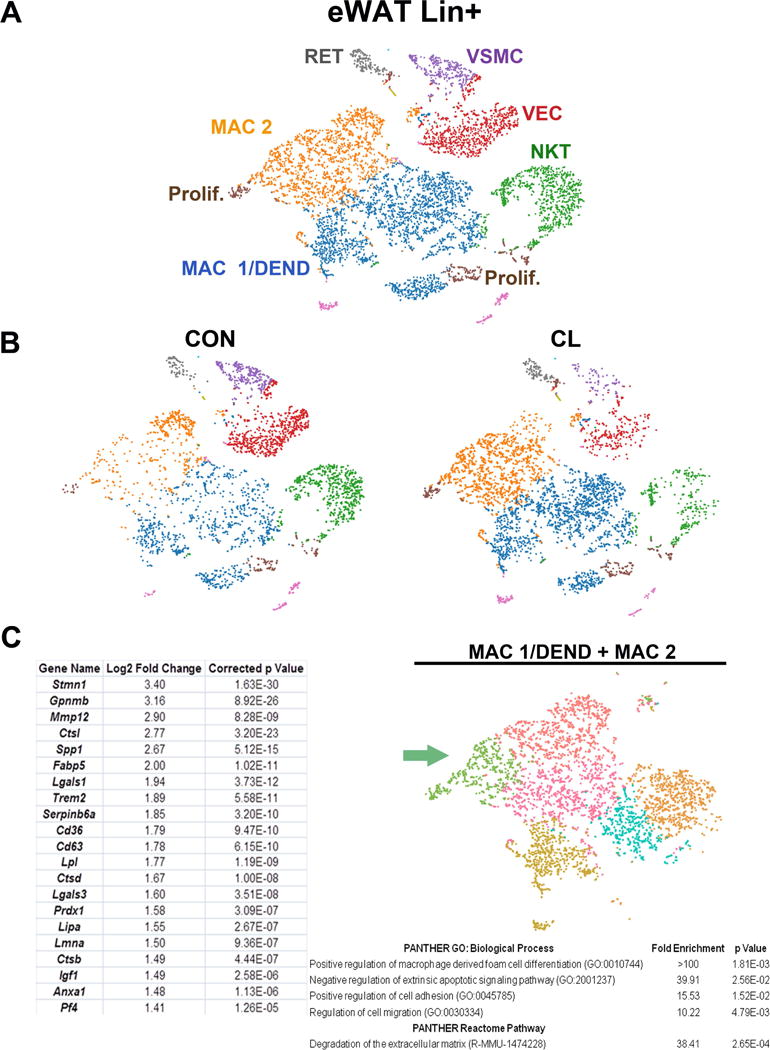
(A) t-SNE plot of 7,725 lineage positive (Lin+) cells isolated from eWAT of control and CL-treated mice. K-means clustering applied to the t-SNE identified eight major cell types/states: RET, reticulocytes; VSMC, vascular smooth muscle cells; VEC, vascular endothelial cells; NKT, natural killer T cells; MAC, macrophages; DEND, dendritic cells; Prolif., cells undergoing active proliferation. Cell types/states were determined by DEGs within each cluster, the complete list of which is presented in Table S2F. Cell counts by cluster: MAC 1/DEND = 2,725 (35%), MAC 2 = 1,781 (23%), NKT = 1,018 (13%), VEC = 976 (13%), VSMC = 384 (5%), Prolif. = 376 (5%), RET = 200 (3%). (B) t-SNE plot of K-means clusters segregated by treatment (CON or CL). CL treatment increased the relative abundance of macrophages. (C) An alternative method of clustering, Graph-based clustering, was applied to the t-SNE plot of Lin+ cells and identified 6 macrophage clusters. Gene expression comparisons were made among the clusters. Shown are DEGs and corresponding gene ontologies (GO) of the subcluster of macrophages in green that were associated with proliferation.
Previous analysis of whole tissue mRNA indicated that ADRB3 stimulation increases expression of M2 markers such as Chil3, Clec10a, and Arg1 (Lee et al., 2017; Lee et al., 2013). Surprisingly, scRNA-seq indicated that these markers often segregate into different subpopulations, suggesting a spectrum of activation states (Figure S6) that defy simple classification into M2 or M1 phenotypes (Xue et al., 2014). Published histological analysis of ADRB3-induced remodeling demonstrated that ASC are recruited to the site of macrophage-mediated efferocytosis (Lee et al., 2013). Furthermore, the macrophages involved in clearing dead fat cells resemble foam cells (Amano et al., 2014; Aouadi et al., 2014), proliferate within the ‘crown-like structure’, express high levels of osteopontin (Spp1; a chemoattractant for ASC), and likely upregulate genes involved lipid uptake and metabolism (Grijalva et al., 2016; Lee et al., 2016; Lee et al., 2013; Lee et al., 2012). Graph-based clustering of the macrophage populations MAC 1/DEND and MAC 2 identified a subpopulation (Figure 4C, green) that likely resides in the adipogenic niche. Consistent with previous histological and FACS analyses (Lee et al., 2016; Lee et al., 2013; Lee et al., 2012; Lee et al., 2014), expression of Spp1 was greatly enriched in this green cluster (table, Figure 4C), and this cluster also contains cells identified in panel A as proliferating, indicating that local proliferation contributes to this population. Compared to other macrophage subpopulations, these cells upregulated expression of genes involved in lipid uptake and metabolism (Cd36, Fabp5, Lpl, Lipa), and ECM remodeling and proteolysis (Mmp12, Ctsl, Ctsd) that might be involved in the removal of dead fat cells, and in providing arriving ASC with growth factors (e.g., IGF1 (Chang et al., 2016) and lipid-derived signaling molecules (Lee et al., 2016) (Figure 4C). Consistently, the genes that were overexpressed in this subpopulation are significantly associated with the biological processes of migration, adhesion, and macrophage foam cell differentiation (Figure 4C). Overall, scRNA expression profiles provide new insights into the adipogenic niche, and suggests that synergistic and highly localized remodeling of ECM drives cell migration, proliferation, and generation of protein and lipid mediators that guide ASC differentiation.
ADRB3 activation for three days produces minimal de novo adipogenesis from stromal cells in inguinal WAT
ADRB3 activation also induces the appearance of BA in subcutaneous inguinal WAT (iWAT). Genetic tracing experiments performed in our lab indicate that few, if any, of these cells are derived from cell proliferation or from cells expressing PDGFRA. Furthermore, results from our lab and others (Cinti, 2009; Himms-Hagen et al., 2000; Lee et al., 2015; Rosenwald et al., 2013) indicate that a substantial number of BA in iWAT can be derived from existing fat cells that appear white under basal conditions, yet can adopt a brown phenotype following ADRB3 stimulation.
scRNA-seq analysis of Lin− cells from iWAT from control and CL-treated mice identified two major clusters of ASC (i.e., cells expressing Pdgfra and Ly6a/Sca1) (Figure 5A and Table S3) that could be readily distinguished by DEGs involved in ECM production and proteolysis (Figure 5B). Interestingly, these clusters also differentially expressed the adipogenesis markers caveolin-1 (Cav1) and G0/G1 switch 2 (G0s2) (Scherer et al., 1994; Zandbergen et al., 2005) (Figure 5B), suggesting that ASC 1 is more poised for adipogenic differentiation. Compared to eWAT, CL treatment upregulated relatively few genes in either ASC 1 or 2, consistent with negligible recruitment from ASC. However, K-means clustering identified a small population of proliferating cells (labeled Prolif. and circled in Figure 5A and Table S3) whose numbers were significantly increased by CL treatment (52 vs 8; chi square, p <0.0001). Examination of gene expression profiles in this region identified cells from CL-treated mice with overlapping expression of markers of proliferation (Birc5) and early adipogenesis (Car3) (circled in Figure 5C), indicating an adipogenic trajectory involving proliferation and upregulation of Cebpa, Plin1, and Adipoq (Figure 5D). These cells also exhibited upregulation of Pparg, fatty acid binding protein 4 (Fabp4), Fabp5 and G0s2, which were also strongly induced in differentiating ASC in eWAT. Overall, proliferating/differentiating ASC in iWAT represented about 0.4% and 1.5% of total ASC from control and CL-treated mice, respectively. Interestingly, the overall pattern of gene expression in these proliferating/differentiating cells was most similar to cluster ASC 1 and distinct from those in cluster ASC 2, consistent with the concept that distinct populations of ASC are differentially poised to enter the adipogenic pathway. These data demonstrate the power of scRNA to identify very small numbers of proliferating/differentiating cells that might be missed in bulk RNA profiling and histological analysis.
Figure 5. scRNA-seq of ASC from iWAT of control and CL treated mice.
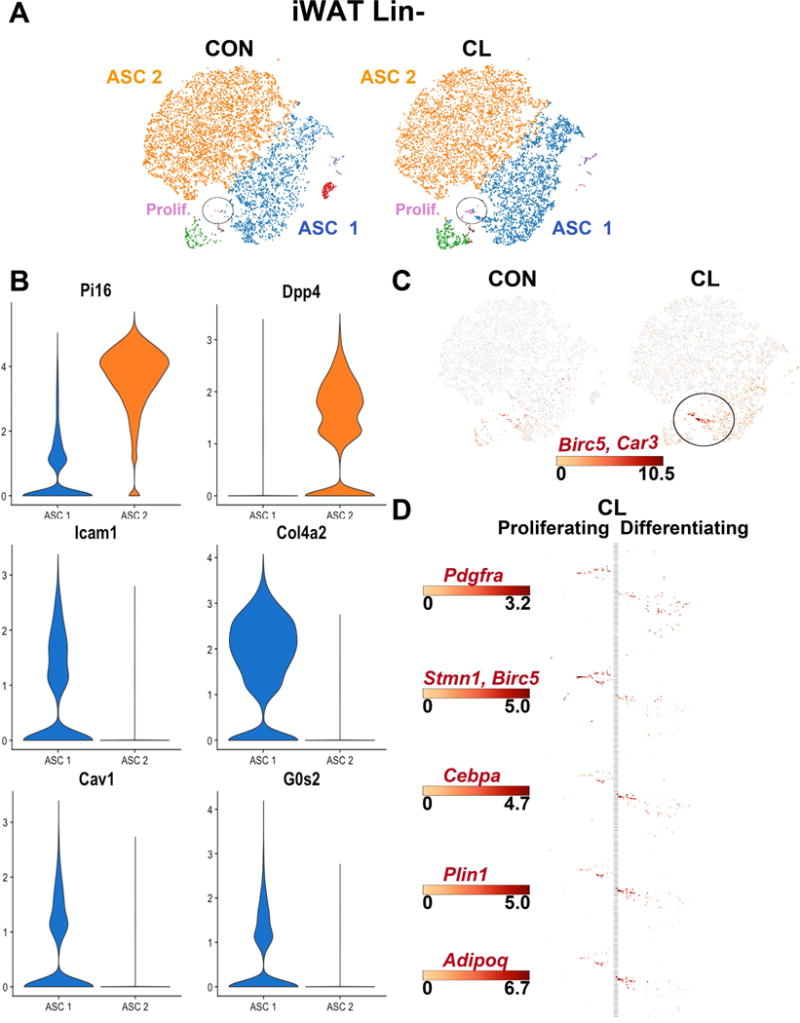
(A) t-SNE plots of a combined 16,023 cells isolated from inguinal white adipose tissue (iWAT) of control and mice treated with CL for 3 days. K-means clustering defined seven main clusters, which are segregated by treatment condition (CON or CL). Clusters ASC 1 and ASC 2 comprise the majority of the cell types and are distinguished from each other by differential expression of genes associated with ECM production and turnover (the list of cluster-defining DEGs is given in Table S3). ASC, adipocyte stem cells. Cell counts by cluster: ASC 1 = 5,198 (32%), ASC 2 = 9,700 (61%), Prolif. = 66 (0.4%). (B) Violin plots showing the mean and variance expression density of specified genes in iWAT ASC 1 and ASC 2 for the following genes: Pi16, Dpp4, Icam1, Col4a2. Expression profiles of Pi16 and Dpp4, and Icam1 and Col4a2 show a striking demarcation of clusters ASC 1 and ASC 2. Differential expression of Cav1 and G0s2 suggests that cluster ASC 1 is more poised for adipogenesis. (C) Expression profiles of Birc5 (proliferation) and Car3 (adipogenesis) identified very few cells within an adipogenic trajectory. (D) Expression profiles of genes involved in adipocyte proliferation and differentiation. Scale bars denote maximum Log2 expression values for each gene.
Similarities and differences between ASC of eWAT and iWAT
To directly compare the transcriptional profiles of ASC populations in eWAT and iWAT, control scRNA-seq libraries from both depots were aggregated. Control ASC from eWAT and iWAT fell into two major clusters (ASC 1 and ASC 2) following K-means clustering (Figure 6A and Table S4). By splitting these clusters according to depot, it becomes clear that the pattern of gene expression reflects the source of ASC (Figure 6B). Results of K-means clustering indicates that the vast majority of ACS from eWAT have transcriptional profiles more similar to ASC 1 than ASC 2; while both ASC clusters are found each depot, the position of these ASC populations in the tSNE plot indicates clear depot-selective differences within ASC clusters. Depot-specific differences could be evaluated by refined clustering or by identifying DEGs between depots using the lasso utility in the Loupe™ Cell Browser software. Comparing gene expression profiles between ASC 1 and ASC 2, we found genes specific to each cluster, but there were also genes that are common to both clusters (Figure 6C). As expected, the adipogenic transcription factors Cebpa and Pparg are sporadically expressed in ACS. Nonetheless, 12% and 14% of cells in cluster ASC 1 expressed Cebpa and Pparg, respectively, compared to 1.8% and 4.0% in ASC 2 (chi square, p < 0.00001). Together, these observations indicate that the two major populations of ASC in iWAT and eWAT could be differentially primed for adipogenesis and is consistent with previous studies that used Pparg-driven Cre recombinase to trace subpopulations of adipogenic stromal cells (Tang et al., 2008). That is not to say, however, that cells within ASC 2 are incapable of adipogenesis. In this regard, we note that the vast majority of genes detected in Pdgfra+ Ly6a/Sca1+ ASC are not differentially expressed. We hypothesize that the clusters represent different states wherein certain stimuli in the microenvironment drive cells closer to an adipogenic phenotype. Thus, in cluster ASC 2 of eWAT, CL treatment greatly reduced expression of Pi16, Ackr3, Anxa3, Cd55, and Igfbp6, and upregulated expression of proadipogenic factors Igf1, Sfrp1, and Adam12 (Figure S3).
Figure 6. Comparison of ASCs from eWAT and iWAT.
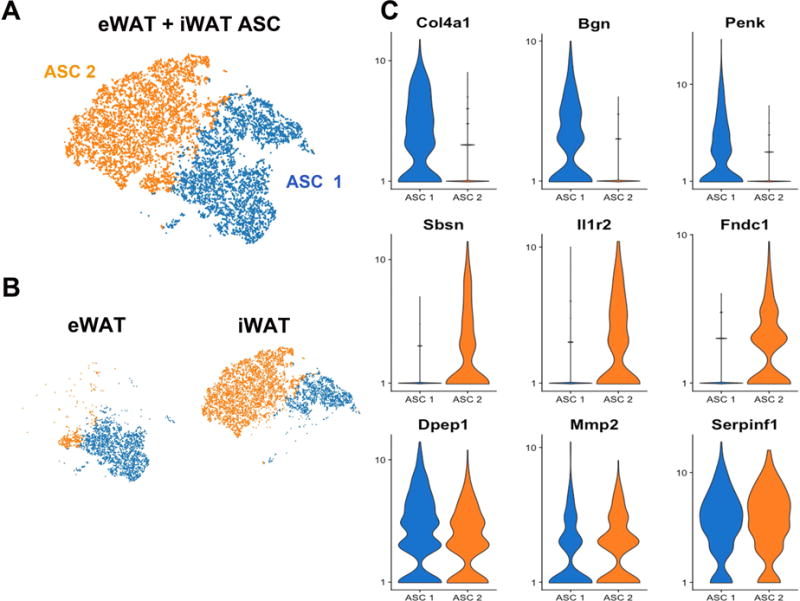
(A) t-SNE plot of combined Lin− cells from eWAT and iWAT of control mice, showing only the adipocyte stem cells. K-means clustering identified 2 main clusters labeled ASC 1 and ASC 2. ASC, adipocyte stem cells. Cell counts by cluster: ASC 1 = 5,058 (45%), ASC 2 = 6,071 (55%). (B) Segregating libraries by depot indicates distinct expression profiles of ASC from iWAT and eWAT. (C) Violin plots showing the mean and variance of gene expression in ASC 1 and ASC 2 for Col4a1, Bgn, Penk, Sbsn, Il1r2, Fndc1, Dpep1, Mmp2, and Serpinf1. Gene expression profiles illustrate differences and similarities between depots and among ASC subpopulations. Expression of Col4a1, Bgn, and Penk have higher expression in ASCs from eWAT, while Sbsn, Il1r2, and Fndc1 are expressed in ASCs from iWAT. However, some genes, like Dpep1, Mmp2, and Serpinf1, are expressed in all ASC. The complete list of DEGs that define ASC 1 and ASC 2 is presented in Table S4.
In summary, our results demonstrate the power of scRNA-seq to deconvolve stromal cell heterogeneity and to infer adipogenic trajectories. scRNA-seq identifies distinct ASC populations that differentially express genes related to ECM remodeling, which also appear to be differentially poised to enter the adipogenic pathway. Comprehensive and unbiased scRNA-seq of ASC indicates induction of de novo adipogenesis by ADRB3 activation is a prominent feature of epididymal, but not inguinal WAT. Lastly, we have made the primary and processed data sets from these experiments, more than 33,000 cells total, publically available as a resource for mining and further analysis.
Limitations
There are certain limitations to the interpretation of our results. First, it is possible that the tissue dissociation and cell isolation procedures required to generate single cells alter gene expression profiles. Second, our profiling excluded analysis of mature fat cells, whose size and fragility currently present technical challenges for droplet-based single cell analysis. Nonetheless, we note that the overall pattern of gene expression observed in the present experiments is consistent with analysis of bulk tissue RNA, as well as RNA from enriched cell populations isolated by FACS. We anticipate that the development of protocols for analyzing RNA of single nuclei isolated directly from tissue will circumvent current limitations involving cell dissociation and fat cell isolation. Lastly, scRNA-seq provides no information regarding cell location, so it is important to interpret results in the context of concurrent or retrospective histochemical analysis. In this regard, multiplexed in situ hybridization of cell type-specific reference genes offers a comparable means of locating and cross-validating expression patterns observed in scRNA-seq data.
STAR METHODS
CONTACT FOR REAGENTS AND RESOURCE SHARING
Further information and requests for resources and reagents should be directed to and will be fulfilled by the Lead Contact, James Granneman (jgranne@med.wayne.edu).
EXPERIMENTAL MODEL AND SUBJECT DETAILS
C57BL/6J mice were purchased from Jackson Laboratory, Stock Number 000664 (Bar Harbor, ME). All mice were housed at 24°C +/− 2°C with a 12:12 light-dark cycle in an AALAC-approved animal facility at Wayne State University (Detroit, MI). Mice were fed a standard chow diet ad libitum (LabDiet 5L0D, PMI Nutrition International, Brentwood, MO). Animal protocols were approved by the Institutional Animal Care and Use Committee at Wayne State University. Continuous β3-adrenergic stimulation was performed as previously described (Granneman et al., 2003). Briefly, mice were anesthetized using Avertin and implanted subcutaneously with an osmotic micropump (AZLET; Cupertino, CA). This pump allowed for continuous release of the β3 agonist CL316,243 (CL; Sigma-Aldrich, St. Louis, MO) at a rate of 0.75 nmol/h. Control mice underwent sham operation. After 3 days, mice were then euthanized by CO2 asphyxiation and cervical dislocation. All mice were male, and were euthanized at 8-9 weeks of age.
METHOD DETAILS
Isolation of stromal vascular cells from mouse eWAT and iWAT
Epididymal and inguinal white adipose tissues (WAT) of were surgically removed after CL treatment and processed for stromal vascular cell (SVC) isolation. Tissues of 4 mice were pooled for SVC isolation, as previously described (Lee et al., 2012). Briefly, following dissection, eWAT and iWAT were washed with PBS, minced, and digested with type 2 collagenase (eWAT: 1 mg/mL; iWAT: 2 mg/mL; Worthington Biochemical Co.) in Hanks’ balanced salt’s solution (HBSS; Gibco; Sigma-Aldrich) containing sodium bicarbonate, 10 mM HEPES (pH 7.4, Gibco; Sigma-Aldrich) and 0.5% fatty acid free bovine serum albumin (FF-BSA; Gemini Bio-products, West Sacramento, CA) for 30 minutes at 37 °C. Ethylenediaminetetraacetic acid (EDTA) was added to a final concentration 10 mM and the tissues were incubated for an additional 5 minutes to promote full dissociation of SVCs.
Dissociated cells were filtered through a cell strainer, washed with a PBS buffer containing 1 mM EDTA, 2.5 mM HEPES, and 10% heat-inactivated fetal bovine serum (FBS, Atlanta Biologicals Inc; Flowery Branch, GA) (FACS buffer), then centrifuged at 500 × g for 10 minutes at 4 °C. After removing the supernatant, pellets containing the stromal vascular faction were incubated in red blood cell lysis buffer (containing sodium bicarbonate, ammonium chloride, and 0.5 M EDTA; pH 7.4) for 5 minutes at room temperature, then passed through a 100 μm sterile cell strainer and collected by centrifugation at 500×g for at 4°C for 10 minutes. Cellular debris was removed by gradient centrifugation in Iodixanol solution (52.2% and 50% Iodixanol; OptiPrep; Sigma-Aldrich; St. Louis, MO) overlaid with FACS buffer. Cells recovered in the FACS buffer layer were pelleted, washed, and resuspended in PBS containing 5% FF-BSA.
Fluorescence-activated cell sorting (FACS)
Isolated SVCs from 3 mice per treatment were pooled and resuspended in HBSS containing 1 mM EDTA (Boston BioProducts Inc.; Ashland, MA), 2.5 mM HEPES and 1% FBS at a final concentration of 1 × 10⁷ cells/mL. SVCs were pre-incubated with Fc block (anti-mouse-CD16/32; Biolegend; San Diego,CA; cat# 101302) (0.5 ug/1 × 106 cells) for 10 min and then incubated with anti-mouse PDGFRα-PE (anti-CD140a; 1/200; Biolegend cat#135906) and anti-mouse CD44-FITC (1/100; Biolegend cat#103006) for 30 min (Lee et al., 2013; Lee et al., 2012) at 4°C protected from light. Cells were washed twice with HBSS to remove unbound antibodies.
Cells were sorted using Sony SH800 Cell Sorter (Sony Biotechnology; San Jose, CA) using 488nm laser. Emission filters used were for PE: 561LP plus 585/30; and FITC: dichroic 561LP plus 525/50. All compensation was performed at the time of acquisition in SH800 software using compensation beads (Biolegend) for single color staining and SVCs for negative staining and fluorescence minus one controls.
SVC from control and CL-treated were sorted for each experiment and the experiment was repeated 4 independent times. Sorted PDGFRA+CD44− and PDGFRA+CD44+ cells were collected in TRIzol (Ambion, Thermo Fisher Scientific), and total RNA was isolated using micro Direct-zol™ RNA Microprep kit (Zymo Research; Irvine, CA). RNA concentration and quality were measured using Nano-drop 2000 (Thermo Fisher Scientific) and Bioanalyzer 2100 Eukaryote Total RNA Nano kit (Agilent; Santa Clara, CA). All samples had an RNA integrity number (RIN) greater than 7.
Magnetic Bead Enrichment of Cellular Subtypes
SVCs were fractionated in to lineage+ and lineage− pools. SVC were labeled with microbead-tagged Direct Lineage Cell Depletion Cocktail (anti-CD5, CD11b, CD45R (B220), Anti-Gr-1 (Ly-6G/C), 7-4, and Ter-119; Miltenyi Biotec, Cat. No. 130-110-470) and passed onto MS columns (Miltenyi Biotec, Cat. No. 130-042-201) following the manufacturer’s protocol. The flow through (lineage−) was collected and the bound cells were eluted (Lineage+ fraction). Cell fractions were resuspended in PBS with 0.04% FF-BSA, counted, and diluted to a concentration of 1,000 cells/μL.
RNA seq library preparation of FACS-sorted cells and Next Generation Sequencing
RNA-Seq libraries were prepared using the QuantSeq forward 3′-mRNA-Seq Library Prep kit (Lexogen GmbH, Vienna, Austria) from 70 ng total RNA according to manufacturer instructions. Libraries quality and concentration were assessed using 2100 Bioanalyzer High Sensitivity DNA kit (Agilent; Santa Clara, CA) and KAPA SYBR Fast Universal qPCR Kit (Roche; Madison, WI), respectively, and then pooled at equal concentrations. Libraries were sequenced by GENEWIZ Inc (South Plainfield, NJ) using Illumina HiSeq system (Illumina; San Diego, CA) with a 1×50bp configuration, yielding ~5 million reads per sample.
Single cell RNA sequencing
Following magnetic cell sorting, single cell RNA libraries for lineage− eWAT and iWAT, along with Lineage+ eWAT were loaded onto the Single Cell 3′ Chip. Approximately 10,000 cells were loaded per channel for an expected recovery of ~6,000 cells. The loaded Single Cell 3′ Chip was placed on a 10X Genomics Chromium™ Controller Instrument (10X Genomics, Pleasanton, CA, USA) to generate single cell gel beads in emulsion (GEMs). Single cell RNA-seq libraries were prepared using the Chromium Single Cell 3′ Library & Cell Bead Kit (Cat. No. 120237, 120236, 120262; 10X Genomics) according to the manufacturer’s protocol. Libraries were sequenced with an Illumina NextSeq500 using high output 75-cycle kits with the following read length configuration: 26 bp read1, 14bp I7index, 8bp I5 index and 58 bp read2.
The Cell Ranger™ Single Cell Software Suite v.2.0.1 was used to perform sample demultiplexing, alignment, filtering, and UMI counting (https://support.10xgenomics.com/single-cell-gene-expression/software/pipelines/latest/what-is-cell-ranger). Sham surgery and CL treatment data for each respective subpopulation were aggregated for direct comparison of single cell transcriptomes. Clustering and gene expression were visualized with 10X Genomics Loupe™ Cell Browser v.1.0.1 (https://support.10xgenomics.com/single-cell-gene-expression/software/visualization/latest/what-is-loupe-cell-browser).
The complete spreadsheet of the sequencing metrics is presented in the Supplementary Information (Table S5). A total of 33,663 single cells consisting of the Lineage+ and Lineage-cell subpopulations were captured, with the number of cells recovered per channel ranging from 3,472 to 8,131. The mean reads per cell varied from 15,154 and 39,037 with median Unique Molecular Indexes of 2,678 to 5,545 per cell.
Gene ontologies of DEGs were assessed using the PANTHER Overrepresentation Test (Gene Ontology Consortium, http://www.geneontology.org/), with the reported p values corrected by the Bonferroni adjustment for multiple comparisons.
QUANTIFICATION AND STATISTICAL ANALYSIS
Differentially Expressed Genes from Bulk RNA-sequencing of FACS sorted cells
RNA sequencing data from FACs sorted PDGFRA+, CD44+/− cells were demultiplexed and then further processed using the Bluebee genomics platform (Cambridge, MA). Differential gene expression analysis was conducted using DESeq2 in the DEApp program (Li and Andrade, 2017), with the filtering threshold set at a fold change (FC) >1.5 and the false discovery rate (FDR) adjusted p value <0.05. Normalized read counts (Log2 transformed) of the differentially expressed genes (PDGFRA+/CD44− vs PDGFRA+/CD44+; CON vs CL) were then extracted using the preprocess reads counts module in GenePattern v. 3.9.10 ((www.broadinstitute.org/genepattern), and hierarchal clustering analysis performed in Heatmapper, as described (Babicki et al., 2016).
Differentially Expressed Genes from Single-cell RNA-sequencing
Cell Ranger™ software (10X Genomics) was used to identify cluster-specific gene expression. Cell Ranger™ tests whether the in-cluster mean gene expression per cell differs from the out-of-cluster mean for each gene and each cluster. A negative binomial exact test is employed to find differentially expressed genes between clusters (Robinson and Smyth, 2008; Yu et al., 2013). Unless we indicate which two groups of cells are compared, the analysis is run on one cluster versus all other cells. The output is a list of genes that are differentially expressed where p-values are adjusted to account for the number of hypotheses (i.e. genes) being tested using Benjamini-Hochberg procedure. To produce violin plots of the mean and variance of the mean and variance of gene expression density, cluster identities and filtered gene matrices generated by Cell Ranger™ were used as input into the open-source R toolkit Seurat (http://satijalab.org/seurat/) (Satija et al., 2015). Cluster identities for each cell as defined by K-means clustering in Cell Ranger™ were set as the identities in the Seurat object. Violin plots for the given genes were generated using the Seurat toolkit VlnPlot function.
Independent Clustering and Pseudotime Analysis
As above, using the cluster identities defined by K-means clustering in Cell Ranger™ as input into Seurat, clusters Diff. ASC and Pro. ASC from Figure 1A were subset for clustering and pseudotime analysis. After quality filtering cells and log normalization of reads, principal component analysis, shared nearest neighbor clustering, and t-SNE projection were performed. Plotting the first two principal components revealed that -[PC1] could be used as a surrogate for pseudotime. Using a standard linear model (i.e., Pearson correlation), normalized gene expression for all genes was correlated with pseudotime. Finally, p-values were adjusted using the Benjamini-Hochberg procedure.
DATA AND SOFTWARE AVAILABILITY
FASTQ files from these scRNA-seq libraries are available at the Pique-Regi lab webpage (piquelab.wayne.edu), as well as the Sequence Read Archive (SRA; https://www.ncbi.nlm.nih.gov/sra/) (SRA: SRP145475). Scripts for data processing are available through GitHub (https://github.com/RBBurl1227).
Supplementary Material
Figure S1. RNA-seq analysis of FACS-isolated PDGFRA+ cells from eWAT of control and CL-treated mice. Related to STAR Methods. (A) Upper panel: representative plot of fluorescence-activated cell sorting analysis of stromal vascular cells (SVC) showing PDGFRA+ cells sorted as CD44+ and CD44− in control (CON) and CL-treated mice. Lower panel: Average data from 4 independent experiments. (B) Pearson complete linkage hierarchical clustering analysis of differentially expressed genes among PDGFRA+CD44− (CD44P) and PDGFRA+CD44− (CD44N) cells in control (CON) and CL-treated mice. Colors in the heatmap represent row Z-score calculated from normalized transcript reads (Log2 transformed).
Figure S2. Pseudotime analysis of proliferating/differentiating cells. Related to Figure 2C. (A) PCA plot of the first two principal components reveals that principal component 1 (PC1) orders cells along the differentiation trajectory, and can therefore be used as a surrogate for ordering cells in pseudotime. Plotting pseudotime versus normalized gene expression for the genes in Figure 2B follows an expected pattern for adipocyte differentiation. These genes were significantly correlated with pseudotime analysis: Pdgfra (r = −0.46), Cdca8 (r = −0.53), Cebpa (r = 0.57), Plin1 (r = 0.74), and Adig (r = 0.62). (B) Genes whose expression was correlated with pseudotime using a Pearson correlation were determined. Shown are the top 5 positively and negatively correlated genes from this analysis. Positively correlated: Fabp4 (r = 0.79), Adipoq (r = 0.79), Acsl1 (r = 0.74), Prkar2b (r = 0.74), and Plin1 (r = 0.74). Negatively correlated: S100a6 (r = −0.72), Ifitm3 (r = −0.72), Wbp5 (r = −0.68), Col1a2 (r = −0.66), and Timp2 (r = −0.66). All genes significantly correlated with the pseudotime analysis are presented in Table S2D.
Figure S3. CL treatment upregulates expression of genes involved in cell migration, proliferation, and ECM remodeling in eWAT adipocyte stem cells. Related to Figures 1 and 2. t-SNE plots show the ASC populations defined in Figure 1A, segregated by treatment condition. (A) CL upregulates expression of Cxcl12, Igf1, Adam12, and Sfrp1 and (B) downregulates expression of Creb5, Igfbp6, Pi16, and Timp3. Expression scale bars show Log2 values of max gene expression.
Figure S4. Expression patterns of adipogenic/proliferation genes in ASC from aggregate Lin+ and Lin− fractions identifies proliferating and differentiating ASCs. Related to Figure 3. t-SNE plot of clusters ASC and Diff. ASC from Figure 3A. Expression of Pdgfra defines ASC. Expression of Cebpa and Plin1 map to population defined in Figure 3A as differentiating ASC. Cdca8 defines actively proliferating ASC. Expression scale bars represent Log2 values of max gene expression.
Figure S5. Correspondence of DEGs identified by bulk RNA-sequencing of FACS sorted PDGFRA+CD44+ cells to scRNA-seq. Related to Figures 1 and S1. Lists of the top 25 upregulated or downregulated genes identified from bulk RNA sequencing of PDGFRA+CD44+ cells compared to PDGFRA+CD44− cells were used as input into the 10X Genomics Loupe program. Shown are the t-SNE plots of the eWAT Lin− cell fraction segregated by treatment (CON or CL), also shown in Figure 1B. Color intensities represent the sum of the Log2 expression values for the input gene list. (A) Differentially upregulated genes in PDGFRA+CD44+ cells are enriched with CL treatment and expressed in cells undergoing active adipogenesis. (B) Differentially downregulated genes in PDGFRA+CD44+ cells are reduced in adipogenic clusters that were induced by CL.
Figure S6. Expression of M2 macrophage markers in scRNA-seq. Related to Figure 4. Distribution of M2 markers, previously shown to be upregulated by CL, on the t-SNE plot of eWAT Lin+ cells from Figure 4. Scale bars represent Log2 values of maximum gene expression.
Table S1. RNA-seq analysis of FACS-isolated control and CL-treated PDGFRA+ cells. Related to Figure S1.
Table S2. Gene lists corresponding to mouse eWAT data. Related to Figures 1, 2, 3, 4, and S2. (A) List of significant DEGs of clusters defined by K-means clustering and shown in Figure 1. eWAT, Lin− cell fraction, CON and CL. (B) Genes regulated by CL treatment in clusters ASC 1 and 2, related to Figure 1. eWAT, Lin− cell fraction, CON and CL. (C) List of significant DEGs of clusters defined by shared nearest neighbor clustering in Seurat and shown in Figure 2C. (D) List of genes that were significantly correlated with –PC1 (pseudotime), shown in Figure S2. (E) List of significant DEGs of clusters defined by K-means clustering and shown in Figure 3. eWAT, Lin+ and Lin− cell fractions, CON and CL. (F) List of significant DEGs of clusters defined by K-means clustering and shown in Figure 4. eWAT, Lin+ cell fraction, CON and CL.
Table S3. Gene lists corresponding to mouse iWAT data. Related to Figure 5. List of significant DEGs of clusters defined by K-means clustering. iWAT, Lin− cell fraction, CON and CL.
Table S4. Gene lists corresponding to aggregate mouse eWAT and iWAT data. Related to Figure 6. eWAT and iWAT, Lin− cell fractions, CON.
Table S5. Metrics for scRNA-seq libraries. Related to STAR Methods.
Highlights.
-Transcriptomes of > 33,000 single adipose tissue stromal cells are provided.
-scRNA-seq reveals heterogeneity of adipocyte progenitors and immune cells.
-scRNA-seq identifies adipogenic niches and maps differentiation trajectories.
Acknowledgments
This work was supported by NIH grants RO1DK62292 and RO1DK102455 (JGG), and 1R01GM109215 (RPR), and by equipment funds from the Office of the Vice President for Research, Wayne State University. We thank Jian Wang, Doug Ruden and Todd Leff for thoughtful reviews.
Footnotes
Publisher's Disclaimer: This is a PDF file of an unedited manuscript that has been accepted for publication. As a service to our customers we are providing this early version of the manuscript. The manuscript will undergo copyediting, typesetting, and review of the resulting proof before it is published in its final citable form. Please note that during the production process errors may be discovered which could affect the content, and all legal disclaimers that apply to the journal pertain.
Author contributions: All authors contributed to experimental design, data interpretation, and writing the manuscript. RBB and EAR performed experiments involving drug treatment, cell isolation and scRNA-seq. VDR performed experiments involving drug treatment, cell isolation, FACS and RNA-seq. RPR supervised sequencing, data analysis, and bioinformatics. The project was conceived by YHL and JGG, and supervised by JGG.
Author Declarations: The authors have nothing to declare.
References
- Amano SU, Cohen JL, Vangala P, Tencerova M, Nicoloro SM, Yawe JC, Shen Y, Czech MP, Aouadi M. Local proliferation of macrophages contributes to obesity-associated adipose tissue inflammation. Cell Metab. 2014;19:162–171. doi: 10.1016/j.cmet.2013.11.017. [DOI] [PMC free article] [PubMed] [Google Scholar]
- Aouadi M, Vangala P, Yawe JC, Tencerova M, Nicoloro SM, Cohen JL, Shen Y, Czech MP. Lipid storage by adipose tissue macrophages regulates systemic glucose tolerance. Am J Physiol Endocrinol Metab. 2014;307:E374–383. doi: 10.1152/ajpendo.00187.2014. [DOI] [PMC free article] [PubMed] [Google Scholar]
- Babicki S, Arndt D, Marcu A, Liang Y, Grant JR, Maciejewski A, Wishart DS. Heatmapper: web-enabled heat mapping for all. Nucleic Acids Res. 2016;44:W147–153. doi: 10.1093/nar/gkw419. [DOI] [PMC free article] [PubMed] [Google Scholar]
- Barbatelli G, Murano I, Madsen L, Hao Q, Jimenez M, Kristiansen K, Giacobino JP, De Matteis R, Cinti S. The emergence of cold-induced brown adipocytes in mouse white fat depots is determined predominantly by white to brown adipocyte transdifferentiation. Am J Physiol Endocrinol Metab. 2010;298:E1244–1253. doi: 10.1152/ajpendo.00600.2009. [DOI] [PubMed] [Google Scholar]
- Berry DC, Jiang Y, Graff JM. Mouse strains to study cold-inducible beige progenitors and beige adipocyte formation and function. Nat Commun. 2016;7:10184. doi: 10.1038/ncomms10184. [DOI] [PMC free article] [PubMed] [Google Scholar]
- Chang HR, Kim HJ, Xu X, Ferrante AW., Jr Macrophage and adipocyte IGF1 maintain adipose tissue homeostasis during metabolic stresses. Obesity. 2016 Silver Spring;24:172–183. doi: 10.1002/oby.21354. [DOI] [PMC free article] [PubMed] [Google Scholar]
- Chun TH, Hotary KB, Sabeh F, Saltiel AR, Allen ED, Weiss SJ. A pericellular collagenase directs the 3-dimensional development of white adipose tissue. Cell. 2006;125:577–591. doi: 10.1016/j.cell.2006.02.050. [DOI] [PubMed] [Google Scholar]
- Cinti S. Transdifferentiation properties of adipocytes in the adipose organ. Am J Physiol Endocrinol Metab. 2009;297:E977–E986. doi: 10.1152/ajpendo.00183.2009. [DOI] [PubMed] [Google Scholar]
- Cinti S, Cigolini M, Gazzanelli G, Bosello O. An ultrastructural study of adipocyte precursors from epididymal fat pads of adult rats in culture. J Submicrosc Cytol. 1985;17:631–636. [PubMed] [Google Scholar]
- Granneman JG, Burnazi M, Zhu Z, Schwamb LA. White adipose tissue contributes to UCP1-independent thermogenesis. Am J Physiol Endocrinol Metab. 2003;285:E1230–1236. doi: 10.1152/ajpendo.00197.2003. [DOI] [PubMed] [Google Scholar]
- Grijalva A, Xu X, Ferrante AW., Jr Autophagy Is Dispensable for Macrophage-Mediated Lipid Homeostasis in Adipose Tissue. Diabetes. 2016;65:967–980. doi: 10.2337/db15-1219. [DOI] [PMC free article] [PubMed] [Google Scholar]
- Himms-Hagen J, Melnyk A, Zingaretti MC, Ceresi E, Barbatelli G, Cinti S. Multilocular fat cells in WAT of CL-316243-treated rats derive directly from white adipocytes. Am J Physiol Cell Physiol. 2000;279:C670–681. doi: 10.1152/ajpcell.2000.279.3.C670. [DOI] [PubMed] [Google Scholar]
- Hong KY, Bae H, Park I, Park DY, Kim KH, Kubota Y, Cho ES, Kim H, Adams RH, Yoo OJ, et al. Perilipin+ embryonic preadipocytes actively proliferate along growing vasculatures for adipose expansion. Development. 2015;142:2623–2632. doi: 10.1242/dev.125336. [DOI] [PubMed] [Google Scholar]
- Kawaguchi N, Xu X, Tajima R, Kronqvist P, Sundberg C, Loechel F, Albrechtsen R, Wewer UM. ADAM 12 protease induces adipogenesis in transgenic mice. Am J Pathol. 2002;160:1895–1903. doi: 10.1016/S0002-9440(10)61136-4. [DOI] [PMC free article] [PubMed] [Google Scholar]
- Lagathu C, Christodoulides C, Tan CY, Virtue S, Laudes M, Campbell M, Ishikawa K, Ortega F, Tinahones FJ, Fernandez-Real JM, et al. Secreted frizzled-related protein 1 regulates adipose tissue expansion and is dysregulated in severe obesity. Int J Obes (Lond) 2010;34:1695–1705. doi: 10.1038/ijo.2010.107. [DOI] [PMC free article] [PubMed] [Google Scholar]
- Lagathu C, Christodoulides C, Virtue S, Cawthorn WP, Franzin C, Kimber WA, Nora ED, Campbell M, Medina-Gomez G, Cheyette BN, et al. Dact1, a nutritionally regulated preadipocyte gene, controls adipogenesis by coordinating the Wnt/beta-catenin signaling network. Diabetes. 2009;58:609–619. doi: 10.2337/db08-1180. [DOI] [PMC free article] [PubMed] [Google Scholar]
- Lee YH, Kim SN, Kwon HJ, Granneman JG. Metabolic heterogeneity of activated beige/brite adipocytes in inguinal adipose tissue. Sci Rep. 2017;7:39794. doi: 10.1038/srep39794. [DOI] [PMC free article] [PubMed] [Google Scholar]
- Lee YH, Kim SN, Kwon HJ, Maddipati KR, Granneman JG. Adipogenic role of alternatively activated macrophages in beta-adrenergic remodeling of white adipose tissue. Am J Physiol Regul Integr Comp Physiol. 2016;310:R55–65. doi: 10.1152/ajpregu.00355.2015. [DOI] [PMC free article] [PubMed] [Google Scholar]
- Lee YH, Petkova AP, Granneman JG. Identification of an adipogenic niche for adipose tissue remodeling and restoration. Cell Metab. 2013;18:355–367. doi: 10.1016/j.cmet.2013.08.003. [DOI] [PMC free article] [PubMed] [Google Scholar]
- Lee YH, Petkova AP, Konkar AA, Granneman JG. Cellular origins of cold-induced brown adipocytes in adult mice. FASEB J. 2015;29:286–299. doi: 10.1096/fj.14-263038. [DOI] [PMC free article] [PubMed] [Google Scholar]
- Lee YH, Petkova AP, Mottillo EP, Granneman JG. In vivo identification of bipotential adipocyte progenitors recruited by beta3-adrenoceptor activation and high-fat feeding. Cell Metab. 2012;15:480–491. doi: 10.1016/j.cmet.2012.03.009. [DOI] [PMC free article] [PubMed] [Google Scholar]
- Lee YH, Thacker RI, Hall BE, Kong R, Granneman JG. Exploring the activated adipogenic niche: interactions of macrophages and adipocyte progenitors. Cell Cycle. 2014;13:184–190. doi: 10.4161/cc.27647. [DOI] [PMC free article] [PubMed] [Google Scholar]
- Li Q, Zhang A, Tao C, Li X, Jin P. The role of SDF-1-CXCR4/CXCR7 axis in biological behaviors of adipose tissue-derived mesenchymal stem cells in vitro. Biochem Biophys Res Commun. 2013;441:675–680. doi: 10.1016/j.bbrc.2013.10.071. [DOI] [PubMed] [Google Scholar]
- Li Y, Andrade J. DEApp: an interactive web interface for differential expression analysis of next generation sequence data. Source Code Biol Med. 2017;12:2. doi: 10.1186/s13029-017-0063-4. [DOI] [PMC free article] [PubMed] [Google Scholar]
- Marcelin G, Ferreira A, Liu Y, Atlan M, Aron-Wisnewsky J, Pelloux V, Botbol Y, Ambrosini M, Fradet M, Rouault C, et al. A PDGFRalpha-Mediated Switch toward CD9high Adipocyte Progenitors Controls Obesity-Induced Adipose Tissue Fibrosis. Cell Metab. 2017;25:673–685. doi: 10.1016/j.cmet.2017.01.010. [DOI] [PubMed] [Google Scholar]
- Robinson MD, Smyth GK. Small-sample estimation of negative binomial dispersion, with applications to SAGE data. Biostatistics. 2008;9:321–332. doi: 10.1093/biostatistics/kxm030. [DOI] [PubMed] [Google Scholar]
- Rosenwald M, Perdikari A, Rulicke T, Wolfrum C. Bi-directional interconversion of brite and white adipocytes. Nat Cell Biol. 2013;15:659–667. doi: 10.1038/ncb2740. [DOI] [PubMed] [Google Scholar]
- Satija R, Farrell JA, Gennert D, Schier AF, Regev A. Spatial reconstruction of single-cell gene expression. Nature biotechnology. 2015;33:495–502. doi: 10.1038/nbt.3192. [DOI] [PMC free article] [PubMed] [Google Scholar]
- Sato-Kusubata K, Jiang Y, Ueno Y, Chun TH. Adipogenic histone mark regulation by matrix metalloproteinase 14 in collagen-rich microenvironments. Mol Endocrinol. 2011;25:745–753. doi: 10.1210/me.2010-0429. [DOI] [PMC free article] [PubMed] [Google Scholar]
- Sengenes C, Miranville A, Maumus M, de Barros S, Busse R, Bouloumie A. Chemotaxis and differentiation of human adipose tissue CD34+/CD31− progenitor cells: role of stromal derived factor-1 released by adipose tissue capillary endothelial cells. Stem Cells. 2007;25:2269–2276. doi: 10.1634/stemcells.2007-0180. [DOI] [PubMed] [Google Scholar]
- Sun C, Berry WL, Olson LE. PDGFRalpha controls the balance of stromal and adipogenic cells during adipose tissue organogenesis. Development. 2017;144:83–94. doi: 10.1242/dev.135962. [DOI] [PMC free article] [PubMed] [Google Scholar]
- Tang W, Zeve D, Suh JM, Bosnakovski D, Kyba M, Hammer RE, Tallquist MD, Graff JM. White fat progenitor cells reside in the adipose vasculature. Science. 2008;322:583–586. doi: 10.1126/science.1156232. [DOI] [PMC free article] [PubMed] [Google Scholar]
- Tran KV, Gealekman O, Frontini A, Zingaretti MC, Morroni M, Giordano A, Smorlesi A, Perugini J, De Matteis R, Sbarbati A, et al. The vascular endothelium of the adipose tissue gives rise to both white and brown fat cells. Cell Metab. 2012;15:222–229. doi: 10.1016/j.cmet.2012.01.008. [DOI] [PMC free article] [PubMed] [Google Scholar]
- Tseng YH, Ueki K, Kriauciunas KM, Kahn CR. Differential roles of insulin receptor substrates in the anti-apoptotic function of insulin-like growth factor-1 and insulin. J Biol Chem. 2002;277:31601–31611. doi: 10.1074/jbc.M202932200. [DOI] [PubMed] [Google Scholar]
- Vishvanath L, MacPherson KA, Hepler C, Wang QA, Shao M, Spurgin SB, Wang MY, Kusminski CM, Morley TS, Gupta RK. Pdgfrbeta+ Mural Preadipocytes Contribute to Adipocyte Hyperplasia Induced by High-Fat-Diet Feeding and Prolonged Cold Exposure in Adult Mice. Cell Metab. 2016;23:350–359. doi: 10.1016/j.cmet.2015.10.018. [DOI] [PMC free article] [PubMed] [Google Scholar]
- Wang QA, Tao C, Gupta RK, Scherer PE. Tracking adipogenesis during white adipose tissue development, expansion and regeneration. Nat Med. 2013;19:1338–1344. doi: 10.1038/nm.3324. [DOI] [PMC free article] [PubMed] [Google Scholar]
- Xue J, Schmidt SV, Sander J, Draffehn A, Krebs W, Quester I, De Nardo D, Gohel TD, Emde M, Schmidleithner L, et al. Transcriptome-based network analysis reveals a spectrum model of human macrophage activation. Immunity. 2014;40:274–288. doi: 10.1016/j.immuni.2014.01.006. [DOI] [PMC free article] [PubMed] [Google Scholar]
- Yu D, Huber W, Vitek O. Shrinkage estimation of dispersion in Negative Binomial models for RNA-seq experiments with small sample size. Bioinformatics. 2013;29:1275–1282. doi: 10.1093/bioinformatics/btt143. [DOI] [PMC free article] [PubMed] [Google Scholar]
Associated Data
This section collects any data citations, data availability statements, or supplementary materials included in this article.
Supplementary Materials
Figure S1. RNA-seq analysis of FACS-isolated PDGFRA+ cells from eWAT of control and CL-treated mice. Related to STAR Methods. (A) Upper panel: representative plot of fluorescence-activated cell sorting analysis of stromal vascular cells (SVC) showing PDGFRA+ cells sorted as CD44+ and CD44− in control (CON) and CL-treated mice. Lower panel: Average data from 4 independent experiments. (B) Pearson complete linkage hierarchical clustering analysis of differentially expressed genes among PDGFRA+CD44− (CD44P) and PDGFRA+CD44− (CD44N) cells in control (CON) and CL-treated mice. Colors in the heatmap represent row Z-score calculated from normalized transcript reads (Log2 transformed).
Figure S2. Pseudotime analysis of proliferating/differentiating cells. Related to Figure 2C. (A) PCA plot of the first two principal components reveals that principal component 1 (PC1) orders cells along the differentiation trajectory, and can therefore be used as a surrogate for ordering cells in pseudotime. Plotting pseudotime versus normalized gene expression for the genes in Figure 2B follows an expected pattern for adipocyte differentiation. These genes were significantly correlated with pseudotime analysis: Pdgfra (r = −0.46), Cdca8 (r = −0.53), Cebpa (r = 0.57), Plin1 (r = 0.74), and Adig (r = 0.62). (B) Genes whose expression was correlated with pseudotime using a Pearson correlation were determined. Shown are the top 5 positively and negatively correlated genes from this analysis. Positively correlated: Fabp4 (r = 0.79), Adipoq (r = 0.79), Acsl1 (r = 0.74), Prkar2b (r = 0.74), and Plin1 (r = 0.74). Negatively correlated: S100a6 (r = −0.72), Ifitm3 (r = −0.72), Wbp5 (r = −0.68), Col1a2 (r = −0.66), and Timp2 (r = −0.66). All genes significantly correlated with the pseudotime analysis are presented in Table S2D.
Figure S3. CL treatment upregulates expression of genes involved in cell migration, proliferation, and ECM remodeling in eWAT adipocyte stem cells. Related to Figures 1 and 2. t-SNE plots show the ASC populations defined in Figure 1A, segregated by treatment condition. (A) CL upregulates expression of Cxcl12, Igf1, Adam12, and Sfrp1 and (B) downregulates expression of Creb5, Igfbp6, Pi16, and Timp3. Expression scale bars show Log2 values of max gene expression.
Figure S4. Expression patterns of adipogenic/proliferation genes in ASC from aggregate Lin+ and Lin− fractions identifies proliferating and differentiating ASCs. Related to Figure 3. t-SNE plot of clusters ASC and Diff. ASC from Figure 3A. Expression of Pdgfra defines ASC. Expression of Cebpa and Plin1 map to population defined in Figure 3A as differentiating ASC. Cdca8 defines actively proliferating ASC. Expression scale bars represent Log2 values of max gene expression.
Figure S5. Correspondence of DEGs identified by bulk RNA-sequencing of FACS sorted PDGFRA+CD44+ cells to scRNA-seq. Related to Figures 1 and S1. Lists of the top 25 upregulated or downregulated genes identified from bulk RNA sequencing of PDGFRA+CD44+ cells compared to PDGFRA+CD44− cells were used as input into the 10X Genomics Loupe program. Shown are the t-SNE plots of the eWAT Lin− cell fraction segregated by treatment (CON or CL), also shown in Figure 1B. Color intensities represent the sum of the Log2 expression values for the input gene list. (A) Differentially upregulated genes in PDGFRA+CD44+ cells are enriched with CL treatment and expressed in cells undergoing active adipogenesis. (B) Differentially downregulated genes in PDGFRA+CD44+ cells are reduced in adipogenic clusters that were induced by CL.
Figure S6. Expression of M2 macrophage markers in scRNA-seq. Related to Figure 4. Distribution of M2 markers, previously shown to be upregulated by CL, on the t-SNE plot of eWAT Lin+ cells from Figure 4. Scale bars represent Log2 values of maximum gene expression.
Table S1. RNA-seq analysis of FACS-isolated control and CL-treated PDGFRA+ cells. Related to Figure S1.
Table S2. Gene lists corresponding to mouse eWAT data. Related to Figures 1, 2, 3, 4, and S2. (A) List of significant DEGs of clusters defined by K-means clustering and shown in Figure 1. eWAT, Lin− cell fraction, CON and CL. (B) Genes regulated by CL treatment in clusters ASC 1 and 2, related to Figure 1. eWAT, Lin− cell fraction, CON and CL. (C) List of significant DEGs of clusters defined by shared nearest neighbor clustering in Seurat and shown in Figure 2C. (D) List of genes that were significantly correlated with –PC1 (pseudotime), shown in Figure S2. (E) List of significant DEGs of clusters defined by K-means clustering and shown in Figure 3. eWAT, Lin+ and Lin− cell fractions, CON and CL. (F) List of significant DEGs of clusters defined by K-means clustering and shown in Figure 4. eWAT, Lin+ cell fraction, CON and CL.
Table S3. Gene lists corresponding to mouse iWAT data. Related to Figure 5. List of significant DEGs of clusters defined by K-means clustering. iWAT, Lin− cell fraction, CON and CL.
Table S4. Gene lists corresponding to aggregate mouse eWAT and iWAT data. Related to Figure 6. eWAT and iWAT, Lin− cell fractions, CON.
Table S5. Metrics for scRNA-seq libraries. Related to STAR Methods.