

Abstract
Growing concern suggests that some chemicals exert (developmental) neurotoxicity (DNT and NT) and are linked to the increase in incidence of autism, attention deficit and hyperactivity disorders. The high cost of routine tests for DNT and NT assessment make it difficult to test the high numbers of existing chemicals. Thus, more cost effective neurodevelopmental models are needed. The use of induced pluripotent stem cells (iPSC) in combination with the emerging human 3D tissue culture platforms, present a novel tool to predict and study human toxicity. By combining these technologies, we generated multicellular brain spheroids (BrainSpheres) from human iPSC. The model has previously shown to be reproducible and recapitulates several neurodevelopmental features. Our results indicate, rotenone’s toxic potency varies depending on the differentiation status of the cells, showing higher reactive oxygen species (ROS) and higher mitochondrial dysfunction during early than later differentiation stages. Immunofluorescence morphology analysis after rotenone exposure indicated dopaminergic-neuron selective toxicity at non-cytotoxic concentrations (1 μM), while astrocytes and other neuronal cell types were affected at (general) cytotoxic concentrations (25 μM). Omics analysis showed changes in key pathways necessary for brain development, indicating rotenone as a developmental neurotoxicant and show a possible link between previously shown effects on neurite outgrowth and presently observed effects on Ca2+ reabsorption, synaptogenesis and PPAR pathway disruption. In conclusion, our BrainSpheres model has shown to be a reproducible and novel tool to study neurotoxicity and developmental neurotoxicity. Results presented here support the idea that rotenone can potentially be a developmental neurotoxicant.
Keywords: Spheroids, DNT, Developmental neurotoxicity, Organoids, Rotenone, In Vitro
1. Introduction
The brain is the most complex human organ and is extremely sensitive to the action of external chemicals and/or physical factors during its ontogenesis. The developing brain has shown a different pattern of sensitivity to environmental insults compared to the adult brain (O’Rahilly and Muller, 2008). Abnormal brain development, during embryogenesis, fetal development or early postnatal periods, can generate cognitive dysfunction as well as neurological, emotional and behavioral disorders (Dubovicky, 2010). Furthermore, early brain damage can lead to diseases later in life, affecting every stage of human life (childhood, adolescence and adulthood). The increased prevalence of neurodevelopmental disorders over the years (Schettler, 2001; Grandjean and Landrigan, 2006), together with evidence that exposure to xenobiotics might contribute to the occurrence of neurodevelopmental disorders (Schettler, 2001; Grandjean and Landrigan, 2006; Lein et al., 2007), has created a big concern about the possible unknown developmental neurotoxic and neurotoxic effects of some chemicals and drugs.
Current DNT guidelines (OECD TG 426 and EPA 712-C-98-239) (USEPA, 1998; OECD, 2007) recommend testing that is based entirely on in vivo animal studies. These animal studies consume about 1400 animals and cost $1.4 million per tested substance and they do not provide relevant results for humans in many cases. Variability, data reporting and analysis, limitations and expectations of DNT have been summarized recently (Smirnova et al., 2014; Li et al., 2017). In vivo DNT testing seems to be insufficient to study and characterize potential hazardous compounds, thus, in vitro testing batteries are required to generate additional data on the effects of chemicals on brain development (Fritsche et al., 2017) and for better identification, prioritization, and evaluation of chemicals with the potential to induce DNT (Bal-Price et al., 2012). Diverse workshops and meetings during the past 10 years have summarized the problems, the available assays and roadmaps for DNT in vitro assays and methods (Coecke et al., 2007; Lein et al., 2007; Crofton et al., 2011; Crofton et al., 2014; Bal-Price et al., 2015a; Bal-Price et al., 2015b). Several in vitro studies have been able to reproduce some of the relevant processes that occur in the brain such as neuronal differentiation (Hartley et al., 1999), migration (Stern et al., 2014), cell-cell interaction, neuritic development, synaptogenesis, myelinogenesis (Liu et al., 2012) and neurotransmission (Hogberg et al., 2011). In addition, they showed to be predictive of DNT (Hogberg et al., 2010; Hogberg et al., 2011; Laurenza et al., 2013; Pallocca et al., 2013). Of importance, animal models cannot reflect human inter-individual genetic differences that might contribute to brain disorders, therefore limiting the development of new personalized drugs that could enhance treatment. Consequently, human models reflecting different genetic backgrounds would likely contribute to a better understanding of the Central Nervous System (CNS) toxicity and disease.
Organotypic models promise to generate in vitro human models that better simulate organ’s biology and function. The recent discovery of human induced pluripotent stem cells (iPSC) (Takahashi and Yamanaka, 2006; Takahashi et al., 2007) open a range of possibilities allowing cellular studies of human disease models in different human genetic backgrounds. iPSC from different donors in organotypic models give the opportunity to better understand human diseases and can advance as a novel tool different fields, such as drug development, toxicology and medicine. Recently, we have established a 3D model consisting of aggregating cultures of iPSC-derived neural cells (BrainSpheroids) based on our previous experience with 3D rat primary aggregating brain cell cultures (van Vliet et al., 2007; van Vliet et al., 2008). As part of larger efforts to create the Human-on-a-Chip, we have reported the development of a 3D brain human iPSC derived model (BrainSpheres) and its biological and medical applications (Hogberg et al., 2013; Pamies et al., 2017; Zander et al., 2017). BrainSpheres, developed in our laboratory (Pamies et al., 2017), were the first highly standardized model with hundreds of identical spheroids per batch and high reproducibility between batches and donors, thus enabling multiple applications in regenerative medicine, neuronal diseases, neuro-toxicology, and developmental biology.
Rotenone is a commonly used plant-derived pesticide that inhibits mitochondrial Complex I of the electron transport chain (Saravanan et al., 2005). At certain concentrations, rotenone has been shown to produce progressive neurodegeneration of dopaminergic and non-do-paminergic neurons, and also of other brain cell populations such as astrocytes (Betarbet et al., 2000; Sindhu et al., 2005; Zagoura et al., 2017). Rotenone has been suggested as one of the most important environmental risk factor for Parkinson’s Disease (PD) (Betarbet et al., 2000; Perier et al., 2003; Spivey, 2011; Tanner et al., 2011; Nandipati and Litvan, 2016). The major effect of rotenone is related to dopaminergic dysfunction, however, animal studies have found that rotenone may cause diffuse mitochondrial dysfunction in central non-dopaminergic and peripheral cells outside of the CNS (Fleming et al., 2004; Richter et al., 2007) and affect fish, chick and rat development (Khera et al., 1982; Spencer and Sing, 1982; Melo et al., 2015; Rao and Chauhan, 2004). In addition, in vitro studies on human iPSC-derived mixed neuronal and glial cultures have shown activation of the Keap1-Nrf2-ARE pathway after acute and chronical rotenone exposure, at non-cytotoxic concentrations (Pistollato et al., 2017; Zagoura et al., 2017). The Keap1-Nrf2 pathway is the major regulator of cytoprotective responses to oxidative and electrophilic stress (Kansanen et al., 2013). In addition, chronic exposure to rotenone in differentiating neurons and astrocytes produces an induction of astrocyte reactivity, reduction of neurite length and neuronal cell number, and in particular, a decrease of Dopamine (DA) tyrosine hydroxylase positive (TH+) neuronal cells. Overall, evidence suggests that rotenone may affect not only the adult CNS but also the developing brain likely through induction of oxidative stress that can trigger neuronal cell death and alteration of calcium pathways.
In this study, we have exposed human iPSC-derived brain spheroids (BrainSpheres) to several concentrations of rotenone at different stages of differentiation, mimicking different windows of vulnerability (short-term pulse exposure at 2, 4 and 8 weeks of in vitro differentiation). Results indicated that BrainSpheres at 2 weeks were more sensitive to rotenone than at later stages of BrainSpheres maturation and responded with higher reactive oxygen species (ROS) production. Moreover, transcriptomic and metabolomics data show a persistent and lasting broader effect of rotenone on BrainSpheres differentiation.
2. Methods
2.1. Chemicals
Rotenone was supplied by (Sigma). A stock of 10 mM was prepared in DMSO Hybri-Max (Sigma).
2.2. NPC production
NPC were kindly provided by Professor Hongjun Song’s lab within our joint NIH NCATS project (Pamies et al., 2017). NPCs were derived from C1 (CRL-2097) fibroblasts purchased from ATCC. Differentiation from iPSC to NPC has been previously described (Wen et al., 2014). NPCs were expanded in poly-l-ornithine and laminin-coated 175 mm2 flasks in NPC expanding medium (KnockOut DMEM/F12, Glutamax, EGF and bFGF). Half of the media was changed every day. Cultures were maintained at 37 °C in an atmosphere of 5% CO2. NPC from passage 15 to 25 were used for this study.
2.3. BrainSpheres differentiation
The BrainSpheres were generated as described (Pamies et al., 2017). Briefly, at 90% confluency, NPC were detached mechanically and counted. A number of 2 × 10⁶ cells per well were plated in uncoated 6 well-plates. Cells were grown in NPC media for two days and then medium was changed to a differentiation medium (Neurobasal® electro Medium (Gibco) supplemented with 5% B-27® Electrophysiology (Gibco), 1% Glutamax (Gibco), 0.01 μg/ml human recombinant GDNF (Gemini), 0.01 μg/ml human recombinant BDNF (Gemini). Cultures were kept at 37 °C in an atmosphere of 5% CO2 under constant gyratory shaking (88 rpm, 19 mm orbit) for up to 8 weeks.
2.4. Immunohistochemistry of the BrainSpheres
BrainSpheres were collected at 2, 4 and 8 weeks of differentiation after exposure to increasing concentrations of Rotenone. BrainSpheres were fixed in 4% paraformaldehyde for 1 h, washed 3 times in 1× PBS, then incubated for 1 h in blocking solution consisting of 5% normal goat serum (NGS) in PBS with 0.4% Triton-×100 (Sigma). BrainSpheres were then incubated at 4 °C for 48 h with a combination of primary antibodies (Table 1) diluted in PBS containing 3% NGS and 0.1% Triton-X100. BrainSpheres were washed 3 times in 1× PBS and were incubated with the secondary antibody for 1 h in PBS with 3% NGS at room temperature. Double immunostaining was visualized using the proper combination of secondary antibodies (e.g., goat anti-rabbit secondary antibody conjugated with Alexa 594 and goat anti-mouse secondary antibody conjugated with Alexa 488 (both from Molecular Probes). Nuclei were counterstained with DRAQ5 dye (Cell Signaling Technology; 1:5000 in 1× PBS) for 15 min before mounting on slides with coverslips and Prolong Gold Anti-Fade reagent (Molecular Probes); BrainSpheres used as negative controls for immunostaining were processed by omitting the primary antibody. The images were taken using a Zeiss UV-LSM 510 confocal microscope. The experiments were performed in duplicates; at least three different fields of view were analyzed for each combination of antibodies.
Table 1.
Primary antibodies for immunohistochemistry.
| Antibody | Host | Type | Source | Dilution |
|---|---|---|---|---|
| NF | Rabbit | Polyclonal | Enzo | 1:1000 |
| GFAP | Rabbit | Polyclonal | Dako | 1:500 |
| O1 | Mouse | Monoclonal | Millipore | 1:500 |
| Map2 | Mouse | Monoclonal | Chemicon | 1:1000 |
| Tub3b | Rabbit | Polyclonal | R&D | 0.2 μg/ml |
2.5. Cytotoxicity
BrainSpheres aggregates were exposed to Rotenone for 24 and 48 h at 2, 4 and 8 weeks during the cell differentiation process. At 24 and 48 h before the 2, 4 and 8 weeks time point, medium with a fresh portion of different concentrations of rotenone was replaced using 10 nM and 100 μM of stock solutions prepared in DMSO Hybri-Max to reach a final concentration of 0, 0.1, 1, 10, 25, 50 μM. To detect cell viability, AB (resazurin) assay was performed. Resazurin (7-Hydroxy-3H-phenoxazin-3-one 10-oxide) is a blue dye that is reduced into fluorescent resorufin by redox reactions in viable cells. Resazurin (100 μl of 2 mg/ml stock) in PBS was added directly to 6 well plates (2 ml/well). The plate was incubated for 3 h at 37 °C, 5% CO2. Afterwards, 50 μl of the each well was transfered to a 96-well plate and the fluorescence of resorufin was measured at 530 nm/590 nm (excitation/emission) in a multi-well fluorometric reader CytoFluor serie 4000 (PerSeptive Biosystems, Inc). To determine statistical significance, one-way ANOVA test was performed with post-hoc Bonferroni test. All data given are the means ± SD of three to seven independent experiments performed with 3 technical replicates.
2.6. Mitochondrial dysfunction assay
Mitochondrial dysfunction was measured by MitoTracker Red CMXRos (Life Technologies). At 2, 4 or 8 weeks of differentiation, BrainSpheres were plated in 24-well-plates (500 μl), and exposed to different concentrations of rotenone (0, 0.1, 1, 10, 25, 50, 100 μM) for 12, 24 and 48 h. Thirty minutes before the end of exposure, 1 μl of MitoTracker Red CMXRos was added to the medium. Cells were incubated for 30 min at 37 °C, 5% CO2. After the incubation, 400 μl of medium was removed and 500 μl of 4% paraformaldehyde solution was added and incubated for 20 min at room temperature. After fixation, paraformaldehyde was removed and spheroids were washed twice with PBS. The Shandon Immuno-Mount (ThermoFisher Scientific) was used to mount the spheroids onto microscope cover slides (Fisher Scientific). An Olympus BX60 fluorescence microscope was used to image the MitoTracker fluorescence and processed with Image-pro Plus 7.0 (Media Cybernetics). The fluorescence was quantified using ImageJ software from NIH (https://imagej.nih.gov/ij/) and normalized to the size of the aggregates. To determine statistical significance, one-way ANOVA was performed with post-hoc Bonferroni test. All data given are the means ± SD of three to seven independent experiments performed with 5 technical replicates.
2.7. Reactive oxygen species measurement
Reactive oxygen species (ROS) were measured in cell media collected after 30 min, 1, 12, 24 and 48 h of treatment with rotenone using the OxiSelect™ In Vitro ROS/RNS Assay Kit (Cell Biolabs). This fluorescence-based assay measures the total free radical presence in a sample. The quenched fluorogenic dye dichlorodihydrofluorescein-DiOxyQ (DCFH-DiOxyQ), which is similar to the popular 2′,7′- di-chlorodihydrofluorescein diacetate (DCFH-DA), is first primed with a quench removal reagent. The resulting highly reactive non-fluorescent DCFH can react with the ROS species present in the cell supernatant and is oxidized to the highly fluorescent DCF (2′,7′-dichlorodihydroxy-fluorescein). For every test condition, 50ul of the medium supernatant was added to a 96-well-plate in triplicates and incubated with the DCFH-DiOxyQ for 45 min. The fluorescence intensity was measured with a fluorescence microplate reader and is proportional to the total ROS/RNS levels within the sample. To determine statistical significance, one-way ANOVA was performed with post-hoc Bonferroni test. All data are given as means ± SD of three to seven independent experiments performed with 3 technical replicates.
2.8. RNA extraction
Total RNA of BrainSpheres was collected every week for up to 8 weeks of differentiation. In addition, spheroids exposed for 2, 4 and 8 weeks to 1 μM and 5 μM rotenone for 24 and 48 h, were collected in the same way. Total RNA was extracted according to Chomczynski and Sacchi’s method (Chomczynski and Sacchi, 1987; Chomczynski and Sacchi, 2006). RNA quantity and quality was determined using Nano-Drop 2000c (ThermoFisher Scientific). One microgram of RNA was reverse-transcribed using the M-MLV Reverse Transcriptase (Promega) and Random hexamer primers according to the manufacturer’s recommendations. For cDNA transcription, a TC312 thermocycler (Techne) were used. The resulting cDNA was used to perform quantitative RT-PCR using a 7500 Fast Real-Time System machine (Applied Biosystems).
2.9. Quantitative RT-PCR
The expression of the genes was assayed using specific Taqman® gene expression assays (ThermoFisher Scientific) and designed to yield products spanning exon–intron boundaries to prevent possible detection of genomic DNA contaminations after total RNA isolation. Table 2 shows the genes assayed. Fold-changes were calculated using the 2−ΔΔCt method (Livak and Schmittgen, 2001). β-ACTIN and 18s RNA were used as housekeeping controls. There were no statistically significant differences in expression of β-ACTIN and 18S over the course of differentiation.
Table 2.
Taqman gene probes.
| Gene | Reference |
|---|---|
| PLXNA4 | Hs00297356 |
| NR4A2 | Hs01117527 |
| LHX1 | Hs00232144 |
| FGF14 | Hs00738588 |
| DCX | Hs00167057 |
| ATP6V1G2 | Hs00431046 |
2.10. Transcriptomic analyses
The data set analysis was performed in two settings: Firstly, rote-none effect on transcriptome at 2, 4 and 8 weeks of differentiation was analyzed. For this experiment, BrainSpheres were treated with 5 μM rotenone for 24 h and compared to vehicle-treated controls. Secondly, transcriptome changes during the course of differentiation were studied in order to characterize the BrainSpherods. For this analysis, RNA samples from NPC were compared to 2, 4 and 8 weeks vehicle-treated control samples from the first experiment. Microarray analysis was conducted at The Johns Hopkins Bloomberg School of Public Health Genomic Analysis and Sequencing Core Facility. RNA was extracted from source cells using the mirVana miRNA Isolation kit (Ambion/Thermo Fisher) according to the manufacturer’s protocol. Following elution of purified RNA from the mirVana miRNA columns with Nuclease-free water with RNasin, quantitation was performed using a NanoDrop spectrophotometer and quality assessment determined by RNA LabChip analysis on an Agilent BioAnalyzer 2100 or RNA Screen tape on an Agilent TapeStation 2200. 25 ng of total RNA was processed for hybridization to Agilent SurePrint G3 Human Gene Expression v2 8x60K Arrays according to Agilent’s Gene Expression FFPE Workflow protocol, including whole transcriptome amplification, SureTag DNA labeling and purification, fragmentation, hybridization, and washing. The arrays were scanned in the Agilent G2600D SureScan Microarray Scanner using scan protocol AgilentG3_GX_1color. Agilent’s Feature Extraction Software was used to assign grids, provide raw image files per array, and generate QC metric reports from the microarray scan data. The QC metric reports were used for quality assessment of all hybridizations and scans. Txt files from Feature Extraction Software were exported for further analysis with Partek GenomicsSuite version 6.6. Data analyses were done using R (https://www.r-project.org, version 3.4.1 unless stated otherwise). Data on the green channel were read using limma (Bioconductor, version 3.37.7) and background was corrected using the normexp method with an offset of 30. Between-arrays normalization was done by quantile normalization and within-array replicated spots were averaged. A non-specific gene expression filtering was applied, selecting for at least 10 samples exceeding a log2 expression value of 6 (genefilter version 1.59.0). Differentially expressed genes after rotenone treatment were identified by comparing untreated and treated BrainSpheres, using limma and a False Discovery Rate (FDR) lower than or equal to 0.05. Venn diagrams were made with VennDiagram (CRAN, version 1.6.17). Differentially expressed genes between NPC and control BrainSpheres were also found using limma and a FDR ≤ 0.05. The Ensemble of Gene Set Enrichment Analyses (EGSEA) was performed with the EGSEA library (version 1.5.5). The genesets were made from single-cell RNA-Seq studies of human organoids derived from hiPSCs and from cells isolated from two human brain areas. The base methods used for geneset analysis were: camera, safe, gage, padog, plage, zscore, gsva, ssgsea, globaltest and fry. Heatmap of the significance score for the gene sets was made using the Ward’s D2 clustering and Euclidean distance (gplots, version 3.0.1). Time-series clustering of untreated BrainSpheres was performed using fuzzy c-means clustering with k = 3 clusters, the L2 distance and an auto-correlation up to the 50th lag (dtwclust, version 4.1.1). The NPC were considered as initial time-point of the time-series.
The single-cell RNA-Seq data analyses were performed as followed. Public data were obtained from six studies covering the human fetal temporal lobe, human fetal midbrain and human organoids at different days of differentiation (Darmanis et al., 2015; La Manno et al., 2016; Quadrato et al., 2017; Sloan et al., 2017; Xiang et al., 2017). Cells with > 5% of the reads mapping to mitochondrial genes, were removed. Normalization of the single cell datasets was performed as described previously (Zheng et al., 2017). In the Darmanis dataset, cells labelled as hybrid were also removed. The cell clusters reported in the papers were used to contrast the data and find differential expression of genes when considering a cell cluster and the rest of the described clusters. For the Darmanis and Sloan datasets, the log2 fold changes were calculated for the 1000 most highly variable genes (HVG). For the Birey, Quadrato and Xiang datasets, a graph network of the 30 nearest neighors was created using Minkowski’s metric and communities of cells were identified with the Louvain method (PhenoGraph version 1.5.2 running in the Python 3.6.1 language) (Levine et al., 2015). Log2- fold changes of gene expression between a community and the rest of the communities were calculated using limma. Genesets enriched of cluster-specific or community-specific genes were obtained using a cutoff of at least 1 for the log2-fold change. For each Louvain community, a subset of 80 randomly selected cells was created when the number of cells in this community was higher than 80. Otherwise, the total number of cells in the community was considered for the limma calculation.
2.11. Metabolomics analysis
Sample preparation and LC-MS metabolomics analysis have been previously described (Krug et al., 2014). Briefly, two experiments with 4 technical replicates were performed. For each sample, 625 μl of media was added to 375 μl acetonitrile (ACN) resulting in a 40% acetonitrile solution. Samples were centrifuged at 14000 ×g for 10 min to precipitate the proteins. A volume of 250 μl of the supernatant was mixed with 250 μl of water and then added to a 3 kDa molecular weight cut-off filter spin column (Microcon YM-3 Centrifugal Filter, Millipore, Billerica, MA). After filtering, samples were dried with a vacuum evaporation system overnight. The dried samples were reconstituted in 100 μl of 60% methanol with 0.1% formic acid and clarified by centrifugation at 14000 ×g for 5 min. The cleared samples were transferred to plastic vials for LC-MS measurements (Krug et al., 2014). For analysis, a 6520 Q-TOF LC-MS (Agilent) was operated in both positive and negative electrospray ionization (ESI) modes using a scan range of 50–1250 m/z. The instrument settings were as follows: gas temperature, 325 °C; drying gas, 10 l/min; nebulizer pressure, 45 psig; capillary voltage, 4000 V; fragmentor, 140 V; skimmer, 65 V; acquisition rate, 1.5 spectra/s; Spectra were internally mass-calibrated in real-time by continuous infusion of a reference mass solution using an isocratic pump connected to a dual sprayer feeding into an electrospray ionization source. Data were acquired with MassHunter Acquisition software (Agilent). Data analysis of Fig. 6D was performed with Ingenuity Pathway Analysis (QIAGEN Bioinformatics). Targeted LC-MS analysis were performed on an Agilent 6490 triple quadropole LC-MS system with iFunnel and Jet-Stream® technology (Agilent) equipped with an Agilent 1260 infinity pump and autosampler. Metabolites of interest were analyzed by multiple reaction monitoring (MRM) experiments operated in positive and negative switching mode. Compound identity was confirmed by comparison to the retention times of pure standards. The optimized operating conditions for MRM experiments were: gas temperature 230 °C; gas flow 15 l/min; nebulizer pressure 40 psi; sheath gas temperature 350 °C and sheath gas flow 12 l/min. Capillary voltages were optimized to 2500 V with nozzle voltages of 1500 V in positive mode, and 4000 V with nozzle voltages of 2000 V in negative mode. All data processing was performed with Agilent Mass Hunter Quantitative Analysis software package.
Fig. 6.
EGSEA comparison between different organotypic models. (A) Heatmap of EGSEA using genes found to be differentially expressed after rotenone treatment at the three time points and with the single-cell RNA-Seq derived gene sets. The significance score (from 0 to 100) is shown for each geneset, using a color palette from green to red. The geneset associated with the highest overall score across the three time-points is sloan_130days_1. (B) Log2 fold changes for the genes found in the sloan_130days_1 geneset are represented for the three time-points, with blue corresponding to down-regulated genes after rotenone treatment, and red color used for up-regulated genes. The most down-regulated gene at all time-points was NR4A2, an important transcription factor implicated in the differentiation of dopaminergic neurons. (For interpretation of the references to color in this figure legend, the reader is referred to the web version of this article.)
3. Results
3.1. BrainSpheres show maturation of the neuronal and glial populations over 8 weeks of differentiation
The process of maturation, cellular composition, and characterization of the BrainSpheres as well as its reproducibility has been described in previous work (Pamies et al., 2017). Briefly, the expression of different markers for CNS cell populations was assessed during the BrainSpheres differentiation process for up to 8 weeks of in vitro development using immunohistochemistry, flow cytometry, gene expression and ultrastructure were assessed by electron microscopy; this analysis demonstrated the presence of neurons, astrocytes and oligodendrocytes in the model. Moreover, there is an increased expression of mature neuronal and glial markers with increasing differentiation time, recapitulating key aspects of human brain development. At 8 weeks of in vitro differentiation, BrainSpheres showed positive immunoreactivity for mature neuronal markers (NF200, βIII-tubulin and MAP2), astrocytic marker GFAP and oligodendrocyte marker O1 (Fig. 1). Neuronal populations in the model (dopaminergic, glutamatergic and GABAergic neurons) demonstrated dendritic and axonal processes with evidence of functional neuron-neuron and neuron-glial interactions. GFAP+ astroglial cells in the model formed complex networks of processes as they do in the normal human brain (Fig. 1e, f, k, i) and O1+ oligodendrocytes (Fig. 1a, b, c, d) presented a similar morphology to normal brain oligodendroglia, presenting as round cells with abundant cytoplasmic processes in close contact with axons and expression of myelin proteins like MBP (Fig. 1g, h).
Fig. 1.
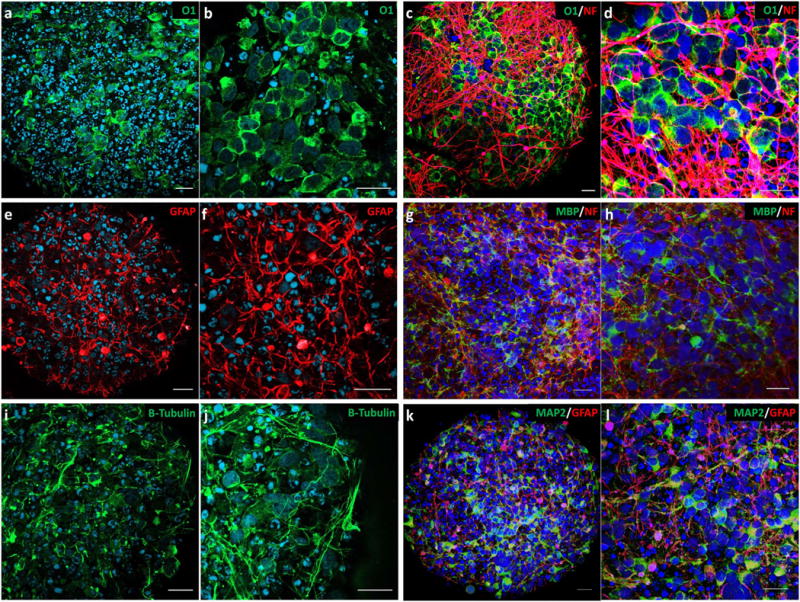
Human iPSC-derived BrainSpheres. At 8 weeks of differentiation, mature BrainSpheres contain a diversity of neuronal and glial cell populations as shown by the expression of neuronal and glial markers by immunofluorescence. Glial cell populations include O1+ oligodendrocytes (a, b) that are in close interaction with NF+ axonal processes (c, d) and GFAP+ astrocytes (e, f). Oligodendroglia also exhibited expression of Myelin Basic Protein (MBP) in association with axonal processes (g, h). Neuron populations express specific markers such as TUBB3 and MAP2 (i–l) and seem to be mixed among GFAP+ astroglia (k, l). Scale Bar: 20 μm.
3.2. Transcriptome analyses of BrainSpheres reveal features of human brain cell populations
To determine if BrainSpheres show features of human brain cells, bioinformatics data analyses were performed. Differential gene expression analyses were made between the Neural Progenitor Cells (NPC) (considered as starting point of differentiation) and each of the three time-points (2 weeks, 4 weeks and 8 weeks after starting the process of differentiation in 3D) using microarrays. A total of 1597 genes (FDR ≤ 0.05, limma test) were found to be differentially expressed at all the three time-points using microarrays (Fig. 2C). The total number of differentially expressed genes in comparison to NPC increased with the weeks of differentiation (genes 2 weeks < genes at 4 weeks < genes at 8 weeks) and the overlap between 2 and 4 weeks was lower than was found between 4 and 8 weeks (1783 vs 2478 genes, Fig. 2C). This suggest the presence of core genes changed at any time of differentiation but also the appearance of additional gene expression changes specific to later time-points.
Fig. 2.
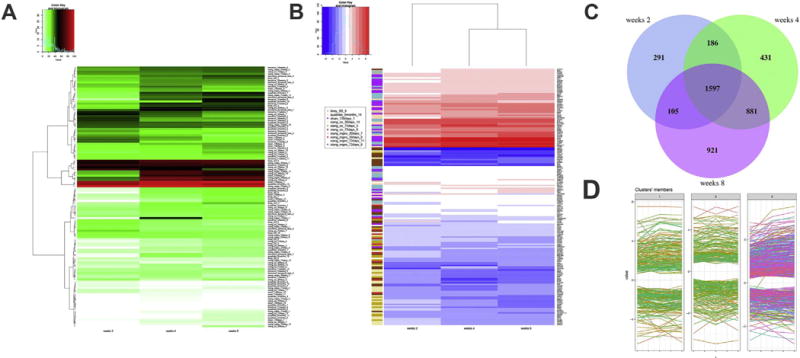
Transcriptome analyses of BrainSpheres. Transcriptomic data were obtained from NPCs, 2, 4 and 8 weeks differentiated BrainSpheres. A) Heatmap of EGSEA of 123 gene sets obtained from single-cell RNA-Seq datasets showed high scores at the three time-points for xiang_mgeo_72days_8, quadrato_6months_14 and sloan_130days_1. The colors represent the significance score (green for low significance to red for high significance) B) Heatmap of log2 fold-changes for the genes present in ten significant gene sets. Vertical ribbon shows the gene sets for each of the genes shown at the right side of the heatmap. Blue color in the heatmap corresponds to down-regulated genes when comparing the time-points to NPC, while red color is used for up-regulated genes (potential cell markers). C) Three-ways Venn diagram of 2 vs 4 vs 8 weeks of genes significantly changed after BrainSpheres differentiation (limma test, FDR ≤ 0.05). D) Fuzzy clustering using k = 3 number of clusters for the 1597 core genes found at the intersection of the Venn diagram in C. (For interpretation of the references to color in this figure legend, the reader is referred to the web version of this article.)
We focused on the 1597 core genes and performed a fuzzy clustering using k = 3 number of clusters (Fig. 2D). The cluster 1 contains genes up- or down-regulated and showing a flat profile between two time-points. It also contains genes showing a flat profile between any two time-points. The cluster 2 represents genes showing a V or inverted V shape profile. The cluster 3 is made of genes that were progressively up-or down-regulated during the progress of differentiation, with the up-regulated ones that are most likely corresponding to markers of cellular maturation. The list of the 509 genes present in cluster 3 (FDR ≤ 0.05, limma test) can be found in Supplementary Table 1 and includes 347 up- and 162 down-regulated genes. Among the up-regulated markers, general neuronal markers were found (MAPT, TMEM130, GAP43, STMN2, CHL1). In addition, well-known neuronal markers that are more specific were also revealed: ACHE, GRIA2, GAD1, SCG2, KCND3, KCNB2, GLRA2, CNR1, CHGA and OPRM1. As previously observed (Sloan et al., 2017), the presence of superficial-layer neurons is highly suggested by the up-regulation of CUX2, a gene found in upper layers II-IV of the cortex (Nieto et al., 2004). Apart from neuronal genes, we also observed the up-regulation of myelin genes such as NKX2-2 and PMP2.
We leveraged the recently available single-cell RNA-Seq data made in six different studies, including four on human brain organoids derived from human IPSCs and two on human fetal brain cells isolated from the temporal cortex and midbrain regions (Supplementary Table 2). The single-cell RNA-Seq data from these studies represent an invaluable source to define gene sets made of enriched/specific markers of cells found in these organoids and in the two surveyed brain areas. EGSEA (Alhamdoosh et al., 2017) was used to find the closest matches to the differentially expressed genes found in BrainSpheres at the three time-points, using a significance score (from zero to 100, with zero being the least significant and 100 representing the most significant gene sets. Heatmap of EGSEA for 123 gene sets obtained from the single-cell RNA-Seq datasets showed high scores at the three time-points for the three following gene sets: xiang_mgeo_72days_8 (minimum score = 97, p.adj = 2e-20), quadrato_6months_14 (minimum score = 87, p.adj = 2e-14, and sloan_130days_1 (minimum score = 88, p.adj = 2e-20) (Fig. 2A). We further selected gene sets showing at least a significance score of 65 at any of the three time-points, adding seven gene sets to the previously found ones. The heatmap of log2-fold changes for the genes present in the ten resulting gene sets are depicted in Fig. 2B. This EGSEA was not restricted to the 1597 core genes, however, it retrieved some of the previously described up-regulated neuronal genes such as GRIA2, MAPT and STMN2. Of high interest, an additional up-regulated gene found by EGSEA is NR4A2, a nuclear orphan receptor controlling the terminal differentiation of mesencephalic dopaminergic neurons (Caiazzo et al., 2011). Among down-regulated genes, classical markers of proliferation such as TOP2A and MKI67 were observed together with genes involved in modelling the extracellular matrix (MMP2, HMMR, BGN and DCN). Together, the transcriptomic analyses support the presence of diverse neuronal populations including dopaminergic neurons, that are engaged in an ongoing differentiation program, mimicking some aspects of human brain maturation.
3.3. BrainSpheres showed higher sensitivity to rotenone at early stages of differentiation
BrainSpheres were exposed to rotenone for 24 and 48 h at 2, 4 and 8 weeks of differentiation process. Concentrations between 0.1 μM and 50 μM were used. At 2 weeks of differentiation, exposure of BrainSpheres to rotenone for 24 h showed a 26% reduction in cell viability at 10 μM, with the maximum reduction of 58% at 50 μM. After 48 h exposure at 2 weeks, a higher reduction of cell viability was found but not statistically significant, with 61% of reduction for 50 μM (Fig. 3A, left graph). BrainSpheres exposed 24 and 48 h to different concentrations of rotenone at 4 weeks of differentiation presented less sensitivity to the compound (Fig. 3A, middle graph). Exposure to the higher concentration (50 μM) reduced cell viability by 33%, which was 25% less than for 2-week BrainSpheres. However, at 25 μM, there were no differences in cell viability between 2- and 4-weeks BrainSpheres. The exposure of BrainSpheres to rotenone for 48 h at 4 weeks of differentiation showed a decrease in number of viable cells, however, the change was not statistically significant. No significant differences were found between 4 and 8 weeks (Fig. 3A). At all 3 time points studied, concentrations of 0.1, 1 and 5 μM rotenone did not show statistically significant changes in cell viability (Fig. 3A).
Fig. 3.
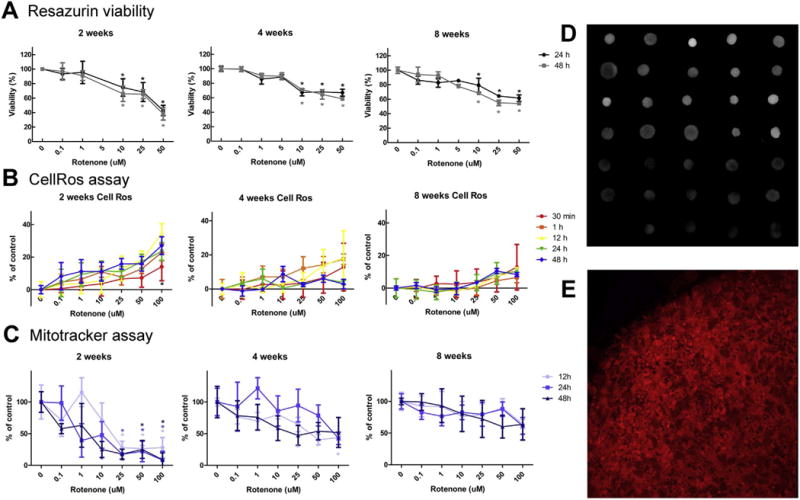
Rotenone produces different effects at different windows of exposure and preferentially affects dopaminergic neurons in BrainSpheres. Cells were exposed to different concentrations of rotenone for up to 48 h at 2, 4 and 8 weeks of differentiation. (A) shows cell viability at different concentrations of rotenone after 24 and 48 h exposure. (B) Reactive oxygen species (ROS) production after 0.5, 1, 12, 24 and 48 h exposure to different concentrations of rotenone. (C) Mitochondrial dysfunction after 12, 24 and 48 h rotenone exposure. D) Selected MitoTracker images. E) confocal image of a MitroTracker stained BrainSpheres.
3.4. BrainSpheres in the early stages of differentiation show higher levels of oxidative stress when exposed to rotenone
Two weeks BrainSpheres have shown an increase of reactive oxygen species (ROS) production over the time of rotenone exposure (30 min, 1, 12, 24 and 28 h). Exposure to higher concentration of rotenone (100 μM) increased ROS production for 14, 23, 35, 23 and 27% after 30 min, 1, 12, 24 and 48 h, respectively (Fig. 3B). Four-weeks Brain-Spheres exposed to rotenone have shown a dose-dependent increase of ROS at 30 min, 1 and 12 h, reaching a maximum μM of 13, 17 and 18% respectively. After 12 h, ROS level was reduced. After 24 h, the exposure resulted in an increase of ROS production between 0 and 5% in comparison to the control. Similar results were found after 48 h exposure (Fig. 3B). At 8 weeks, a maximum of 11% increase in ROS production was observed. A maturation of the system at that stage, with more mature astrocytes and oligodendrocytes, can be a reason for the reduction of ROS after rotenone exposure. Similarly, to the mitochondrial dysfunction experiment, BrainSpheres have shown an age-dependent sensitivity, showing higher oxidative stress in the early stages of differentiation.
3.5. Rotenone induces mitochondrial dysfunction dependent of BrainSpheres maturation
MitoTracker Red CMXRos was used to measure mitochondrial dysfunction in BrainSpheres after rotenone exposure. BrainSpheres of 2, 4 and 8 weeks of differentiation were exposed to different concentrations of rotenone (0, 0.1, 1, 10, 25, 50, 100 μM) for 0.5, 1, 12, 24 and 48 h (Fig. 3C). MitoTracker results obtained after 30 min and 1 h exposure were variable (data not shown). The overall tendency was a reduction of the mitochondrial function after rotenone exposure in a dose-dependent manner. However, only the effects of the higher concentrations were statistically significant. At 2 weeks, exposure of BrainSpheres to 25, 50 and 100 μM rotenone for 12 and 24 h led to a significant mitochondrial dysfunction (Fig. 3C). Moreover, exposure to the highest concentration (100 μM) showed a much higher decrease for 24 and 48 h exposure. As expected, 2-week BrainSpheres exposed for 48 h to rote-none, were more affected than the same age BrainSpheres treated for 12 and 24 h, showing effects already at 10 μM. No effects were observed at this concentration after shorter exposure time. Exposure to 100 μM rotenone for 12, 24 and 48 h reduced mitochondria function by 72%, 92% and 91%, respectively, (Fig. 3C). At 4 weeks, only 12 h exposure showed statistically significant differences at the three highest concentrations (25, 50 and 100 μM), while 24 and 48 h exposure did not show any statistically significant changes. At 8 weeks, the graph showed a tendency of reduced mitochondrial function, but the values were not statistically significant compared to the control cells. The results show that sensitivity of BrainSpheres to rotenone was age-dependent, being more sensitive at early stages of differentiation and less sensitive when more mature cells were present in the system.
3.6. Rotenone selectively disrupts dopaminergic neurons and may produce astrocyte toxicity
Exposure to non-cytotoxic concentration of rotenone (1 and 0.1 μM) induced selective toxicity on TH-positive cells (Fig. 4), while other neuronal cell types required concentrations > 25 μM, to present changes in cell morphology and viabilty. Immunostaining demonstrated a significant decrease in the number of TH-positive dopaminergic cells in the BrainSpheres treated with 1 μM rotenone, with the overall MAP2+ neuronal population demonstrating less abundant dendritic process and a decrease in the number of cells at concentrations > 25 μM. Similarly, GFAP-positive astrocytes were affected at rotenone concentrations > 25 μM, with initial decrease in the number of glial processes and network formation and subsequent decrease in the amount of GFAP-positive cells at higher concentrations (Fig. 4). However, this concentration presented general cytotoxicity in the resazurin assay Fig. 3A.
Fig. 4.
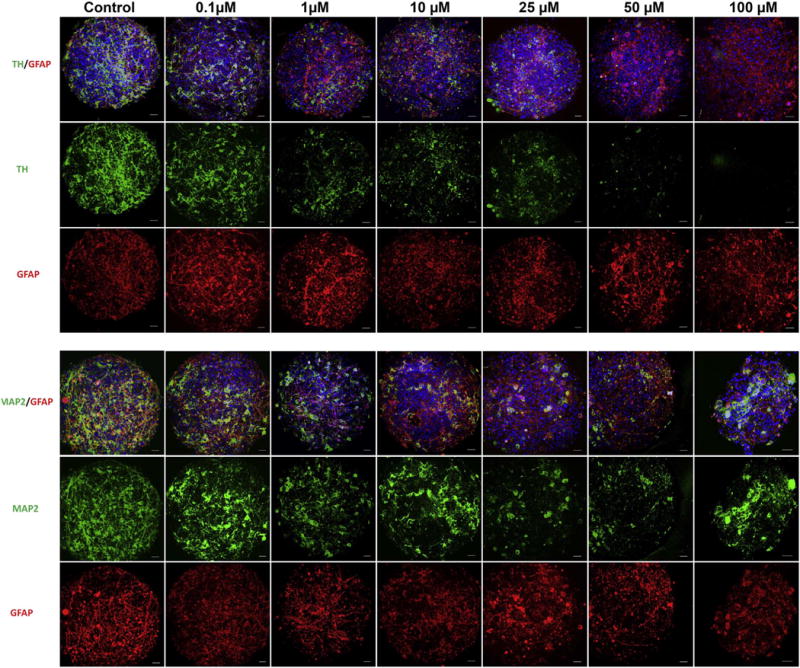
Immunohistochemistry of rotenone treated Human iPSC-derived BrainSpheres. BrainSpheres were collected after 8 weeks of differentiation and exposed to rotenone for 24 h. Confocal images were taken for neuronal (MAP2), astrocytic (GFAP) and dopaminergic neuronal (TH) cell populations in BrainSpheres exposed to increasing concentrations of rotenone. There was a progressive decrease in the overall neuronal population that appeared to be dopaminergic specific, as TH+ neurons were differentially affected with a relative preservation of MAP2+ neurons and GFAP+ astrocytes. Scale bar: 20 μm.
3.7. Rotenone alters the transcriptional profile of BrainSpheres at all stages of differentiation
BrainSpheres were exposed to 5 μM rotenone for 24 and 48 h at 2, 4 and 8 weeks of differentiation and microarrays were done to assess the effect of rotenone on the trascriptome by comparing treated and untreated BrainSpheres. The number of genes changed by the treatment increased depending on the differentiation status of the BrainSpheres (Fig. 5A). A total of 72 altered genes were found in the 2-week cultures (limma test, FDR ≤ 0.05), while 343 were changed in the 4-week BrainSpheres and 429 in the 8-week condition. The overlap between the three time-points was made of only 23 genes, suggesting distinct responses of different weeks-old BrainSpheres to rotenone.
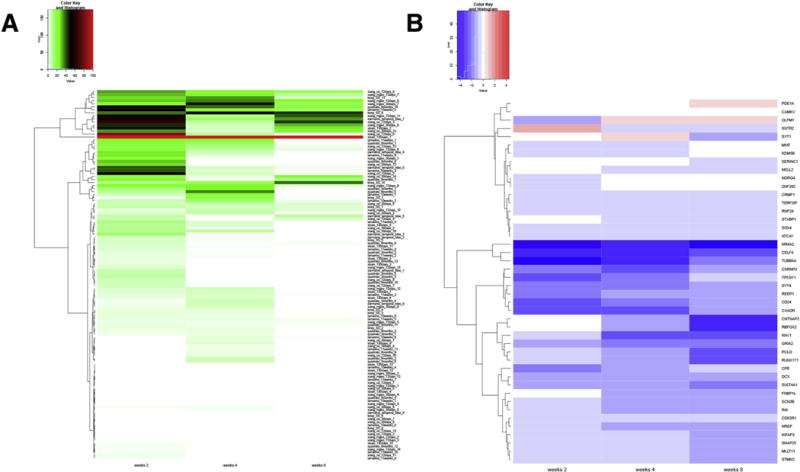
Fig. 5.
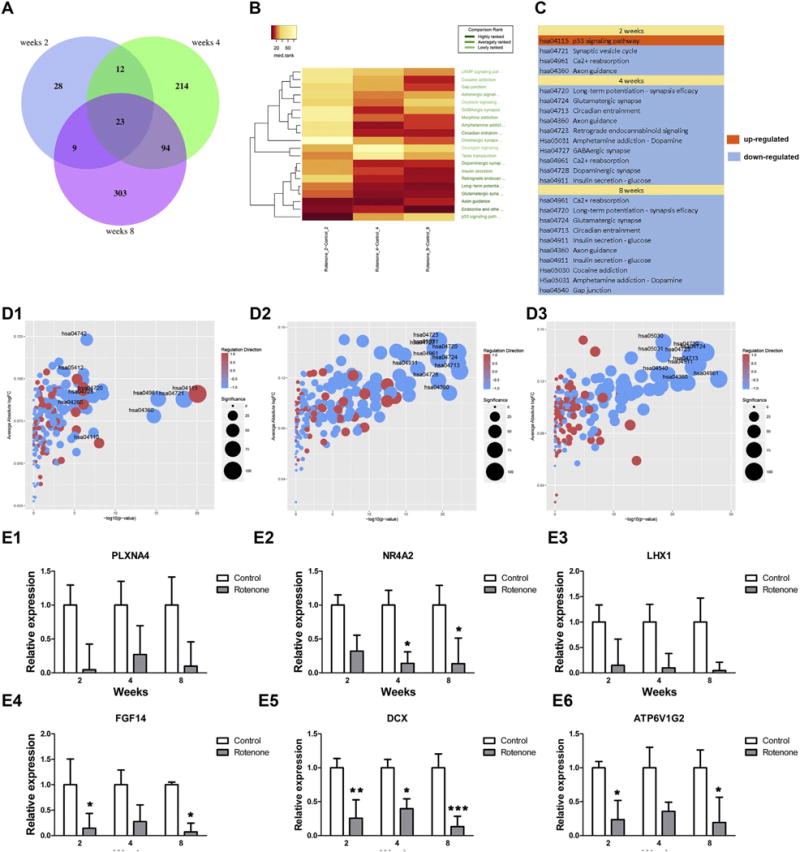
Transcriptomic analyses of rotenone effect on Kyoto of Encyclopedia of Genes and Genomes (KEGG) pathways. (A) Venn diagram of differentially expressed genes after 5 μM rotenone treatment of 2, 4 and 8 weeks BrainSpheres. The number of genes altered by chemical treatment increased over time and profiles were more similar between 4 and 8 weeks, than when compared to 2 weeks. (B) Heatmap of median rank for the significant KEGG pathways. The analysis was performed after exposure of 2, 4 and 8 weeks differentiated BrainSpheres to rotenone. The pattern at 2 weeks was more different than what was observed at 4 and 8 weeks. (C) shows the direction of the overall change for the significant pathways at the three time-points. There was only one up-regulated pathway (p53 signaling pathway shown in orange) and the rest corresponded to down-regulated pathways (shown in blue). (D) Bubble plots of the significance of the KEGG pathways at 2 weeks (D1), 4 weeks (D2) and 8 weeks (D3). The upper right corners of the plots contain bubbles corresponding to pathways with a strong directional change and high −log10 p-value. All the significant pathways were down-regulated (colored in blue), expect the p53 signaling pathway (hsa04115) in D1. (E) shows real-time qPCR validation for six genes found to be altered by microarrays, including NR4A2 (E2), LHX1 (E3) and DCX (E5). Results represent mean ± SD (n = 3). Asterisks indicate p-values from two-way ANOVA multiple comparison (p < 0.01 = *; p < 0.001 = **; p < 0.0001 = ***). (For interpretation of the references to color in this figure legend, the reader is referred to the web version of this article.)
EGSEA was performed to find KEGG pathways changed after rote-none treatment. A summary of the significant pathways is shown in Fig. 5B and C. Of interest, the p53 signaling pathway was with a low median rank (Fig. 5B) and the only up-regulated KEGG pathway at 2 weeks. This is in agreement with a previous study showing a positive feedback loop of p53 on amplifying apoptosis (Shi et al., 2014), immature cells in the BrainSpheres at 2 weeks may show a similar mechanism. Bubble diagrams showed that the most significantly down-regulated KEGG pathways after rotenone treatment at week 4 and 8 were related to synapse function (Fig. 5B, 5D2 and 5D3). In the three exposure time windows, synapse pathways such as hsa0721 Synaptic vesicle cycle (at 2 weeks), hsa04724 glutamatergic synapse, hsa04727 GABAergic synapse and hsa04728 dopaminergic synapse (at 4 and 8 weeks) were found modified after rotenone exposure at later time-points (4 and 8 weeks). The Calcium Reabsorption pathway was another KEGG pathway down-regulated in the three groups. Overall, these results suggest that rotenone can target different cell populations over time, with 2-week BrainSpheres being more sensitive to apoptosis as shown by upregulation of p53 and neuronal populations affected throughout BrainSphere development.
To identify which neural populations were affected by rotenone, EGSEA was performed with the single-cell RNA-Seq gene sets and the list of genes affected by rotenone treatment at the three time-points (Fig. 6A). Of high interest, the sloan_130days_1 geneset showed a high significance score at all three time-points (minimum score = 100, p.adj = 5.8e-17), suggesting a persistent effect of rotenone on some cells types present in the BrainSpheres. The geneset contains neuronal markers, suggesting that the main targeted cell types of rotenone are neurons. A profoundly down-regulated gene found at all time-points in the geneset was NR4A2, an important player of mesencephalic dopaminergic neurons (Fig. 6B). This strongly supports the well-known high sensitivity of dopaminergic neurons to rotenone. In addition, other specific neuronal markers were altered, for instance, we observed up-regulation of SSTR2 at 2 weeks, up-regulation of OLFM1 at 4 and 8 weeks, and up-regulation of PDE1A at 8 weeks. Together with the down-regulation of CNTNAP2, a neuronal gene involved in complex neurological disorders such as autism and schizophrenia (Brumback et al., 2017), the EGSEA results strongly supports the existence of multiple effects of rotenone on diverse neuronal populations present during the course of BrainSpheres maturation, with a more pronounced effect on dopaminergic neurons.
Real-time PCR was performed on selected genes found to be affected by rotenone at the three time points to confirm microarray data (Fig. 5E). The RT-PCR results for the six tested genes confirmed what was found previously by microarrays, i.e. down-regulation of those genes. For instance, DCX, a marker of young neurons, was significantly down-regulated. Of importance, NR4A2 was affected by rotenone treatment, with 4-weeks and 8-weeks differentiation being significant (two-way ANOVA multiple comparison). In addition, another gene important for dopaminergic neurons, LHX1, was also affected by the chemical, further confirming that BrainSpheres are suited for evaluating the effects of rotenone on young neuronal cells and more mature neurons such as dopaminergic neurons.
3.8. Extracellular metabolites can help to identify neurotoxic effects
Extracellular metabolites from BrainSpheres were studied at 2, 4, and 8 weeks of differentiation. Both targeted and untargeted approaches were performed. PCA plots were created from the untargeted metabolomics data, showing clear differences in metabolic profiles between different stages of differentiation (Fig. 7A). In addition, BrainSpheres treated with rotenone for 48 h changed the extracellular metabolites profile (Fig. 6B). After non-cytotoxic rotenone treatment, the number of modified metabolites was similar between 2, 4 and 8 weeks of differentiation, with 163 metabolites in common for the three time points (Fig. 7C). Data analysis performed with Ingenuity Pathway Analysis (QIAGEN Bioinformatics) revealed the TOP TOX modified pathways common for the 3 time points: mitochondrial dysfunction, PXR/RXR activation, mechanism of gene regulation by peroxisomes proliferation via PPAR (Fig. 7D). Analysis for physiological system development and function shows nervous system development and function pathway altered at the 3 time points. In the case of diseases and disorders pathway analysis, neurological disorder pathway was altered at 2 weeks, while cancer was the main pathway altered at 4 and 8 weeks. A targeted metabolomics approach was used to confirm extracellular metabolites data (Fig. 7E).
Fig. 7.
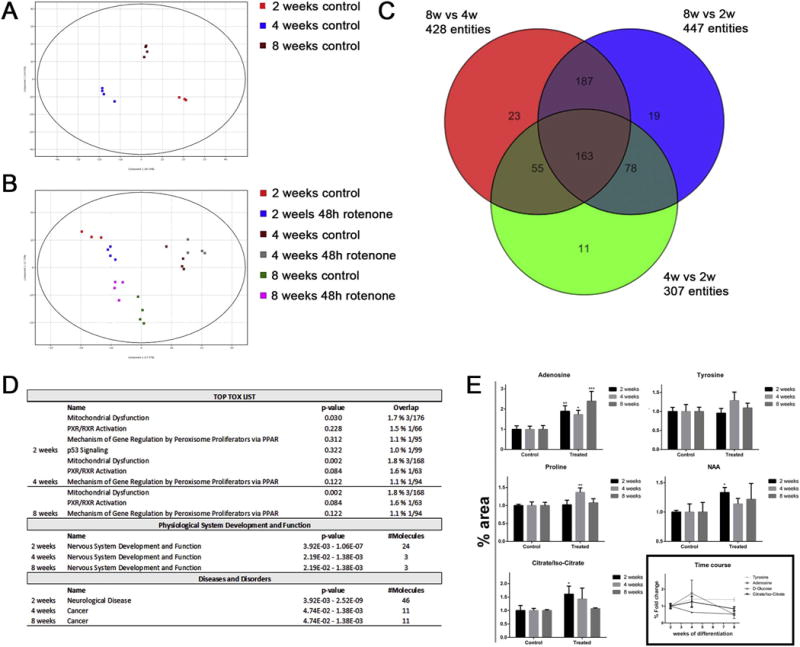
Alteration in extracellular metabolite levels after treatment of BrainSpheres with 5 μM rotenone. Extracellular metabolites were extracted from the media after 48 h rotenone treatment at 2, 4 and 8 weeks differentiation of BrainSpheres. A) PCA plot showing the profile differences between 2, 4 and 8 weeks control (untreated) BrainSpheres. B) PCA plot including data for 48 h rotenone treatment. C) Venn diagram showing the number of significantly changed extracellular metabolites at 2w vs 4w vs 8w. D) Ingenuity top tox list pathways, physiological system development and function pathways and disease and disorders pathways modified after rotenone exposure at different time points. E) Data for targeted metabolomics analysis of some metabolites, as a validation of untargeted results. Bars in 6E represent mean ± SD (n = 3). Asterisks indicate p-values from two-way ANOVA multiple test (p < 0.01 = *; p < 0.001 = **: p < 0.0001 = ***).
4. Discussion
In recent years, numerous models have been created in order to study the human brain in a more physiological way (Lancaster et al., 2013; Pasca et al., 2015; Quadrato et al., 2017; Sloan et al., 2017; Xiang et al., 2017). The main limitation of these models in the field of toxicology is that, due to their complexity, it is difficult to find a compromise between biological complexity and technical reproducibility. We have previously reported a reproducible brain human 3D model (Pamies et al., 2017). These models have been referred to as organotypic cultures or organoids; others have used terms like brain-on-chip, neurospheres, brain microphysiological systems or mini-brains. We decided to call our model BrainSpheres as it lacks the microfluidics of an organ-on-chip model and the architecture of an organ model; however, it represents some brain multicellularity including glial cells and functionality, exceeding those of mere neuronal models. Transcriptomics results here show certain similarities of our BrainSphere model with single-cell RNA-Seq data obtained in other human brain organotypic models (Fig. 2). Moreover, our transcriptomic analyses further confirmed the presence of proliferative immature cells at early time-points, and the existence of diverse neuronal populations and glial cells at later time-points in our BrainSpheres, therefore, reproducing some aspects of human brain maturation (Fig. 2). The genetic information collected during this study will facilitate the characterization of every cell type present in the BrainSpheres, pointing to the precise populations affected by rotenone and to the mode of actions of this potential neurodevelopmental toxicant.
The controlled complex cascade of events during neural development together with the lack of CNS support cells in early stages make the developing brain the most vulnerable window of exposure to environmental exposures (Rice and Barone, 2000). As a dogma in reproductive toxicity, it is assumed that certain “windows of vulnerability” exist when the developing system is susceptible to chemical interference, and typically exposure over the entire development phase is performed (chronic exposure). In vitro models showing full maturation processes are impossible to reproduce, so this could be a technical obstacle for examining treatments covering the whole differentiation span. In addition, long-term toxicant treatments may lead to favor the differentiation towards a specific population or select resistant cell populations, resulting in measurements of cellular phenotypic changes rather than direct molecular initiating events or even secondary substance-unspecific effects (Balmer et al., 2014). This could make it difficult to interpret the results of long-term exposures treatments. However, an alternative to chronical exposure has been proposed (Balmer et al., 2014). Short “pulse” (acute) exposures at multiple times of the differentiation can be performed to describe toxicant effects on early cellular events. This will allow (i) assessment of early cellular responses to the treatment at most significant stages of differentiation, and (ii) avoidance of indirect substance effects.
In this study, we have used rotenone at different time points of BrainSpheres maturation in order to understand the potential neurodevelopmental effects of this pesticide. Rotenone is a natural pesticide widely used, besides to have a relatively short environmental half-life and limited bioavailability, there are evidences that even temporary limited exposure of rotenone could lead the effects in human health (Hatcher et al., 2008; Li et al., 2005; Tanner et al., 2011). Moreover, in vivo and in vitro studies have shown rotenone possible developmental neurotoxicity potential (Khera et al., 1982; Spencer and Sing, 1982; Melo et al., 2015; Krug et al., 2013). For this study, we used a range of concentrations based on published in vitro literature. EPA has determined that after chronic administration, the LOAEL for rats was 37.5 ppm (95.1 nM) (EPA, 2006a, 2006b). Therefore, and taking into consideration that we are using an acute exposure and not repeated dosing, we used 100 nm as starting concentration. Animal studies have shown rotenone was able to induce PD pathology when brain concentrations reach 30 nM (Greenamyre et al., 2003), however, this concentration did not show any changes in BrainSpheres after a single exposure. Cytotoxicity assays after rotenone treatment showed stronger effects of rotenone at 2 weeks of differentiation in comparison to 4 and 8 weeks (Fig. 3A). Rotenone is known to induce ROS production by inhibiting mitochondrial complex I. Our results have shown an increase of ROS production at the 3 time points studied (2, 4 and 8 weeks). The amount of ROS production due to rotenone treatment was higher at early stages of differentiation with progressive decrease in ROS production at 4 and 8 weeks (Fig. 3B). Moreover, mitochondrial function was more compromised at 2 weeks than at 4 and 8 weeks (Fig. 3C). Astrocytes haven shown to present a key role in maintaining the energetic balance of the brain and antioxidant production and contributes to neuronal protection (Dugan and Kim-Han, 2004; Greenamyre et al., 2003); being as well indications that astrocytes may have a protective role against rotenone (Cabezas et al., 2012). We hypothesize that the higher sensitivity at 2 weeks could be due to the lack of supporting cells during the early stages or an increased sensitivity of immature cell populations when compared to mature ones. According to our previous results, the expression of glial markers starts appearing around 2 weeks, increasing over time (Pamies et al., 2017). In addition, immunohistochemistry of GFAP-positive astrocytes at 8 weeks, showed how astrocytes develop more processes and establish glial-glial and neuroglial networks with increasing in vitro development time, which is important for neuronal support and viability. As seen in Fig. 4. Rotenone can also disrupt astrocyte networks and induce astrocyte death at higher concentrations (concentrations that were cytotoxic in the resazurin assay) (Fig. 3A). All these changes in the cellular composition are accompanied by a reduction of more immature cells such as cells expressing proliferative markers (MKI67 and TOP2A).
Studies with rotenone has previously shown indications that exposure to this pesticide produce effects on rat, chick and fish development (Khera et al., 1982; Spencer and Sing, 1982; Melo et al., 2015; Rao and Chauhan, 2004) as well as in vitro neurogenesis of iPSC-derived dopaminergic neurons (Fang et al., 2016) and neurite outgrowth (Krug et al., 2013). For example, D. rerio embryos exposed to rotenone showed embryotoxic effects, showing cardiac edema; tail deformities; loss of equilibrium; and a general delay characterized by lack of tail detachment, delayed somite formation, yolk sac absorption, and lack of pigmentation (Melo et al., 2015). In addition, Neonatal rotenone lesions derived into hyperactivity during juvenile stage in rats (Ishido et al., 2017). To try to identify developmental pathways modified metabolomics and transcriptomics was performed. In this study, Non-cytotoxic rotenone concentrations were used to obtain transcriptomics and metabolomics data, which showed the higher number of modified genes at 8 weeks vs 4 and 2 weeks (Fig. 5A). Pathways modified between 4 and 8 weeks were very similar for both transcriptomics and metabolomics (Figs. 5C and 7C). Metabolomics data have shown that metabolites related with nervous system development were altered at different time points (2, 4 and 8 weeks) and also showed a higher number of modified metabolites at 2 weeks (Fig. 7D). Down-regulation of the Calcium Re-absorption pathway was common to the three time points. This could affect the synaptic function, since Ca2+ is required in all the processes related to neurotransmitter release and absorption. The increase of intracellular Ca2+ levels after rotenone treatment has been already described (Swarnkar et al., 2012). This increase of Ca2+ seems to be related to the increased opening of voltage-gated Ca2+ channels (Wang and Xu, 2005). Our results show down-regulation of calcium re-absorption that may be due to a compensation mechanism. In addition, an increase in ROS production has been associated with high concentrations of intracellular Ca2+ (Boldyrev et al., 1999; Brookes et al., 2004). Thus, although dopaminergic neurons may go into apoptosis due to their higher sensitivity, mitochondrial complex I inhibition could lead to increased ROS production in other cell populations as well, increasing extracellular Ca2+ and further down-regulating synapse pathways.
The formation of axons and dendrites are required during the formation of the nervous system, and it has been suggested as one possible endpoint to study developmental neurotoxicants (Lein et al., 2007; Crofton et al., 2011; Bal-Price et al., 2012; Bal-Price et al., 2015a). Neurotoxic neurite impairment after rotenone exposure has been shown in many systems (Borland et al., 2008; Sanchez et al., 2008; Persson et al., 2013; Hoelting et al., 2016). Moreover, a recent study has shown how ten orders of magnitude lower than the cytotoxicity concentration of rotenone, can still produce effects on neurite outgrowth (Krug et al., 2013), suggesting that rotenone may also be an important developmental neurotoxicant. Axon guidance has been another pathway consistently down-regulated in all three groups (2, 4 and 8 weeks) (Fig. 5C) reinforcing previously described data (Krug et al., 2013). In addition, extracellular metabolite analysis in those three windows of exposure, suggests a mechanism of gene regulation by peroxisome proliferation via the PPAR pathway (Fig. 7D). There have been as well some indications relating this pathway with neurite outgrowth and mitochondrial function (Chiang et al., 2014). Being the main pathway using extracellular metabolites and being modified in the three groups (Fig. 6D). PPAR could be affected due to the inhibition of mitochondrial complex I and in turn, could affect the axonal growth pathway.
Calcium is a major modulator of neuronal functions (Berridge, 1998). The mitochondria’s role in Ca2+ homeostasis has been known for many years (Rizzuto et al., 2000; Clapham, 2007) and the mechanism has been summarized (Giorgi et al., 2012). The inhibition of mitochondrial complex I by rotenone have shown to produce swelling of mitochondria on dopaminergic neurons (Subramaniam and Chesselet, 2013); this phenomenon has been as well related with the increase of cytosolic Ca2+ (Subramaniam and Chesselet, 2013). The role for mitochondrial Ca2+ uptake is now well-recognized. Oxidative stress can alternate Ca2+ signals and induce organelle alterations when reaching the mitochondria, driving the cell to its death (Giorgi et al., 2008). Thus, an effect on mitochondrial complex I by rotenone could lead to a dysregulation of Ca2+, oxidative stress and to a further cell death or modification of the nervous system developmental pathways.
In conclusion, our BrainSpheres model has shown to be a reproducible and novel tool to study NT and DNT. The multicellular characteristics allow to study cell interaction and mechanisms in a more physiological manner as previous results have shown that our model better recapitulates human development (Pamies et al., 2017). Results presented here support the idea that rotenone can potentially be a developmental neurotoxicant, and show a possible link between previous detected effects (neurite outgrowth) and present effects observed such as induced abnormalities in Ca2+ reabsorption, synaptogenesis and the PPAR pathway.
Supplementary Material
Acknowledgments
Formatting of funding sources
This work was supported by NIH NCATS (grant U18TR000547 “A 3D Model of Human Brain Development for Studying Gene/Environment Interactions”, PI Hartung) and Alternatives Research & Development Foundation (“A 3D in vitro ‘mini-brain’ model to study Parkinson’s disease”, PI Hartung). We are grateful for additional financial support by Dorothy Frankel.
Footnotes
Supplementary data to this article can be found online at https://doi.org/10.1016/j.taap.2018.02.003.
Conflict of interest statement
David Pamies, Helena Hogberg and Thomas Hartung are named inventors of the Johns Hopkins pending patent application Compositions and Methods for Neuralgenesis and benefit from license fees. Thomas Hartung has recently created Organome LLC to make the BrainSpheres commercially available.
Transparency document
The http://dx.doi.org/10.1016/j.taap.2018.02.003 associated to this article can be found, in the online version.
References
- Alhamdoosh M, Ng M, Wilson NJ, Sheridan JM, Huynh H, Wilson MJ, Ritchie ME. Combining multiple tools outperforms individual methods in gene set enrichment analyses. Bioinformatics. 2017;33:414–424. doi: 10.1093/bioinformatics/btw623. [DOI] [PMC free article] [PubMed] [Google Scholar]
- Balmer NV, Klima S, Rempel E, Ivanova VN, Kolde R, Weng MK, Meganathan K, Henry M, Sachinidis A, Berthold MR, Hengstler JG, Rahnenfuhrer J, Waldmann T, Leist M. From transient transcriptome responses to disturbed neurodevelopment: role of histone acetylation and methylation as epigenetic switch between reversible and irreversible drug effects. Arch Toxicol. 2014;88:1451–1468. doi: 10.1007/s00204-014-1279-6. [DOI] [PMC free article] [PubMed] [Google Scholar]
- Bal-Price AK, Coecke S, Costa L, Crofton KM, Fritsche E, Goldberg A, Grandjean P, Lein PJ, Li A, Lucchini R, Mundy WR, Padilla S, Persico AM, Seiler AE, Kreysa J. Advancing the science of developmental neurotoxicity (DNT): testing for better safety evaluation. ALTEX. 2012;29:202–215. doi: 10.14573/altex.2012.2.202. [DOI] [PubMed] [Google Scholar]
- Bal-Price A, Crofton KM, Leist M, Allen S, Arand M, Buetler T, Delrue N, FitzGerald RE, Hartung T, Heinonen T, Hogberg H, Bennekou SH, Lichtensteiger W, Oggier D, Paparella M, Axelstad M, Piersma A, Rached E, Schilter B, Schmuck G, Stoppini L, Tongiorgi E, Tiramani M, Monnet-Tschudi F, Wilks MF, Ylikomi T, Fritsche E. International STakeholder NETwork (ISTNET): creating a developmental neurotoxicity (DNT) testing road map for regulatory purposes. Arch Toxicol. 2015a;89:269–287. doi: 10.1007/s00204-015-1464-2. [DOI] [PMC free article] [PubMed] [Google Scholar]
- Bal-Price A, Crofton KM, Sachana M, Shafer TJ, Behl M, Forsby A, Hargreaves A, Landesmann B, Lein PJ, Louisse J, Monnet-Tschudi F, Paini A, Rolaki A, Schrattenholz A, Sunol C, van Thriel C, Whelan M, Fritsche E. Putative adverse outcome pathways relevant to neurotoxicity. Crit Rev Toxicol. 2015b;45:83–91. doi: 10.3109/10408444.2014.981331. [DOI] [PMC free article] [PubMed] [Google Scholar]
- Berridge MJ. Neuronal calcium signaling. Neuron. 1998;21(1):13–26. doi: 10.1016/s0896-6273(00)80510-3. [DOI] [PubMed] [Google Scholar]
- Betarbet R, Sherer TB, MacKenzie G, Garcia-Osuna M, Panov AV, Greenamyre JT. Chronic systemic pesticide exposure reproduces features of Parkinson’s disease. Nat Neurosci. 2000;3:1301–1306. doi: 10.1038/81834. [DOI] [PubMed] [Google Scholar]
- Boldyrev AA, Carpenter DO, Huentelman MJ, Peters CM, Johnson P. Sources of reactive oxygen species production in excitotoxin- stimulated cerebellar granule cells. Biochem Biophys Res Commun. 1999;256:320–324. doi: 10.1006/bbrc.1999.0325. [DOI] [PubMed] [Google Scholar]
- Borland MK, Trimmer PA, Rubinstein JD, Keeney PM, Mohanakumar K, Liu L, Bennett JP., Jr Chronic, low-dose rotenone reproduces Lewy neurites found in early stages of Parkinson’s disease, reduces mitochondrial movement and slowly kills differentiated SH-SY5Y neural cells. Mol Neurodegener. 2008;3:21. doi: 10.1186/1750-1326-3-21. [DOI] [PMC free article] [PubMed] [Google Scholar]
- Brookes PS, Yoon Y, Robotham JL, Anders MW, Sheu SS. Calcium, ATP, and ROS: a mitochondrial love-hate triangle. Am J Phys Cell Physiol. 2004;287:C817–833. doi: 10.1152/ajpcell.00139.2004. [DOI] [PubMed] [Google Scholar]
- Brumback AC, Ellwood IT, Kjaerby C, Iafrati J, Robinson S, Lee AT, Patel T, Nagaraj S, Davatolhagh F, Sohal VS. Identifying specific prefrontal neurons that contribute to autism-associated abnormalities in physiology and social behavior. Mol Psychiatry. 2017;00:1–12. doi: 10.1038/mp.2017.213. [DOI] [PMC free article] [PubMed] [Google Scholar]
- Cabezas R, El-Bachá RS, González J, Barreto GE. Mitochondrial functions in astrocytes: neuroprotective implications from oxidative damage by rotenone. Neurosci Res. 2012;74(2):80–90. doi: 10.1016/j.neures.2012.07.008. [DOI] [PubMed] [Google Scholar]
- Caiazzo M, Dell’Anno MT, Dvoretskova E, Lazarevic D, Taverna S, Leo D, Sotnikova TD, Menegon A, Roncaglia P, Colciago G, Russo G, Carninci P, Pezzoli G, Gainetdinov RR, Gustincich S, Dityatev A, Broccoli V. Direct generation of functional dopaminergic neurons from mouse and human fibroblasts. Nature. 2011;476:224–227. doi: 10.1038/nature10284. [DOI] [PubMed] [Google Scholar]
- Chiang MC, Cheng YC, Chen HM, Liang YJ, Yen CH. Rosiglitazone promotes neurite outgrowth and mitochondrial function in N2A cells via PPARgamma pathway. Mitochondrion. 2014;14:7–17. doi: 10.1016/j.mito.2013.12.003. [DOI] [PubMed] [Google Scholar]
- Chomczynski P, Sacchi N. Single-step method of RNA isolation by acid guanidinium thiocyanate-phenol-chloroform extraction. Anal Biochem. 1987;162:156–159. doi: 10.1006/abio.1987.9999. [DOI] [PubMed] [Google Scholar]
- Chomczynski P, Sacchi N. The single-step method of RNA isolation by acid guanidinium thiocyanate-phenol-chloroform extraction: twenty-something years on. Nat Protoc. 2006;1:581–585. doi: 10.1038/nprot.2006.83. [DOI] [PubMed] [Google Scholar]
- Clapham DE. Calcium signaling. Cell. 2007;131:1047–1058. doi: 10.1016/j.cell.2007.11.028. [DOI] [PubMed] [Google Scholar]
- Coecke S, Goldberg AM, Allen S, Buzanska L, Calamandrei G, Crofton K, Hareng L, Hartung T, Knaut H, Honegger P, Jacobs M, Lein P, Li A, Mundy W, Owen D, Schneider S, Silbergeld E, Reum T, Trnovec T, Monnet-Tschudi F, Bal-Price A. Workgroup report: incorporating in vitro alternative methods for developmental neurotoxicity into international hazard and risk assessment strategies. Environ Health Perspect. 2007;115:924–931. doi: 10.1289/ehp.9427. [DOI] [PMC free article] [PubMed] [Google Scholar]
- Crofton KM, Mundy WR, Lein PJ, Bal-Price A, Coecke S, Seiler AE, Knaut H, Buzanska L, Goldberg A. Developmental neurotoxicity testing: recommendations for developing alternative methods for the screening and prioritization of chemicals. ALTEX. 2011;28:9–15. [PubMed] [Google Scholar]
- Crofton K, Fritsche E, Ylikomi T, Bal-Price A. International STakeholder NETwork (ISTNET) for creating a developmental neurotoxicity testing (DNT) roadmap for regulatory purposes. ALTEX. 2014;31:223–224. doi: 10.14573/altex.1402121. [DOI] [PubMed] [Google Scholar]
- Darmanis S, Sloan SA, Zhang Y, Enge M, Caneda C, Shuer LM, Hayden Gephart MG, Barres BA, Quake SR. A survey of human brain transcriptome diversity at the single cell level. Proc Natl Acad Sci U S A. 2015;112:7285–7290. doi: 10.1073/pnas.1507125112. [DOI] [PMC free article] [PubMed] [Google Scholar]
- Dubovicky M. Neurobehavioral manifestations of developmental impairment of the brain. Interdiscip Toxicol. 2010;3:59–67. doi: 10.2478/v10102-010-0012-4. [DOI] [PMC free article] [PubMed] [Google Scholar]
- Dugan LL, Kim-Han JS. Astrocyte mitochondria in in vitro models of ischemia. J Bioenerg Biomembr. 2004;36(4):317–321. doi: 10.1023/B:JOBB.0000041761.61554.44. [DOI] [PubMed] [Google Scholar]
- EPA. Memorandum: Rotenone: final HED chapter of the registration eligibility decision (RED) Washington, D.C.: 2006a. (PC Code: 071003. DP Barcode: D328478). [Google Scholar]
- EPA. (EPA 738-R-07-005. Case No. 0255).Reregistration eligibility decision for rotenone. 2006b [Google Scholar]
- Fang Du, Qing Yu, Yan Shijun, Chen Doris, Yan Shirley ShiDu. Development and dynamic regulation of mitochondrial network in human midbrain dopaminergic neurons differentiated from iPSCs. Stem Cell Rep. 2016;7(4):678–692. doi: 10.1016/j.stemcr.2016.08.014. [DOI] [PMC free article] [PubMed] [Google Scholar]
- Fleming SM, Zhu C, Fernagut PO, Mehta A, DiCarlo CD, Seaman RL, Chesselet MF. Behavioral and immunohistochemical effects of chronic intravenous and subcutaneous infusions of varying doses of rotenone. Exp Neurol. 2004;187:418–429. doi: 10.1016/j.expneurol.2004.01.023. [DOI] [PubMed] [Google Scholar]
- Fritsche E, Crofton KM, Hernandez AF, Hougaard Bennekou S, Leist M, Bal-Price A, Reaves E, Wilks MF, Terron A, Solecki R, Sachana M, Gourmelon A. OECD/EFSA workshop on developmental neurotoxicity (DNT): the use of non-animal test methods for regulatory purposes. ALTEX. 2017;34:311–315. doi: 10.14573/altex.1701171. [DOI] [PubMed] [Google Scholar]
- Giorgi C, Romagnoli A, Pinton P, Rizzuto R. Ca2+ signaling, mitochondria and cell death. Curr Mol Med. 2008;8:119–130. doi: 10.2174/156652408783769571. [DOI] [PubMed] [Google Scholar]
- Giorgi C, Agnoletto C, Bononi A, Bonora M, De Marchi E, Marchi S, Missiroli S, Patergnani S, Poletti F, Rimessi A, Suski JM, Wieckowski MR, Pinton P. Mitochondrial calcium homeostasis as potential target for mitochondrial medicine. Mitochondrion. 2012;12:77–85. doi: 10.1016/j.mito.2011.07.004. [DOI] [PMC free article] [PubMed] [Google Scholar]
- Grandjean P, Landrigan PJ. Developmental neurotoxicity of industrial chemicals. Lancet. 2006;368:2167–2178. doi: 10.1016/S0140-6736(06)69665-7. [DOI] [PubMed] [Google Scholar]
- Greenamyre JT, Betarbet R, Sherer TB. The rotenone model of Parkinson’s disease: genes, environment and mitochondria. Parkinsonism Relat Disord. 2003;9:S59–64. doi: 10.1016/s1353-8020(03)00023-3. [DOI] [PubMed] [Google Scholar]
- Hartley RS, Margulis M, Fishman PS, Lee VM, Tang CM. Functional synapses are formed between human NTera2 (NT2N, hNT) neurons grown on astrocytes. J Comp Neurol. 1999;407:1–10. doi: 10.1002/(sici)1096-9861(19990428)407:1<1::aid-cne1>3.0.co;2-z. [DOI] [PubMed] [Google Scholar]
- Hatcher JM, Pennell KD, Miller GW. Parkinson’s disease and pesticides: a toxicological perspective. Trends Pharmacol Sci. 2008;29:322–329. doi: 10.1016/j.tips.2008.03.007. [DOI] [PMC free article] [PubMed] [Google Scholar]
- Hoelting L, Klima S, Karreman C, Grinberg M, Meisig J, Henry M, Rotshteyn T, Rahnenfuhrer J, Bluthgen N, Sachinidis A, Waldmann T, Leist M. Stem cell-derived immature human dorsal root ganglia neurons to identify peripheral neurotoxicants. Stem Cells Transl Med. 2016;5:476–487. doi: 10.5966/sctm.2015-0108. [DOI] [PMC free article] [PubMed] [Google Scholar]
- Hogberg HT, Kinsner-Ovaskainen A, Coecke S, Hartung T, Bal-Price AK. mRNA expression is a relevant tool to identify developmental neurotoxicants using an in vitro approach. Toxicol Sci. 2010;113:95–115. doi: 10.1093/toxsci/kfp175. [DOI] [PubMed] [Google Scholar]
- Hogberg HT, Sobanski T, Novellino A, Whelan M, Weiss DG, Bal-Price AK. Application of micro-electrode arrays (MEAs) as an emerging technology for developmental neurotoxicity: evaluation of domoic acid-induced effects in primary cultures of rat cortical neurons. Neurotoxicology. 2011;32:158–168. doi: 10.1016/j.neuro.2010.10.007. [DOI] [PubMed] [Google Scholar]
- Hogberg HT, Bressler J, Christian KM, Harris G, Makri G, O’Driscoll C, Pamies D, Smirnova L, Wen Z, Hartung T. Toward a 3D model of human brain development for studying gene/environment interactions. Stem Cell Res Ther. 2013;4(Suppl 1):S4. doi: 10.1186/scrt365. [DOI] [PMC free article] [PubMed] [Google Scholar]
- Ishido M, Suzuki J, Masuo Y. Neonatal rotenone lesions cause onset of hyperactivity during juvenile and adulthood in the rat. Toxicol Lett. 2017;266:42–48. doi: 10.1016/j.toxlet.2016.12.008. [DOI] [PubMed] [Google Scholar]
- Kansanen E, Kuosmanen SM, Leinonen H, Levonen AL. The Keap1-Nrf2 pathway: mechanisms of activation and dysregulation in cancer. Redox Biol. 2013;1:45–49. doi: 10.1016/j.redox.2012.10.001. [DOI] [PMC free article] [PubMed] [Google Scholar]
- Khera KS, Whalen C, Angers G. Teratogenicity study on pyrethrum and rote-none (natural origin) and ronnel in pregnant rats. J Toxicol Environ Health. 1982;10:111–119. doi: 10.1080/15287398209530235. [DOI] [PubMed] [Google Scholar]
- Krug AK, Balmer NV, Matt F, Schonenberger F, Merhof D, Leist M. Evaluation of a human neurite growth assay as specific screen for developmental neurotoxicants. Arch Toxicol. 2013;87:2215–2231. doi: 10.1007/s00204-013-1072-y. [DOI] [PubMed] [Google Scholar]
- Krug AK, Gutbier S, Zhao L, Poltl D, Kullmann C, Ivanova V, Forster S, Jagtap S, Meiser J, Leparc G, Schildknecht S, Adam M, Hiller K, Farhan H, Brunner T, Hartung T, Sachinidis A, Leist M. Transcriptional and metabolic adaptation of human neurons to the mitochondrial toxicant MPP. Cell Death Dis. 2014;5:e1222. doi: 10.1038/cddis.2014.166. [DOI] [PMC free article] [PubMed] [Google Scholar]
- La Manno G, Gyllborg D, Codeluppi S, Nishimura K, Salto C, Zeisel A, Borm LE, Stott SRW, Toledo EM, Villaescusa JC, Lonnerberg P, Ryge J, Barker RA, Arenas E, Linnarsson S. Molecular diversity of midbrain development in mouse, human, and stem cells. Cell. 2016;167(566–580):e519. doi: 10.1016/j.cell.2016.09.027. [DOI] [PMC free article] [PubMed] [Google Scholar]
- Lancaster MA, Renner M, Martin CA, Wenzel D, Bicknell LS, Hurles ME, Homfray T, Penninger JM, Jackson AP, Knoblich JA. Cerebral organoids model human brain development and microcephaly. Nature. 2013;501:373. doi: 10.1038/nature12517. [DOI] [PMC free article] [PubMed] [Google Scholar]
- Laurenza I, Pallocca G, Mennecozzi M, Scelfo B, Pamies D, Bal-Price A. A human pluripotent carcinoma stem cell-based model for in vitro developmental neurotoxicity testing: effects of methylmercury, lead and aluminum evaluated by gene expression studies. Int J Dev Neurosci. 2013;31:679–691. doi: 10.1016/j.ijdevneu.2013.03.002. [DOI] [PubMed] [Google Scholar]
- Lein P, Locke P, Goldberg A. Meeting report: alternatives for developmental neurotoxicity testing. Environ Health Perspect. 2007;115:764–768. doi: 10.1289/ehp.9841. [DOI] [PMC free article] [PubMed] [Google Scholar]
- Levine JH, Simonds EF, Bendall SC, Davis KL, Amir el AD, Tadmor MD, Litvin O, Fienberg HG, Jager A, Zunder ER, Finck R, Gedman AL, Radtke I, Downing JR, Pe’er D, Nolan GP. Data-driven phenotypic dissection of AML reveals progenitor-like cells that correlate with prognosis. Cell. 2015;162:184–197. doi: 10.1016/j.cell.2015.05.047. [DOI] [PMC free article] [PubMed] [Google Scholar]
- Li AA, Mink PJ, McIntosh LJ, Teta MJ, Finley B. Evaluation of epidemiologic and animal data associating pesticides with Parkinson’s disease. J Occup Environ Med. 2005;47:1059–1087. doi: 10.1097/01.jom.0000174294.58575.3e. [DOI] [PubMed] [Google Scholar]
- Li AA, Sheets LP, Raffaele K, Moser V, Hofstra A, Hoberman A, Makris SL, Garman R, Bolon B, Kaufmann W, Auer R, Lau E, Vidmar T, Bowers WJ. Recommendations for harmonization of data collection and analysis of developmental neurotoxicity endpoints in regulatory guideline studies: Proceedings of workshops presented at Society of Toxicology and joint Teratology Society and Neurobehavioral Teratology Society meetings. Neurotoxicol Teratol. 2017;63:24–45. doi: 10.1016/j.ntt.2017.07.001. [DOI] [PMC free article] [PubMed] [Google Scholar]
- Liu Q, Spusta SC, Mi R, Lassiter RN, Stark MR, Hoke A, Rao MS, Zeng X. Human neural crest stem cells derived from human ESCs and induced pluripotent stem cells: induction, maintenance, and differentiation into functional schwann cells. Stem Cells Transl Med. 2012;1:266–278. doi: 10.5966/sctm.2011-0042. [DOI] [PMC free article] [PubMed] [Google Scholar]
- Livak KJ, Schmittgen TD. Analysis of relative gene expression data using real-time quantitative PCR and the 2(-Delta Delta C(T)) Method. Methods. 2001;25:402–408. doi: 10.1006/meth.2001.1262. [DOI] [PubMed] [Google Scholar]
- Melo KM, Oliveira R, Grisolia CK, Domingues I, Pieczarka JC, de Souza Filho J, Nagamachi CY. Short-term exposure to low doses of rotenone induces developmental, biochemical, behavioral, and histological changes in fish. Environ Sci Pollut Res Int. 2015;22:13926–13938. doi: 10.1007/s11356-015-4596-2. [DOI] [PubMed] [Google Scholar]
- Nandipati S, Litvan I. Environmental exposures and Parkinson’s disease. Int J Environ Res Public Health. 2016;13 doi: 10.3390/ijerph13090881. [DOI] [PMC free article] [PubMed] [Google Scholar]
- Nieto M, Monuki ES, Tang H, Imitola J, Haubst N, Khoury SJ, Cunningham J, Gotz M, Walsh CA. Expression of Cux-1 and Cux-2 in the subventricular zone and upper layers II-IV of the cerebral cortex. J Comp Neurol. 2004;479:168–180. doi: 10.1002/cne.20322. [DOI] [PubMed] [Google Scholar]
- OECD. Test No 426: Developmental Neurotoxicity Study. OECD Publishing; 2007. [DOI] [Google Scholar]
- O’Rahilly R, Muller F. Significant features in the early prenatal development of the human brain. Ann Anat. 2008;190:105–118. doi: 10.1016/j.aanat.2008.01.001. [DOI] [PubMed] [Google Scholar]
- Pallocca G, Fabbri M, Sacco MG, Gribaldo L, Pamies D, Laurenza I, Bal-Price A. miRNA expression profiling in a human stem cell-based model as a tool for developmental neurotoxicity testing. Cell Biol Toxicol. 2013;29:239–257. doi: 10.1007/s10565-013-9250-5. [DOI] [PubMed] [Google Scholar]
- Pamies D, Barreras P, Block K, Makri G, Kumar A, Wiersma D, Smirnova L, Zang C, Bressler J, Christian KM, Harris G, Ming GL, Berlinicke CJ, Kyro K, Song H, Pardo CA, Hartung T, Hogberg HT. A human brain microphysiological system derived from induced pluripotent stem cells to study neurological diseases and toxicity. ALTEX. 2017;34:362–376. doi: 10.14573/altex.1609122. [DOI] [PMC free article] [PubMed] [Google Scholar]
- Pasca AM, Sloan SA, Clarke LE, Tian Y, Makinson CD, Huber N, Kim CH, Park JY, O’Rourke NA, Nguyen KD, Smith SJ, Huguenard JR, Geschwind DH, Barres BA, Pasca SP. Functional cortical neurons and astrocytes from human pluripotent stem cells in 3D culture. Nat Methods. 2015;12:671–678. doi: 10.1038/nmeth.3415. [DOI] [PMC free article] [PubMed] [Google Scholar]
- Perier C, Bove J, Vila M, Przedborski S. The rotenone model of Parkinson’s disease. Trends Neurosci. 2003;26:345–346. doi: 10.1016/S0166-2236(03)00144-9. [DOI] [PubMed] [Google Scholar]
- Persson AK, Kim I, Zhao P, Estacion M, Black JA, Waxman SG. Sodium channels contribute to degeneration of dorsal root ganglion neurites induced by mitochondrial dysfunction in an in vitro model of axonal injury. J Neurosci. 2013;33:19250–19261. doi: 10.1523/JNEUROSCI.2148-13.2013. [DOI] [PMC free article] [PubMed] [Google Scholar]
- Pistollato F, Canovas-Jorda D, Zagoura D, Bal-Price A. Nrf2 pathway activation upon rotenone treatment in human iPSC-derived neural stem cells undergoing differentiation towards neurons and astrocytes. Neurochem Int. 2017;108:457–471. doi: 10.1016/j.neuint.2017.06.006. [DOI] [PubMed] [Google Scholar]
- Quadrato G, Nguyen T, Macosko EZ, Sherwood JL, Min Yang S, Berger DR, Maria N, Scholvin J, Goldman M, Kinney JP, Boyden ES, Lichtman JW, Williams ZM, McCarroll SA, Arlotta P. Cell diversity and network dynamics in photosensitive human brain organoids. Nature. 2017;545:48–53. doi: 10.1038/nature22047. [DOI] [PMC free article] [PubMed] [Google Scholar]
- Rao VK, Chauhan SPS. Teratogenic effects of rotenone on the early development of chick embryos in vitro. Teratology. 2004;4(2):191–197. [Google Scholar]
- Rice D, Barone S., Jr Critical periods of vulnerability for the developing nervous system: evidence from humans and animal models. Environ Health Perspect. 2000;108(Suppl 3):511–533. doi: 10.1289/ehp.00108s3511. [DOI] [PMC free article] [PubMed] [Google Scholar]
- Richter F, Hamann M, Richter A. Chronic rotenone treatment induces behavioral effects but no pathological signs of parkinsonism in mice. J Neurosci Res. 2007;85:681–691. doi: 10.1002/jnr.21159. [DOI] [PubMed] [Google Scholar]
- Rizzuto R, Bernardi P, Pozzan T. Mitochondria as all-round players of the calcium game. J Physiol. 2000;529(Pt 1):37–47. doi: 10.1111/j.1469-7793.2000.00037.x. [DOI] [PMC free article] [PubMed] [Google Scholar]
- Sanchez M, Gastaldi L, Remedi M, Caceres A, Landa C. Rotenone-induced toxicity is mediated by Rho-GTPases in hippocampal neurons. Toxicol Sci. 2008;104:352–361. doi: 10.1093/toxsci/kfn092. [DOI] [PubMed] [Google Scholar]
- Saravanan KS, Sindhu KM, Mohanakumar KP. Acute intranigral infusion of rotenone in rats causes progressive biochemical lesions in the striatum similar to Parkinson’s disease. Brain Res. 2005;1049:147–155. doi: 10.1016/j.brainres.2005.04.051. [DOI] [PubMed] [Google Scholar]
- Schettler T. Toxic threats to neurologic development of children. Environ Health Perspect. 2001;109(Suppl 6):813–816. doi: 10.1289/ehp.01109s6813. [DOI] [PMC free article] [PubMed] [Google Scholar]
- Shi YL, Feng S, Chen W, Hua ZC, Bian JJ, Yin W. Mitochondrial inhibitor sensitizes non-small-cell lung carcinoma cells to TRAIL-induced apoptosis by reactive oxygen species and Bcl-X(L)/p53-mediated amplification mechanisms. Cell Death Dis. 2014;5:e1579. doi: 10.1038/cddis.2014.547. [DOI] [PMC free article] [PubMed] [Google Scholar]
- Sindhu KM, Saravanan KS, Mohanakumar KP. Behavioral differences in a rotenone-induced hemiparkinsonian rat model developed following intranigral or median forebrain bundle infusion. Brain Res. 2005;1051:25–34. doi: 10.1016/j.brainres.2005.05.051. [DOI] [PubMed] [Google Scholar]
- Sloan SA, Darmanis S, Huber N, Khan TA, Birey F, Caneda C, Reimer R, Quake SR, Barres BA, Pasca SP. Human astrocyte maturation captured in 3D cerebral cortical spheroids derived from pluripotent stem cells. Neuron. 2017;95:779–790e776. doi: 10.1016/j.neuron.2017.07.035. [DOI] [PMC free article] [PubMed] [Google Scholar]
- Smirnova L, Hogberg HT, Leist M, Hartung T. Developmental neurotoxicity -challenges in the 21st century and in vitro opportunities. ALTEX. 2014;31:129–156. doi: 10.14573/altex.1403271. [DOI] [PMC free article] [PubMed] [Google Scholar]
- Spencer F, Sing LT. Reproductive responses to rotenone during decidualized pseudogestation and gestation in rats. Bull Environ Contam Toxicol. 1982;28:360–368. doi: 10.1007/BF01608522. [DOI] [PubMed] [Google Scholar]
- Spivey A. Rotenone and paraquat linked to Parkinson’s disease: human exposure study supports years of animal studies. Environ Health Perspect. 2011;119:A259. doi: 10.1289/ehp.119-a259a. [DOI] [PMC free article] [PubMed] [Google Scholar]
- Stern M, Gierse A, Tan S, Bicker G. Human Ntera2 cells as a predictive in vitro test system for developmental neurotoxicity. Arch Toxicol. 2014;88:127–136. doi: 10.1007/s00204-013-1098-1. [DOI] [PubMed] [Google Scholar]
- Subramaniam SR, Chesselet MF. Mitochondrial dysfunction and oxidative stress in Parkinson’s disease. Prog Neurobiol. 2013:106–107. 17–32. doi: 10.1016/j.pneurobio.2013.04.004. [DOI] [PMC free article] [PubMed] [Google Scholar]
- Swarnkar S, Goswami P, Kamat PK, Gupta S, Patro IK, Singh S, Nath C. Rotenone-induced apoptosis and role of calcium: a study on neuro-2a cells. Arch Toxicol. 2012;86:1387–1397. doi: 10.1007/s00204-012-0853-z. [DOI] [PubMed] [Google Scholar]
- Takahashi K, Yamanaka S. Induction of pluripotent stem cells from mouse embryonic and adult fibroblast cultures by defined factors. Cell. 2006;126:663–676. doi: 10.1016/j.cell.2006.07.024. [DOI] [PubMed] [Google Scholar]
- Takahashi K, Tanabe K, Ohnuki M, Narita M, Ichisaka T, Tomoda K, Yamanaka S. Induction of pluripotent stem cells from adult human fibroblasts by defined factors. Cell. 2007;131:861–872. doi: 10.1016/j.cell.2007.11.019. [DOI] [PubMed] [Google Scholar]
- Tanner CM, Kamel F, Ross GW, Hoppin JA, Goldman SM, Korell M, Marras C, Bhudhikanok GS, Kasten M, Chade AR, Comyns K, Richards MB, Meng C, Priestley B, Fernandez HH, Cambi F, Umbach DM, Blair A, Sandler DP, Langston JW. Rotenone, paraquat, and Parkinson’s disease. Environ Health Perspect. 2011;119:866–872. doi: 10.1289/ehp.1002839. [DOI] [PMC free article] [PubMed] [Google Scholar]
- USEPA. Health effects guidelines OPPTS 870.6300 developmental neurotoxicity study Office of Prevention Pesticides and Toxic Substances. 1998 http://www.regulations.gov/#!documentDetail;D=EPA-HQ-OPPT-2009-0156-0042.
- van Vliet E, Stoppini L, Balestrino M, Eskes C, Griesinger C, Sobanski T, Whelan M, Hartung T, Coecke S. Electrophysiological recording of re-aggregating brain cell cultures on multi-electrode arrays to detect acute neurotoxic effects. Neurotoxicology. 2007;28:1136–1146. doi: 10.1016/j.neuro.2007.06.004. [DOI] [PubMed] [Google Scholar]
- van Vliet E, Morath S, Eskes C, Linge J, Rappsilber J, Honegger P, Hartung T, Coecke S. A novel in vitro metabolomics approach for neurotoxicity testing, proof of principle for methyl mercury chloride and caffeine. Neurotoxicology. 2008;29:1–12. doi: 10.1016/j.neuro.2007.09.007. [DOI] [PubMed] [Google Scholar]
- Wang XJ, Xu JX. Possible involvement of Ca2+ signaling in rotenone-induced apoptosis in human neuroblastoma SH-SY5Y cells. Neurosci Lett. 2005;376:127–132. doi: 10.1016/j.neulet.2004.11.041. [DOI] [PubMed] [Google Scholar]
- Wen Z, Nguyen HN, Guo Z, Lalli MA, Wang X, Su Y, Kim NS, Yoon KJ, Shin J, Zhang C, Makri G, Nauen D, Yu H, Guzman E, Chiang CH, Yoritomo N, Kaibuchi K, Zou J, Christian KM, Cheng L, Ross CA, Margolis RL, Chen G, Kosik KS, Song H, Ming GL. Synaptic dysregulation in a human iPS cell model of mental disorders. Nature. 2014;515:414–418. doi: 10.1038/nature13716. [DOI] [PMC free article] [PubMed] [Google Scholar]
- Xiang Y, Tanaka Y, Patterson B, Kang YJ, Govindaiah G, Roselaar N, Cakir B, Kim KY, Lombroso AP, Hwang SM, Zhong M, Stanley EG, Elefanty AG, Naegele JR, Lee SH, Weissman SM, Park IH. Fusion of regionally specified hPSC-derived organoids models human brain development and interneuron migration. Cell Stem Cell. 2017;21(383–398):e387. doi: 10.1016/j.stem.2017.07.007. [DOI] [PMC free article] [PubMed] [Google Scholar]
- Zagoura D, Canovas-Jorda D, Pistollato F, Bremer-Hoffmann S, Bal-Price A. Evaluation of the rotenone-induced activation of the Nrf2 pathway in a neuronal model derived from human induced pluripotent stem cells. Neurochem Int. 2017;106:62–73. doi: 10.1016/j.neuint.2016.09.004. [DOI] [PubMed] [Google Scholar]
- Zander NE, Piehler T, Hogberg H, Pamies D. Explosive blast loading on human 3D aggregate minibrains. Cell Mol Neurobiol. 2017;37(7):1331–1334. doi: 10.1007/s10571-017-0463-7. [DOI] [PMC free article] [PubMed] [Google Scholar]
- Zheng GX, Terry JM, Belgrader P, Ryvkin P, Bent ZW, Wilson R, Ziraldo SB, Wheeler TD, McDermott GP, Zhu J, Gregory MT, Shuga J, Montesclaros L, Underwood JG, Masquelier DA, Nishimura SY, Schnall-Levin M, Wyatt PW, Hindson CM, Bharadwaj R, Wong A, Ness KD, Beppu LW, Deeg HJ, McFarland C, Loeb KR, Valente WJ, Ericson NG, Stevens EA, Radich JP, Mikkelsen TS, Hindson BJ, Bielas JH. Massively parallel digital transcriptional profiling of single cells. Nat Commun. 2017;8:14049. doi: 10.1038/ncomms14049. [DOI] [PMC free article] [PubMed] [Google Scholar]
Associated Data
This section collects any data citations, data availability statements, or supplementary materials included in this article.