Abstract
The “tree-in-bud-pattern” of images on thin-section lung CT is defined by centrilobular branching structures that resemble a budding tree. We investigated the pathological basis of the tree-in-bud lesion by reviewing the pathological specimens of bronchograms of normal lungs and contract radiographs of the post-mortem lungs manifesting active pulmonary tuberculosis. The tree portion corresponds to the intralobular inflammatory bronchiole, while the bud portion represents filling of inflammatory substances within alveolar ducts, which are larger than the corresponding bronchioles. Inflammatory bronchiole per se represents the “tree” (stem) and inflammatory alveolar ducts constitute the “buds” or clubbing. “Clusters of micronodules”, seen on 7-mm thick post-mortem radiographs with tuberculosis proved to be clusters of tree-in-bud lesions within the three-dimensional space of secondary pulmonary lobule based on radiological/pathological correlation. None of the post-mortem lung specimens showed findings of lung parenchymal lymphatics involvement.
Keywords: Tree-in-bud, Pulmonary tuberculosis, Cluster of micronodules, Radiology-Pathology correlation, Centrilobular nodules
INTRODUCTION
Since the initial report of endobronchial spread of pulmonary tuberculosis (1), the “tree-in-bud sign” has been reported in a wide variety of health conditions including infectious diseases, aspiration pneumonia, congenital disorders, idiopathic disorders, inhalation, immunologic disorders, connective disorders (2,3,4,5,6) and central lung cancer involving the peripheral airways (7). Subsequently, metastatic diseases showing “tree-in-bud sign” caused by tumor cells in and around the intralobular pulmonary artery were also reported (8,9,10,11).
According to the glossary of terms by the Fleischner Society, the “tree-in-bud-pattern” on thin-section CT images is defined as centrilobular branching structures resembling a budding tree (12).
We reviewed the pathological basis of “tree-in-bud sign” on thin-section CT and delineated the pathology of “clusters of small nodules”, reported in patient with tuberculosis (13).
Pathological Basis of Tree-in-Bud Pattern on Thin-Section CT
We reviewed the post-mortem bronchograms of normal lungs and specimen contact radiographs of the resected lung specimens of nine patients who died from active pulmonary tuberculosis, from the archives of the Biomedical Research Institute of University of Fukui School of Medical Sciences. The review of Institutional Review Board was waived. Nine of the six patients showed bronchogenic spread of tuberculosis and the remaining three patients had miliary tuberculosis. The lungs obtained at autopsy were inflated and fixed by Heitzman's method (14). Specimen radiographs were obtained using the technique described by Itoh et al. (16). All the specimens were blinded for patient identification.
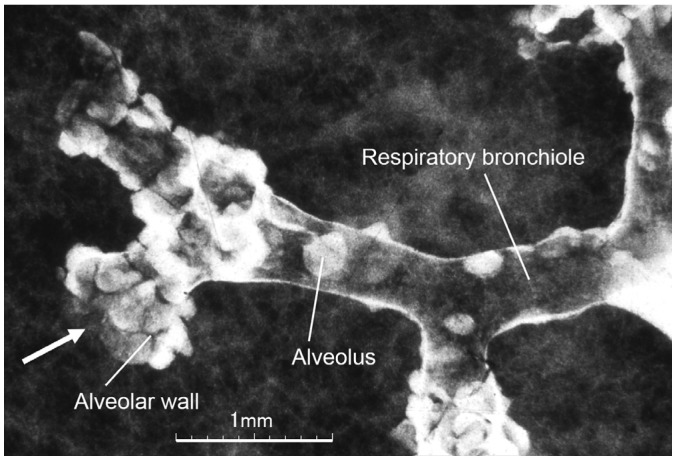
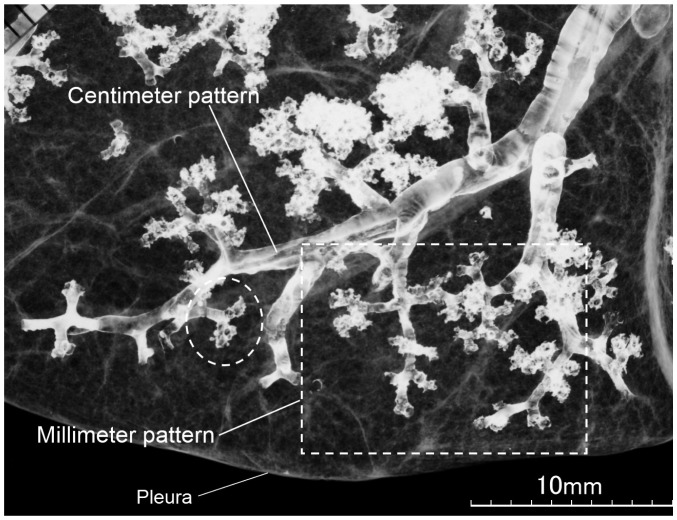
The secondary pulmonary lobule is a polygonal structure measuring 1.0–2.5 cm in diameter, divided by interlobular septa enclosing lobular bronchioles accompanied by a pulmonary artery. The lobular bronchiole is 1 mm or less in diameter and comprises 3–5 terminal bronchioles (end of conducting airways), each of which branches into respiratory bronchioles and alveolar ducts (transitional airways). The bronchioles occur at 1–2 mm intervals (millimeter pattern), while the bronchus shows 5–10 mm intervals (centimeter pattern) (16). Diameter of the terminal and respiratory bronchioles ranges from 0.5 mm to 0.6 mm. As the respiratory bronchiole and alveolar ducts contain alveoli in their wall, the margin presents a corrugated appearance on post-mortem bronchogram (Fig. 1). The alveolar ducts are equipped with alveoli, and therefore, the diameter is greater than that of proximal respiratory bronchioles. Each respiratory bronchiole divides into 2–3 alveolar ducts and the diameter of each of the aggregated alveolar ducts is more than 3 times that of the respiratory bronchioles (Fig. 2).
Fig. 1. Post-mortem bronchiologram.
Respiratory bronchioles and central part of alveolar duct are demonstrated. Respiratory bronchioles are equipped with alveoli. Diameter of alveolar duct is larger than that of respiratory bronchiole, because diameter of alveoli is added to that of ductal lumen (arrow).
Fig. 2. Post-mortem bronchiologram.
Two types of bronchiolar branching, cm and mm pattern, are demonstrated. Latter (boxed area) is morphological basis of tree-in-bud lesions in pulmonary tuberculosis. Extreme end of mm pattern is ballooned-out with fuzzy outline, which indicates alveolar ducts (circle).
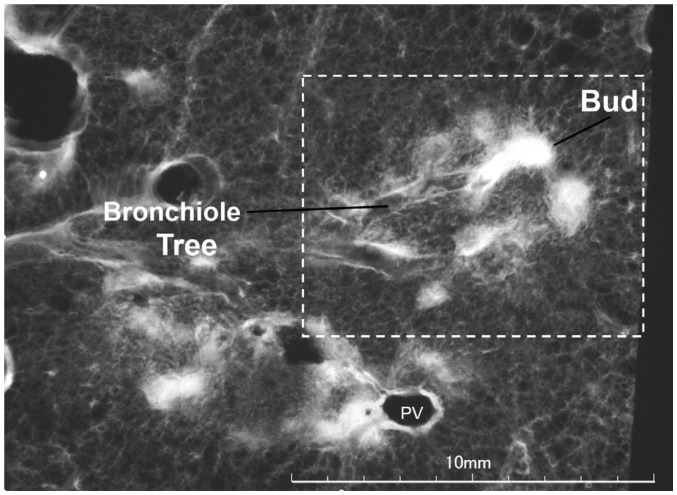
In patients with endobronchial spread tuberculosis, a post-mortem specimen radiograph demonstrates filling of caseous material in smooth marginated bronchiole (tree), which is connected to irregular-marginated clubbed alveolar ducts (buds) (Fig. 3). Depending on the chronicity of the endobronchial tuberculosis, the tree-in-bud lesions consist of either endo-luminal caseum or mixture of intra- and peri-bronchiolar caseation, inflammatory cells and debris, fibrosis, and granuloma formation. Earliest findings of endobronchial spread tuberculosis, mostly from adjacent cavity, is the formation of intrabronchiolar caseum, followed by peribronchiolar granuloma and fibrosis (17). Because post-primary tuberculosis is a chronic disease, even within the same lung, the lesions are heterogeneous in age with varying degree of fibrosis and granuloma formation. Therefore, most of the resected lung specimens with tuberculosis in a clinical setting are characterized by granulomas and fibrosis rather than endobronchiolar impaction of caseum.
Fig. 3. Post-mortem radiograph of patient with active pulmonary tuberculosis demonstrating tree-in-bud lesion (boxed area) with smooth marginated bronchiole (tree) and distal clubbed end (bud).
Bud measures 1–2 mm in diameter and is definitely bigger than parent bronchiole (tree). Slice thickness is 1 mm. PV = pulmonary vein
Tree-in-Bud Lesion, Centrilobular Branching Structure, and Centrilobular Nodules on Thin-section CT
Due to the three-dimensional structure of the secondary pulmonary lobule, imaging by thin-section CT may not reveal the tree-in-bud or centrilobular branching lesions to their full extent, but more commonly as nodular lesions.
As a descriptive term, centrilobular branching structure without visible terminal clubbing, may not be used as “tree-in-bud pattern”, even though inflammatory process of the bronchioles, either infectious or non-infectious, tends to extend to alveolar ducts.
Density and Marginal Clarity of Tree-in-Bud Lesion
Bronchogenic spread tuberculosis (1) and diffuse panbronchiolits (18), characterized by original description of “tree-in-bud pattern” are chronic diseases in contrast to acute infectious bronchiolitis.
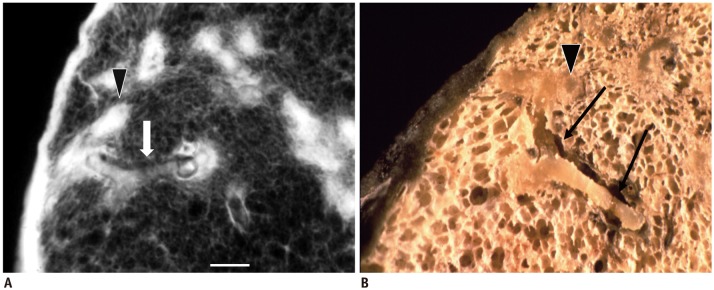
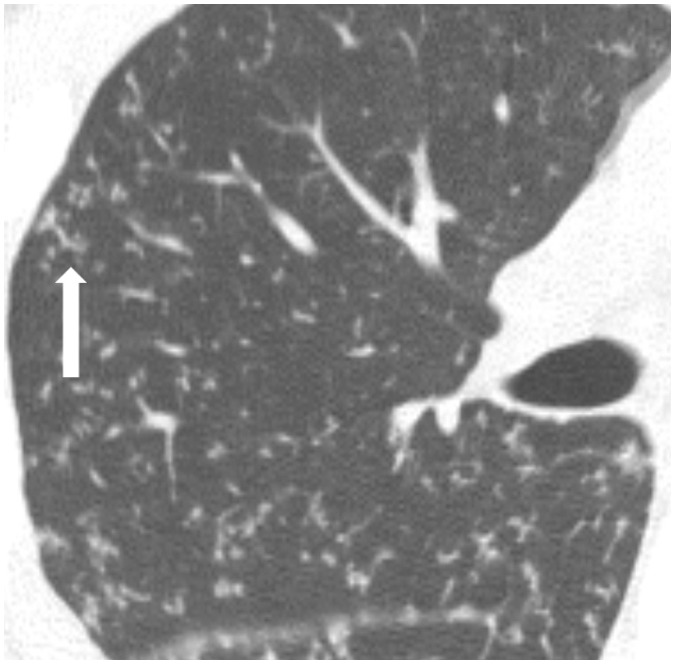
Bronchiolar or alveolar duct lesions in bronchogenic spread tuberculosis consist of endoluminal impaction of caseous material and/or peribronchiolar inflammatory cell infiltration with organization. Caseation necrosis is a process of coagulation necrosis characterized by disintegration of lipid-rich cells and conversion into a homogeneous structure without blood vessels (19). Grossly, caseation of small airways in tuberculosis appears as solid cheesy material (Fig. 4) indicating dense and conspicuous opacity even with sub-millimeter sized tree-in-bud lesions on CT (Fig. 5).
Fig. 4. Pathologic basis of tree-in-bud lesion.
Post-mortem radiograph (A) and gross photograph (B) of same specimen in patient with pulmonary tuberculosis. Impacted cheesy material within smooth-marginated bronchiole (arrows) continues to larger, rather ill-defined alveolar ducts (arrowheads). Bar indicates 1 mm. Reprinted with permission from authors' reference 1. Adapted from Im et al. Radiology 1993;186:653-660
Fig. 5. CT image of tree-in-bud lesions in patient with active pulmonary tuberculosis.
Note that tree ends in terminal clubbing (bud) (arrow). Note also that tree-in-bud lesions appear dense and well-defined even with small size; standard window setting (width 1600, level 250 HU).
Diffuse panbronchiolitis is a chronic inflammatory disease affecting mainly the respiratory bronchioles distal to the terminal bronchioles affecting the entire thickness of the bronchiolar wall, and therefore, designated as “panbronchiolitis”. Microscopic findings of bronchiolar lesions in diffuse panbronchiolitis include accumulation of foamy cells accompanied by infiltration of lymphocytes and plasma cells surrounded by hyperinflated lung (18).
Thus, the tree-in-bud lesions in endobronchial tuberculosis and diffuse panbronchiolitis appear dense and conspicuous even when the lesions are less than a millimeter in diameter.
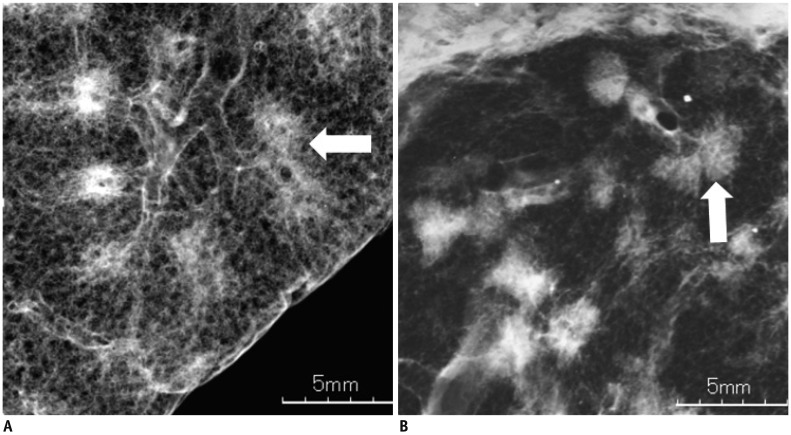
In contrast to endobronchial tuberculosis, in acute bacterial or viral infection, the inflammatory process in and around the bronchioles tends to be more exudative, spread into the adjacent alveolar space (Fig. 6). This phenomenon explains why the “tree-in-bud pattern” in acute infection is less common and less conspicuous than in endobronchial tuberculosis.
Fig. 6. Comparison of centrilobular branching nodules seen in bacterial pneumonia (A) and tuberculosis (B).
Note that marginal clarity of centrilobular nodules (arrows) are much greater in pulmonary tuberculosis (B) than in bacterial pneumonia (A).
CT Findings of “Clusters of Small Nodules” in Tuberculosis
CT findings of “clusters of small nodules” mimicking sarcoid galaxy sign (19) represent new observations in pulmonary tuberculosis (13,20). The pathologic nature of the clusters of small nodules has yet to be explored.
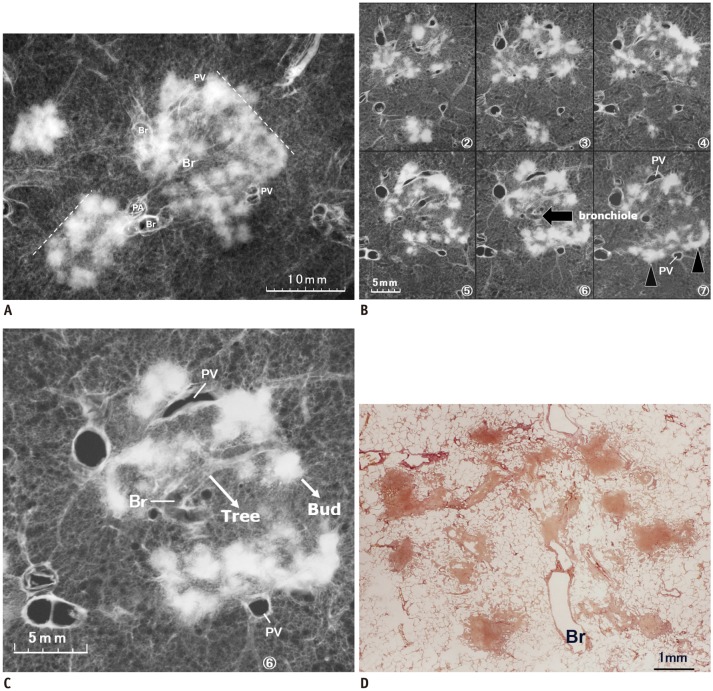
The contact radiographs of the nine autopsied lung specimens revealed clusters of micronodules in one of the post-mortem lungs. The long diameter of the clustered nodules was about 2 cm, comprising a bronchiole at the center of the clustered nodules in the 7-mm-thick sections (Fig. 7A). Serial 1-mm-thick section radiographs revealed overlap of the clusters with multiple tree-in-bud lesions demonstrating clearly the tree (bronchiole) and the bud (alveolar ducts) (Fig. 7B, C). In one section, the clustered small nodules occurred predominantly in the peripheral portion of the secondary pulmonary lobule, which can easily be misinterpreted as perilobular lesions on CT (20). Histological examination revealed the presence of lesions in the airways; caseous material in both bronchioles and alveolar ducts (Fig. 7B). No evidence of interstitial involvement, such as peribronchovascular interstitium or interlobular septa, was found, in contrast to the characteristic findings of sarcoidosis (Fig. 7D).
Fig. 7. Post-mortem radiographs of cluster of micronodules (galaxy appearance described in sarcoidosis) and corresponding microscopic findings in patient with endobronchial spread of tuberculosis.
A. Micronodules ≥ 2 mm are clustered within secondary pulmonary lobule, demarcated by interlobular septa (interrupted line) and PV. Bronchiole enters central portion of lobule (Br). PA indicates pulmonary artery. Bar indicates 10 mm; slice thickness is 7 mm. B. Serial thin-section radiographs reveal separation of each clustered nodule, with occasional continuity and branching. In lower right image, branching linear lesions occur predominantly at periphery of lobule abutting interlobular septa (arrowheads). If this plane were imaged by CT, it might have erroneously been interpreted as perilymphatic location. Bar indicates 5 mm; slice thickness is 1 mm. C. Close-up view of lower central section shows centrilobular patent bronchiole (Br) continuing into smooth marginated impacted bronchioles (tree), terminating in irregular marginated clubbed ends (buds). These findings suggest that cluster of small nodules observed on CT of patients with tuberculosis represent aggregates of tree-in-bud lesions. D. Pathologic specimen of same region shows central patent bronchiole, which continues into respiratory bronchiole with cheesy material; peripherally located cheesy material with inflammatory debris extending into surrounding alveoli (H&E, ×10).
The foregoing findings suggest that the clusters of micronodules observed in CT scan of patients with active pulmonary tuberculosis represent the aggregation of tree-in-bud lesions within the three-dimensional space of one or more secondary pulmonary lobules.
Route of Spread in Adult Pulmonary Tuberculosis
Mode of dissemination in post-primary or reactivation of pulmonary tuberculosis involves initial acute necrotizing pneumonia in the upper lung, usually characterized by liquefaction necrosis, followed by formation of cavities and transbronchial spread to other parts of the lung (17,21,22,23).
A recent report of active pulmonary tuberculosis involving 111 adult patients based on CT criteria showed that the prevalence of perilymphatic micronodules, galaxy or cluster signs, and interlobular septal thickening was 58%, 16%, and 27%, respectively. Perilymphatic and centrilobular (endobronchial) distribution was roughly 50% each. The CT findings representing perilymphatic involvement were relatively common and may represent lymphatic spread of tuberculosis (20).
We critically reviewed the CT findings of “perilymphatic nodules” and clusters of micronodules, to determine the presence of lymphatic lesions based on CT findings alone, without any pathologic evidence. We believe that clusters of micronodules represent tree-in-bud lesions in compact distribution, as illustrated in Figure 7. And we also would like to point out that since the impacted caseous material within the peripherally located alveolar ducts appears as nodular or linear opacities almost abutting the interlobular septa, those lesions can easily be misinterpreted as perilymphatic lesion on CT images. We failed to detect any evidence of lymphatic spread in the autopsied lungs of nine patients with active pulmonary tuberculosis. We also did not find any documented evidence of lymphatic spread in human adult post-primary tuberculosis.
An experimental guinea pig model of pulmonary tuberculosis, which was induced by inhalation of M. tuberculosis bacilli (24), showed microscopic evidence of tuberculous lesions within the pulmonary lymphatics. However, this model represented primary pulmonary tuberculosis, and not post-primary or re-infection tuberculosis as reported previously (14). Lymphatic spread in human primary tuberculosis is well-known. According to Kim et al. (25), the most common CT findings of pulmonary tuberculosis in infants and children (26) include hilar and mediastinal lymphadenitis (83%), representing enlarged lymph nodes with central necrotic low-attenuation and peripheral rim enhancement.
Interestingly, the authors' patients in the CT-based “perilymphatic group” showed significantly lower frequency of positive acid-fast bacilli in the sputum when compared with the centrilobular (enbobronchial) group (32% vs. 70%), and the finding supported lymphatic spread of the lesions (20). However, the frequency of cavitation in the “perilymphatic group” was significantly lower than in the centrilobular group (30% vs. 60%). The presence of cavity is the most important determinant of sputum-positive acid-fast bacilli (AFB) smear (17,23), a higher frequency of positive sputum AFB in the centrilobular group correlated strongly with a higher prevalence of cavity. In other words, the lower frequency of positive sputum AFB in the “perilymphatic group” is due to the lower frequency of cavity, rather than “intra-lymphatic location” of the lesions.
Vascular Origin of Tree-in-Bud Pattern
Metastatic tumor within the pulmonary artery, either by tumor itself (8,10) or following thrombotic microangiopathy (9), may show centrilobular branching structures, commonly with an undulated margin and varied thickness, resembling a vascular tree-in-bud pattern. However, the vascular causes of tree-in-bud morphology may reasonably lack the bud portion of the tree-in-bud. Tumor infiltration in the centrilobular peribronchovascular interstitium may also mimic a tree-in-bud pattern (10,11).
Relative Frequency of Tree-in-Bud Patterns in Various Diseases
The relative frequency of tree-in-bud opacities in the clinical setting has been evaluated by Miller and Panosian (27). The most common causes were respiratory infections (72%) including mycobacterial (39%), bacterial (27%), viral (3%), and multiple (4%) infections. A nearly uniform distribution of bronchiectasis was specific to diseases predisposing to airway infection, such as cystic fibrosis, primary ciliary dyskinesia, allergic bronchopulmonary aspergillosis, and immunodeficiency state. Consolidation and tree-in-bud opacities (bronchopneumonia pattern) were usually attributed to bacterial infection and aspiration pneumonia.
CONCLUSION
The “tree-in-bud pattern or sign” should be used in case of visible “tree” and “bud”. The term “centrilobular branching opacity” is desirable in case the “bud” is absent. We suggest that “clusters of micronodules” on CT in adult active pulmonary tuberculosis represent aggregated tree-in-bud lesions. CT-based analysis of lymphatic spread in patients with adult pulmonary tuberculosis without pathological proof may lead to erroneous conclusions.
Acknowledgments
We thank Dr. Tomas Franquet for his valuable comments. Contents of this article was presented at the Annual Meeting of the Fleischer Society in 2017.
References
- 1.Im JG, Itoh H, Shim YS, Lee JH, Ahn J, Han MC, et al. Pulmonary tuberculosis: CT findings--early active disease and sequential change with antituberculous therapy. Radiology. 1993;186:653–660. doi: 10.1148/radiology.186.3.8430169. [DOI] [PubMed] [Google Scholar]
- 2.Collins J, Blankenbaker D, Stern EJ. CT patterns of bronchiolar disease: what is “tree-in-bud”. AJR Am J Roentgenol. 1998;171:365–370. doi: 10.2214/ajr.171.2.9694453. [DOI] [PubMed] [Google Scholar]
- 3.Eisenhuber E. The tree-in-bud sign. Radiology. 2002;222:771–772. doi: 10.1148/radiol.2223991980. [DOI] [PubMed] [Google Scholar]
- 4.Rossi SE, Franquet T, Volpacchio M, Giménez A, Aguilar G. Tree-in-bud pattern at thin-section CT of the lungs: radiologic-pathologic overview. Radiographics. 2005;25:789–801. doi: 10.1148/rg.253045115. [DOI] [PubMed] [Google Scholar]
- 5.Gosset N, Bankier AA, Eisenberg RL. Tree-in-bud pattern. AJR Am J Roentgenol. 2009;193:W472–W477. doi: 10.2214/AJR.09.3401. [DOI] [PubMed] [Google Scholar]
- 6.Verma N, Chung JH, Mohammed TL. “Tree-in-bud sign”. J Thorac Imaging. 2012;27:W27. doi: 10.1097/RTI.0b013e31824643ae. [DOI] [PubMed] [Google Scholar]
- 7.Li Q, Fan X, Huang XT, Luo TY, Chu ZG, Chen L, et al. Tree-in-bud pattern in central lung cancer: CT findings and pathologic correlation. Lung Cancer. 2015;88:260–266. doi: 10.1016/j.lungcan.2015.03.009. [DOI] [PubMed] [Google Scholar]
- 8.Tack D, Nollevaux MC, Gevenois PA. Tree-in-bud pattern in neoplastic pulmonary emboli. AJR Am J Roentgenol. 2001;176:1421–1422. doi: 10.2214/ajr.176.6.1761421. [DOI] [PubMed] [Google Scholar]
- 9.Franquet T, Giménez A, Prats R, Rodríguez-Arias JM, Rodríguez C. Thrombotic microangiopathy of pulmonary tumors: a vascular cause of tree-in-bud pattern on CT. AJR Am J Roentgenol. 2002;179:897–899. doi: 10.2214/ajr.179.4.1790897. [DOI] [PubMed] [Google Scholar]
- 10.Li Ng Y, Hwang D, Patsios D, Weisbrod G. Tree-in-bud pattern on thoracic CT due to pulmonary intravascular metastases from pancreatic adenocarcinoma. J Thorac Imaging. 2009;24:150–151. doi: 10.1097/RTI.0b013e3181972350. [DOI] [PubMed] [Google Scholar]
- 11.Moon JW, Lee HY, Han J, Lee KS. Tree-in-bud sign as a manifestation of localized pulmonary lymphatic metastasis from a pancreas cancer. Intern Med. 2011;50:3027–3029. doi: 10.2169/internalmedicine.50.5941. [DOI] [PubMed] [Google Scholar]
- 12.Hansell DM, Bankier AA, MacMahon H, McLoud TC, Müller NL, Remy J. Fleischner Society: glossary of terms for thoracic imaging. Radiology. 2008;246:697–722. doi: 10.1148/radiol.2462070712. [DOI] [PubMed] [Google Scholar]
- 13.Heo JN, Choi YW, Jeon SC, Park CK. Pulmonary tuberculosis: another disease showing clusters of small nodules. AJR Am J Roentgenol. 2005;184:639–642. doi: 10.2214/ajr.184.2.01840639. [DOI] [PubMed] [Google Scholar]
- 14.Ko JM, Park HJ, Kim CH. Clinicoradiologic evidence of pulmonary lymphatic spread in adult patients with tuberculosis. AJR Am J Roentgenol. 2015;204:38–43. doi: 10.2214/AJR.14.12908. [DOI] [PubMed] [Google Scholar]
- 15.Heitzman ER. The lung: radiologic pathologic correlations. 2nd ed. St Louis, MO: Mosby; 1984. pp. 4–9. [Google Scholar]
- 16.Itoh H, Tokunaga S, Asamoto H, Furuta M, Funamoto Y, Kitaichi M, et al. Radiologic-pathologic correlations of small lung nodules with special reference to peribronchiolar nodules. AJR Am J Roentgenol. 1978;130:223–231. doi: 10.2214/ajr.130.2.223. [DOI] [PubMed] [Google Scholar]
- 17.Reid L, Simon G. The peripheral pattern in the normal bronchogram and its relation to peripheral pulmonary anatomy. Thorax. 1958;13:103–109. doi: 10.1136/thx.13.2.103. [DOI] [PMC free article] [PubMed] [Google Scholar]
- 18.Hunter RL. Pathology of post primary tuberculosis of the lung: an illustrated critical review. Tuberculosis (Edinb) 2011;91:497–509. doi: 10.1016/j.tube.2011.03.007. [DOI] [PMC free article] [PubMed] [Google Scholar]
- 19.Akira M, Kitatani F, Lee YS, Kita N, Yamamoto S, Higashihara T, et al. Diffuse panbronchiolitis: evaluation with high-resolution CT. Radiology. 1988;168:433–438. doi: 10.1148/radiology.168.2.3393662. [DOI] [PubMed] [Google Scholar]
- 20.Nakatsu M, Hatabu H, Morikawa K, Uematsu H, Ohno Y, Nishimura K, et al. Large coalescent parenchymal nodules in pulmonary sarcoidosis: “sarcoid galaxy” sign. AJR Am J Roentgenol. 2002;178:1389–1393. doi: 10.2214/ajr.178.6.1781389. [DOI] [PubMed] [Google Scholar]
- 21.Mays TJ. Pulmonary consumption, pneumonia, and allied diseases of the lungs: their etiology, pathology and treatment, with a chapter on physical diagnosis. 1st ed. New York, NY: E.B. Treat & Co.; 1901. pp. 247–288. [Google Scholar]
- 22.Gunn FD. Tuberculosis. In: Anderson WAD, editor. Pathology. 4th ed. St Louis, MO: C.V. Mosby Company; 1961. pp. 246–263. [Google Scholar]
- 23.Haque AK. The pathology and pathophysiology of mycobacterial infections. J Thorac Imaging. 1990;5:8–16. doi: 10.1097/00005382-199004000-00004. [DOI] [PubMed] [Google Scholar]
- 24.Basaraba RJ, Smith EE, Shanley CA, Orme IM. Pulmonary lymphatics are primary sites of Mycobacterium tuberculosis infection in guinea pigs infected by aerosol. Infect Immun. 2006;74:5397–5401. doi: 10.1128/IAI.00332-06. [DOI] [PMC free article] [PubMed] [Google Scholar]
- 25.Kim WS, Choi JI, Cheon JE, Kim IO, Yeon KM, Lee HJ. Pulmonary tuberculosis in infants: radiographic and CT findings. AJR Am J Roentgenol. 2006;187:1024–1033. doi: 10.2214/AJR.04.0751. [DOI] [PubMed] [Google Scholar]
- 26.Kim WS, Moon WK, Kim IO, Lee HJ, Im JG, Yeon KM, et al. Pulmonary tuberculosis in children: evaluation with CT. AJR Am J Roentgenol. 1997;168:1005–1009. doi: 10.2214/ajr.168.4.9124105. [DOI] [PubMed] [Google Scholar]
- 27.Miller WT, Jr, Panosian JS. Causes and imaging patterns of tree-in-bud opacities. Chest. 2013;144:1883–1892. doi: 10.1378/chest.13-1270. [DOI] [PubMed] [Google Scholar]


