Abstract
To examine the molecular processes that lead to light-induced retinal degeneration, mutant mice deficient in arrestin and rhodopsin kinase were raised in the dark and then subjected to relatively low doses of white light. The kinetics of the subsequent induction of apoptosis, change in mRNA transcript level, and photoreceptor cell death were monitored. Analysis of transcript profiles identified clusters of genes that responded differently to illumination, including a cluster of photoreceptor-specific genes that showed marked decreases in levels long before morphological damage could be readily ascertained. The behaviors of other gene clusters demonstrate the coordinate induction of stress gene responses early in the course of irradiation. There was little, if any, change in transcript levels corresponding to genes associated with the initiation of apoptosis or antiapoptotic effects. Transcript analysis provides insight into the patterns of gene expression that are associated with the different stages of retinal degeneration in this model system.
Exposure to light can induce photoreceptor cell death and retinal degeneration in a variety of animals (1, 2). The extent of light damage highly depends on the light intensity, wavelength, and manner in which the animals are exposed to light. Nutrition, stress, age, previous history of light exposure, continuous versus cyclic light, and the genetic background of the animals all play important roles in determining the extent and nature of the damage (3–7). Under certain conditions the absence of specific genes, e.g., c-fos and Rpe65 (8, 9), can prevent light-induced degeneration, whereas the absence of other genes, e.g., arrestin and rhodopsin kinase (10, 11), can sensitize the retina to light damage. Specific growth factors have been shown to be involved both in increasing cell death and in rescuing cells from the effects of light-induced damage (12, 13). In addition to light induction, photoreceptor cell death can result from a variety of mutations in components of the pathway involved in generating the phototransduction cascade (14, 15). Many different processes have been suggested to account for light-induced degeneration, including rhodopsin regeneration and processing (16–18), induction of free radical formation (19), interactions between photoreceptor cells and other cells in the retina (12), and the formation of toxic products resulting from stimulation of the phototransduction cascade (20). Furthermore, it has been suggested that light damage may also play a role in late-onset retinal and macular degeneration diseases (21–23). It has been difficult to determine the specific molecular mechanisms responsible for the induction of apoptotic cell death and retinopathy under different conditions because of the complexity of the processes involved. There are presumably different molecular and biochemical events that can induce subsequent apoptosis, but the molecular mechanisms that initiate the process are not readily observed. In addition, the major assays that have been used to examine the process involve measuring changes in gross retinal morphology. Thus the ultimate degeneration that is far removed from causal events is assessed as the end point. Changes in the protocol for irradiation where light is applied over a relatively short interval and the animals are then put in the dark to allow damage to develop have been used (8) to try to separate the initiation processes from the degenerative processes. However, this regimen requires the application of a relatively large dose of irradiation, and again the immediate effects cannot easily be measured.
To better determine the molecular and genetic processes involved, we propose to use mutant mice that are deficient in the regulation of the phototransduction cascade and are rendered highly sensitive to light damage. We have generated mutants deficient in arrestin and rhodopsin kinase. When the animals are raised in the dark they have normal retinal morphology. However, when exposed to continuous light they show rapid induction of photoreceptor cell death that appears to be the result of apoptosis (10, 11). The use of these mutant mice allows us to synchronize the initiation of light damage by raising the animals in the dark and initiating the experiment by using moderate levels of illumination. The rapid degeneration provides an opportunity to study the kinetics of retinal degeneration in a reproducible fashion over a relatively short time period. The second approach we have taken to the analysis of this complex process is to use oligonucleotide microarrays to measure changes in RNA transcript levels as a function of time of exposure to light. Transcript analysis provides one measure of the molecular changes induced by light damage and points a way to developing experimental paradigms to more clearly define the molecules involved in the initiation and subsequent apoptotic cell death of the photoreceptors, as well as the responses of other cells in the layered retina.
Materials and Methods
Animals.
All procedures involving mice were carried out in accordance with the statement by the Association for Research in Vision and Ophthalmology on the use of animals in ophthalmic and vision research. Arrestin and rhodopsin kinase knockout mice were generated (11, 24). These mice were crossed to each other, and the double-deficient (arrestin and rhodopsin kinase) mice were intercrossed for many generations. The mice were maintained as double mutants and reared in the dark. Wild-type mice were derived from an initial cross of 129sv and C57BL/6. These mice were intercrossed and also were reared in the dark. The mice used in this study ranged in age from 6 to 10 weeks.
Light Illumination.
To induce retinal degeneration with light, mice reared in the dark were placed in aluminum foil-wrapped polycarbonate cages that were covered with stainless steel wire tops, and the mice were supplied with food and water at the bottom of the cage. Constant illumination of 200 ft-c was generated by diffuse, cool, white fluorescent lamps. The temperature was controlled at 25°C during irradiation.
Analysis of Retinal Morphology.
Eyes were enucleated from anesthetized mice. After lenses were fixed and removed, eyecups were fixed overnight in 2.5% glutaraldehyde/2% paraformaldehyde in 0.1 M phosphate buffer (pH 7.4). The eyecups were then fixed for 2 h in 1% osmium tetroxide before they were processed and embedded in Epon. Sections 1 μm in thickness were cut along the vertical meridian with the optic nerve and stained with 1% toluidine blue. Measurements of outer nuclear layer (ONL) thickness were made on one section from each mouse as described (7). Briefly, ONL thickness was surveyed by measuring nine 250-μm-long segments in each of the superior and inferior hemispheres of the retina, starting from the optic nerve head. Within each segment, ONL thickness was represented by averaging measurements from three points spaced 50 μm apart.
Microarray Probe Preparation.
The RNA samples were processed as recommended by Affymetrix (Santa Clara, CA). Briefly, total RNA was prepared from frozen retinas with the use of Trizol reagent (Life Technologies, Rockville, MD). After the Trizol extraction procedure, cleanup was carried out with a Qiagen RNeasy Mini Kit (Qiagen, Chatsworth, CA). Reverse transcription was performed on 10 μg of total retinal RNA with the use of SuperScript polymerase (Life Technologies) and an oligo-(dT)24 primer with a T7 RNA polymerase promoter (Genset, La Jolla, CA). After second-strand synthesis, the double-stranded cDNA was cleaned up by extraction with phenol-chloroform-isoamyl alcohol and recovered by ethanol precipitation. An RNA Transcript Labeling Kit (Enzo Diagnostics) was used for the production of hybridizable biotin-labeled RNA targets by in vitro transcription from T7 RNA polymerase promoters. The cDNA prepared from total RNA was used as a template in the presence of a mixture of unlabeled ATP, CTP, GTP, and UTP and biotinylated CTP and UTP. In vitro transcription products were purified with an RNeasy Mini Kit (Qiagen) to remove unincorporated NTPs and fragmented to sizes from ≈≫50 to 200 bases by incubation at 94°C for 35 min. The fragmented sample cRNA (complementary RNA) was stored at −20°C until the hybridization was performed.
Hybridization and Scan.
Mouse GeneChips Mu11K and Mu19K, or U74 (Affymetrix) were used. The biotinylated cRNA was hybridized for 16 h at 40°C to a set of oligonucleotide arrays in the GeneChip Fluidics Station 400 (Affymetrix). The final concentration of fragmented cRNA was 0.28–0.35 μg/μl in the hybridization solutions. After hybridization, the GeneChip array underwent a series of stringency washes and was stained with streptavidin-conjugated phycoerythrin. Probe arrays were scanned with a Hewlett–Packard Scanner. Finally, the results were analyzed with genechip analysis software (Affymetrix), and the fold change between the hybridization intensities of reference and test samples was obtained.
Quantification of Apoptosis in the Retina.
Light-induced apoptosis in the retina was quantified with a cell death detection ELISA assay kit (Roche Molecular Biochemicals) that quantifies the soluble mono- and oligonucleosomes released in the cell lysate as a function of apoptosis (12, 25). One retina was homogenized with a 26-½ gauge needle in 200 μl of phosphate buffer with 1 mM PMSF. The lysate was centrifuged at 15,000 × g for 10 min at room temperature. One hundred microliters of supernatant was diluted 10 times with lysis buffer, and the rest of the supernatant was saved for the measurement of protein levels with the Bio-Rad protein assay procedure. Twenty microliters of diluted supernatant was used in the ELISA measurement according to the manufacturer's instructions.
Real-Time Quantitative Reverse Transcription–PCR (RT-PCR).
Real-time quantitative RT-PCR was performed on the GeneAmp 5700 Sequence Detection System (Applied Biosystems) by monitoring of the increase in fluorescence caused by the binding of SYBR Green to double-stranded DNA. Total RNA was prepared from frozen mouse retinas with the use of Trizol reagent (Life Technologies). To prepare cDNA templates, 50–100 ng of total RNA was mixed with 5.5 mM MgCl2, 0.5 mM each dNTP, 2.5 μM random hexamer, 0.4 unit/μl RNase inhibitor, and 1.25 units/μl MultiScribe reverse transcriptase from TaqMan Reverse Transcription Reagents (Applied Biosystems). RT was incubated at 25°C for 10 min and at 48°C for 30 min and inactivated at 95°C for 5 min. The PCR primers were designed with primer express software (Applied Biosystems), and their specificity in gene amplification was confirmed by measurement of the size and purity of the PCR product by 4% NuSieve agarose gel electrophoresis. For a 50-μl PCR, 4 μl cDNA template was mixed with 300 nM each of forward and reverse primers and 2× SYBR Green PCR Master Mix (Applied Systems). The reaction was first incubated at 50°C for 2 min, then at 95°C for 10 min, followed by 40 cycles of 95°C for 15 s and 60°C for 1 min. Each gene-specific PCR was performed in triplicate.
Results
In previous experiments we showed separately that the absence of arrestin (10) or the absence of rhodopsin kinase (11) individually sensitizes the photoreceptors of mutant mice to the induction of cell death by light. We crossed these mutant mice and generated doubly deficient animals. In the double mutants the major, rapid, reproducible mechanisms for inactivating rhodopsin have been eliminated. Extended activation of the phototransduction cascade is presumably responsible for initiating the subsequent processes that lead to cell death (20). Mice homozygous for both the arrestin deficiency and the rhodopsin kinase deficiency were raised in the dark and transferred to conditions of moderate-intensity, continuous light exposure. After 2, 5, 8, 16, 24, 48, or 96 h of continuous light, retinas were removed, and they were sectioned, stained, and used for measurements of nucleosome release, or harvested and extracted for total RNA to be used for microarray analysis. In many cases, a portion of the RNA sample used for DNA microarray analysis was used for real-time quantitative PCR analysis for specific mRNA transcripts. Control animals with similar genetic backgrounds that were homozygous wild type with respect to rhodopsin kinase and arrestin were raised in the dark and exposed to light in the same manner as the experimental animals and were used as controls.
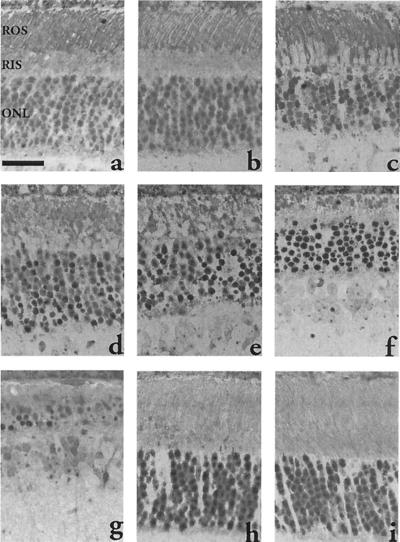
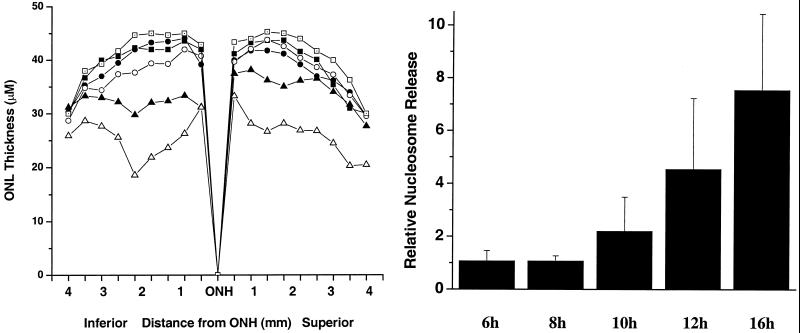
Fig. 1 shows retinal sections from animals after different times of light exposure. Little or no damage is discernible at this level of resolution by morphological examination after 5 h of illumination. However, after 8 h one can begin to see pycnotic nuclei and evidence of cellular damage. By 16 h this damage is extensive, and it continues to increase, so that by 48 h more than half of the photoreceptor cells are obliterated, and finally, after 96 h, there are few photoreceptor cells left. On the other hand, the wild-type animals show practically no change in retinal morphology after 96 h of irradiation. To further measure these changes in the entire retina, the thickness of the ONL of the retina was measured from sections through the vertical meridian across the retina (Fig. 2A). In a previous study, Chen et al. (10) found that arrestin knockout mice showed rapid photoreceptor degeneration when exposed to constant light and that the loss of photoreceptors was greater in the inferior than in the superior hemispheres of the eyes. Our study shows a similar pattern. The basis for this asymmetry is not clear.
Figure 1.
Light micrographs of central retinas of wild-type and arrestin/rhodopsin kinase double-knockout mice that were exposed to 200 ft-c white fluorescent light for various time. (a) Retina from double-knockout mice raised in the dark shows normal morphology. (b) Five hours after light exposure, mutant retina shows no signs of damage. (c) Eight hours after light exposure, overall retinal structure of mutant mice is preserved; however, early signs of apoptosis, such as condensed cytoplasm of rod inner segments (RIS) and scattered pyknotic nuclei in the ONL can be found. (d) By 16 h of light exposure, both the rod outer segment (ROS) and the rod inner segment are disorganized, and pyknotic nuclei are abundant in the ONL in mutant mice. However, the ONL still contains about 9–10 rows of nuclei as the normal morphology. Continuous exposure of mutant mice to light for 24 h (e), 48 h (f), and 96 h (g) begins to shorten the ONL, which has less than half of the initial number of nuclei left by 96 h. In contrast, the retina of wild-type mice that are exposed to the same light condition for 96 h (h) shows no signs of damage compared with the retina before light exposure (i). (Scale bar, 30 μm.)
Figure 2.
(A) Measurements of ONL thickness along the vertical meridian of the retina from the optic nerve head (ONH) to the ora serrata in arrestin/rhodopsin kinase double-knockout mice and wild-type mice after exposure to constant light for various times: mutant 8 h (■), mutant 16 h (●), mutant 24 h (○), mutant 48 h (▴), mutant 96 h (▵), and wild-type 96 h (□). (B) Light-induced retinal apoptosis in arrestin/rhodopsin kinase double-knockout mice. Mutant mice raised in the dark were exposed to 200 ft-c white fluorescent light for up to 16 h. The apoptosis in the retinas was measured by nucleosome release assay. The values are presented as means ± SD from 4–8 mice for each time point.
Staining and morphological assays suggested that, as early as 8 h after the initiation of irradiation, changes in nuclear morphology could be seen. To get other correlates of apoptotic cell death, we used the nucleosome release assay (12, 25). Entire retinas from irradiated mice were taken for each sample point, and damage to DNA resulting from the initiation of apoptosis was gauged by comparing nucleosome release at different times after illumination. Nucleosome release could be clearly seen by 10 h, and there was a very robust nucleosome release response after 16 h of irradiation, suggesting high levels of apoptosis.
For the oligonucleotide microarray experiments Affymetrix mouse chips, Mu 11k and Mu 19k, were used. In addition, the U74 set, which is a revision of the Mu 11k and Mu 19k set, was used. All together, 34,325 probe sets were surveyed. Of those, 14,510 gave discernible and clear signals (i.e., 42.3%), and of those giving signals, 3,877 or 11.3% were changed for at least one of the time points in the experiments. A total of 2,673 probe sets displayed an increase or decrease in gene expression greater than 2-fold. The largest number of differentially expressed genes among the samples was observed at 16 h of irradiation. All of the data including the wild-type irradiated controls are presented at our web site (http://microarray.caltech.edu/pubs/).
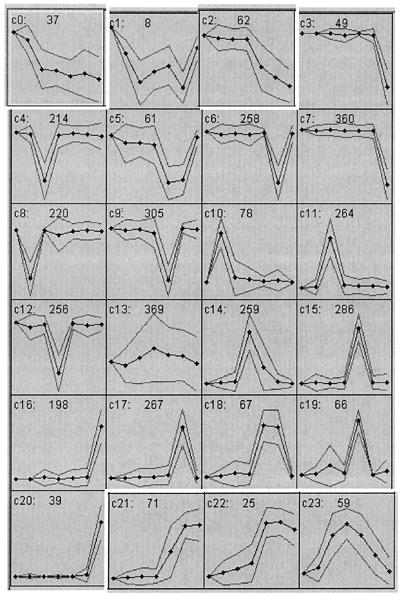
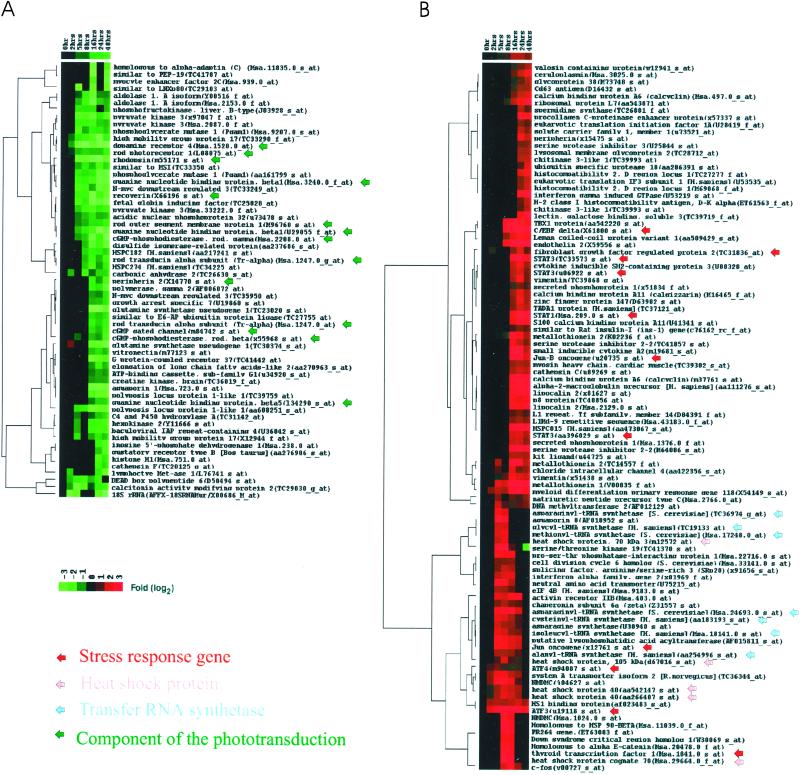
The data obtained from the irradiated mutant retinas were assembled and analyzed by the self-organizing map method described by Tamayo et al. (26). Twenty-four cluster groups were used (Fig. 3). The kinetic properties of many of these gene clusters suggest that the behavior of members of the cluster reflect the same initiating event. Thus, for example, cluster c0 represents transcripts whose levels continuously decrease from the time of initiation of illumination. The transcripts in cluster c2, on the other hand, maintain a relatively constant level for 8 h and then decrease monotonically. Fig. 4 shows the results of a hierarchical clustering of these data by the method described by Eisen et al. (27). A similar result emerges from hierarchical clustering of the results of all 3,878-probe measurements. Many of the genes found in the cluster c0 and c2 (Fig. 3) correspond to well-known components of the phototransduction cascade. Many of these genes are specifically expressed only in rod photoreceptor cells. The marked decrease in these transcript levels occurs in many cases well before morphological damage can be observed in retinal sections.
Figure 3.
Self-organizing map clusters using the 3,877 regulated expression profiles. The number of clusters was specified as 24, and a self-organizing map algorithm grouped them into discrete clusters. c0 to c23 indicate the cluster number, and the number in the top middle of each box indicates the number of probes in each cluster. Time points are 0, 2, 5, 8, 16, 24, and 48 h, represented by black dots in the graphs. Thick lines indicate the mean expression values, and thin lines indicate standard deviation.
Figure 4.
Hierarchical clustering analysis of experimental expression profiles. The genes whose expression was repressed (A) or induced (B) in an interesting pattern were clustered by the correlation of the genes. Genes are plotted along the horizontal axis. Experiments are plotted along the y axis. Increases or decreases in mRNA levels are represented as shades of red or green, respectively.
Cluster c23 (Fig. 3) includes transcripts that increase after 2 h of irradiation. Their levels peak and then decrease. Other transcripts in clusters c21 and c22 (Fig. 3) increase after 8 h of irradiation. The results of hierarchical clustering of these genes are shown in Fig. 4. Many of the genes are involved in heat shock and stress responses. Other transcription factors that are known to be associated with retinal degeneration, e.g., c-fos and c-jun, are found to increase early. Interestingly, a large family of tRNA synthetases follows the same pattern as the heat shock genes.
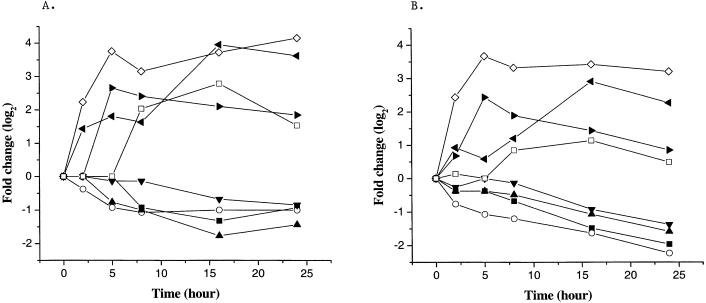
To further confirm the microarray results we used quantitative RT-PCR with oligonucleotides that were specific for some of the genes that showed kinetic patterns of increase or decrease as a function of time of irradiation. Selected results are shown in Fig. 5. They indicate, as others have found (28, 29), that, although the precise fold change is not identical, the patterns of change were similar when assessed by these two independent methods. Furthermore, in control experiments with wild-type mice raised in the dark and subsequently irradiated in the same way as the mutant mice, 2.5% of the probe sets detected significant changes in transcript levels, in contrast to the microarray results obtained with irradiated mutant mice, where 11.3% of the probe sets detected changes. Almost all of the changes observed in the wild-type control were rapid and transient, and there was little or no overlap with the cluster pattern observed with the mutant mice. All of the data are shown on our web site (http://microarray.caltech.edu/pubs/).
Figure 5.
Comparison of array results (A) with real-time quantitative RT-PCR profiles (B). The same set of retina total RNA was used for quantitative RT-PCR profiles. ■, Transducin alpha; ○, phosducin; ▴, phosphodiesterase gamma; ▾, rim; ◊, activating transcription factor 3; ◂, myeloid differentiation primary response gene 118; ▸, c-Jun; □, c-Fos.
Discussion
Analysis of the results of single-photon absorption experiments indicates that both arrestin and rhodopsin kinase contribute directly to attenuation of the ability of activated rhodopsin to engage the phototransduction cascade and that eliminating both genes leads to a prolonged response. It is this elimination of the two genes (10, 11, 20) that presumably initiates the sensitivity of the photoreceptors to cell death. The effect of irradiation is clearly seen on levels of mRNA that are photoreceptor-specific in the experimental animals but not in the controls. Levels of rhodopsin, recoverin, cGMP-specific rod phosphodiesterase gamma, rod photoreceptor 1, rod outer segment membrane protein 1, and message corresponding to other photoreceptor-specific proteins begin to decrease rapidly well before there is any readily discernible morphological effect on photoreceptor cells (cluster c0). There are also photoreceptor-specific genes whose transcript levels initially decrease slowly but show marked decreases after 8 h of irradiation (cluster c2). Cluster c2 contains rod transducin alpha, cGMP gated channel, cGMP-specific rod phosphodiesterase beta, peripherin 2, etc. On the other hand, there are marked increases in transcript levels corresponding to stress response genes or early response genes, such as DNA damage-inducible transcript 3, c-Fos, Jun, activating transcription factor 4, by 5 h of irradiation (cluster c23). Transcripts corresponding to a variety of heat shock proteins, DNA repair genes, and genes that encode methylating enzymes are coordinately increased, and their levels begin to decrease after 8 h. On the other hand, mRNAs corresponding to a number of transcription factors, such as signal transducer and activator of transcription 1 and 3, activating transcription factor 3, CCAAT/enhancer binding protein, Jun-B, and myeloid differentiation primary response gene 118, initially increase slowly but show a marked increase after 8 h (clusters 21 and 22). It is not clear that all of these changes are occurring in photoreceptors. There may be marked changes in neighboring cells, particularly after 16 h of irradiation, when we can biochemically and morphologically detect cell loss. Many of the probe sets in the arrays that we used correspond to expressed sequence tags or to unannotated genes. The association of changes in the levels of transcripts from these genes with specific gene clusters may help in the assignment of their function.
We can begin to divide the changes that we observe into early (<8 h), middle (8–24 h), and late (>24 h) changes and focus more clearly on each stage in the process. In the early events, 0–8 h of irradiation, the predominant effects are presumably induced directly by the effects of light on the phototransduction cascade. Little or no increase in nucleosome release is observed during this period (Fig. 2B). It is interesting that the transcripts corresponding to the genes known to be involved in the induction of apoptosis show little or no change in transcript levels. Caspases 1, 2, 3, 6, 7, 8, 11, 12, and 14 all were detected but showed little if any change over the course of the experiment. Other genes, e.g., Bcl-2, Bcl-w, Bag, Bax, Bak, Bad, Bid, and others known to be pro- or antiapoptotic were also found to be unchanged, suggesting that the apoptotic system is not induced and regulated at the level of transcription but rather by biochemical events affecting the activities of proteins that are normally present. The events that induce the initiation of apoptosis could occur as early as the first few hours after exposure to light. Many general transcription factors and “immediate early gene” (e.g., c-myc, c-fos, and jun family) transcripts were affected early in the course of irradiation. Genes that encode functions that are involved in message translation, tRNA synthetases, and IFN-related genes were also markedly affected during the early period.
The period after 16 h of irradiation (corresponding to the “middle period”) includes the biochemical events that are part of the process of apoptosis (e.g., nucleosome release is detected). We have shown that if the animals are removed from irradiation after 5 h (unpublished observations) and put back in the dark, there are only low levels of morphological damage seen after 5 days. On the other hand, after 16 h of irradiation permanent damage is seen even if the animals are maintained in the dark. Thus we also may be able to distinguish between permanent and reversible events. Certainly after 24 h of irradiation a large proportion of the photoreceptor cells have been eliminated. The level of irreversible damage to the other cells in the layered retina is not clear.
The precise nature of the events that induce apoptosis is not revealed by these experiments; however, they provide a series of markers, i.e., specific patterns of change in gene expression that result from the induction events, and help divide the processes so that they can be analyzed in terms of some of the molecular events that accompany the induction of cell death. We can now begin to modify the conditions of the experiment, e.g., use different mutations, different light intensities, and discontinuous illumination, and follow patterns of change in transcript levels to parse out the different mechanisms involved in light-induced degeneration.
Acknowledgments
We thank Rebecca Udwary and Hong Dang for their invaluable assistance with data analysis and setting up the web site. This work was supported by National Institutes of Health Grant AG 12288.
Abbreviations
- ONL
outer nuclear layer
- RT-PCR
reverse transcription–PCR
References
- 1.Oranisciak D T, Winkler B S. Prog Retinal Eye Res. 1994;13:1–29. [Google Scholar]
- 2.Reme C E, Hafezi F, Marti A, Munz K, Reinboth J J. In: The Retinal Pigment Epithelium. Marmor M F, Wolfensberger T J, editors. Oxford: Oxford Univ. Press; 1998. pp. 563–586. [Google Scholar]
- 3.Noell W K, Albrecht R. Science. 1971;172:76–79. doi: 10.1126/science.172.3978.76. [DOI] [PubMed] [Google Scholar]
- 4.O'Steen W K, Donnelly J E. Invest Ophthalmol Visual Sci. 1982;22:1–7. [PubMed] [Google Scholar]
- 5.Penn J S, Howard A G, Williams T P. In: Retinal Degeneration: Experimental and Clinical Studies. LaVail M M, Hollyfield J G, Anderson R E, editors. New York: Liss; 1985. pp. 439–447. [Google Scholar]
- 6.Li S, Chang C J, Abler A S, Fu J, Tso M O, Lam T T. Curr Eye Res. 1996;15:914–922. doi: 10.3109/02713689609017635. [DOI] [PubMed] [Google Scholar]
- 7.LaVail M M, Gorrin G M, Repaci M A, Thomas L A, Ginsberg H M. Invest Ophthalmol Visual Sci. 1987;28:1043–1048. [PubMed] [Google Scholar]
- 8.Hafezi F, Steinbach J P, Marti A, Munz K, Wang Z Q, Wagner E F, Aguzzi A, Reme C E. Nat Med. 1997;3:346–349. doi: 10.1038/nm0397-346. [DOI] [PubMed] [Google Scholar]
- 9.Grimm C, Wenzel A, Hafezi F, Yu S, Redmond T M, Reme C E. Nat Genet. 2000;25:63–66. doi: 10.1038/75614. [DOI] [PubMed] [Google Scholar]
- 10.Chen J, Simon M I, Matthes M T, Yasumura D, LaVail M M. Invest Ophthalmol Visual Sci. 1999;40:2978–2982. [PubMed] [Google Scholar]
- 11.Chen C-K, Burns M E, Spencer M, Niemi G A, Chen J, Hurley J B, Baylor D A, Simon M I. Proc Natl Acad Sci USA. 1999;96:3718–3722. doi: 10.1073/pnas.96.7.3718. [DOI] [PMC free article] [PubMed] [Google Scholar]
- 12.Harada T, Harada C, Nakayama N, Okuyama S, Yoshida K, Kohsaka S, Matsuda H, Wada K. Neuron. 2000;26:533–541. doi: 10.1016/s0896-6273(00)81185-x. [DOI] [PubMed] [Google Scholar]
- 13.LaVail M M, Unoki K, Yasumura D, Matthes M T, Yancopoulos G D, Steinberg R H. Proc Natl Acad Sci USA. 1992;89:11249–11253. doi: 10.1073/pnas.89.23.11249. [DOI] [PMC free article] [PubMed] [Google Scholar]
- 14.Lem J, Krasnoperova N V, Calvert P D, Kosaras B, Cameron D A, Nicolo M, Makino C L, Sidman R L. Proc Natl Acad Sci USA. 1999;96:736–741. doi: 10.1073/pnas.96.2.736. [DOI] [PMC free article] [PubMed] [Google Scholar]
- 15.Lolley R N, Rong H, Craft C M. Invest Ophthalmol Visual Sci. 1994;35:358–362. [PubMed] [Google Scholar]
- 16.Wenzel A, Reme C E, Williams T P, Hafezi F, Grimm C. J Neurosci. 2001;21:53–58. doi: 10.1523/JNEUROSCI.21-01-00053.2001. [DOI] [PMC free article] [PubMed] [Google Scholar]
- 17.Alloway P G, Howard L, Dolph P J. Neuron. 2000;28:129–138. doi: 10.1016/s0896-6273(00)00091-x. [DOI] [PubMed] [Google Scholar]
- 18.Kiselev A, Socolich M, Vinos J, Hardy R W, Zuker C S, Ranganathan R. Neuron. 2000;28:139–152. doi: 10.1016/s0896-6273(00)00092-1. [DOI] [PubMed] [Google Scholar]
- 19.Travis G H. Am J Hum Genet. 1998;62:503–508. doi: 10.1086/301772. [DOI] [PMC free article] [PubMed] [Google Scholar]
- 20.Fain G L, Lisman J E. Invest Ophthalmol Visual Sci. 1999;40:2770–2772. [PubMed] [Google Scholar]
- 21.Taylor H R, Munoz B, West S, Bressler N M, Bressler S B, Rosenthal F S. Trans Am Ophthalmol Soc. 1990;88:163–178. [PMC free article] [PubMed] [Google Scholar]
- 22.Talor H R, West S, Munoz B, Rosenthal F S, Bressler S B, Bressler N M. Arch Ophthalmol. 1992;110:99–104. doi: 10.1001/archopht.1992.01080130101035. [DOI] [PubMed] [Google Scholar]
- 23.Cruickshanks K J, Klein R, Klein B E. Arch Ophthalmol. 1993;111:514–518. doi: 10.1001/archopht.1993.01090040106042. [DOI] [PubMed] [Google Scholar]
- 24.Xu J, Dodd R L, Makino C L, Simon M I, Baylor D A, Chen J. Nature (London) 1997;389:505–509. doi: 10.1038/39068. [DOI] [PubMed] [Google Scholar]
- 25.Leist M, Gantner F, Bohlinger I, Germann P G, Tiegs G, Wendel A. J Immunol. 1994;153:1778–1788. [PubMed] [Google Scholar]
- 26.Tamayo P, Slonim D, Mesirov J, Zhu Q, Kitareewan S, Dmitrovsky E, Lander E S, Golub T R. Proc Natl Acad Sci USA. 1999;96:2907–2912. doi: 10.1073/pnas.96.6.2907. [DOI] [PMC free article] [PubMed] [Google Scholar]
- 27.Eisen M B, Spellman P T, Brown P O, Botstein D. Proc Natl Acad Sci USA. 1998;95:14863–14868. doi: 10.1073/pnas.95.25.14863. [DOI] [PMC free article] [PubMed] [Google Scholar]
- 28.Iyer V R, Eisen M B, Ross D T, Schuler G, Moore T, Lee J C, Trent J M, Staudt L M, Hudson J, Jr, Boguski M S, et al. Science. 1999;283:83–87. doi: 10.1126/science.283.5398.83. [DOI] [PubMed] [Google Scholar]
- 29.Xu Y, Ehringer M, Yang F, Sikela J M. Alcohol Clin Exp Res. 2001;25:810–818. [PubMed] [Google Scholar]


