

Abstract
Urbanization is a global phenomenon with profound effects on the ecology and evolution of organisms. We examined the relative roles of natural selection, genetic drift and gene flow in influencing the evolution of white clover (Trifolium repens), which thrives in urban and rural areas. Trifolium repens exhibits a Mendelian polymorphism for the production of hydrogen cyanide (HCN), a potent antiherbivore defence. We quantified the relative frequency of HCN in 490 populations sampled along urban–rural transects in 20 cities. We also characterized genetic variation within 120 populations in eight cities using 16 microsatellite loci. HCN frequency increased by 0.6% for every kilometre from an urban centre, and the strength of this relationship did not significantly vary between cities. Populations did not exhibit changes in genetic diversity with increasing urbanization, indicating that genetic drift is unlikely to explain urban–rural clines in HCN frequency. Populations frequently exhibited isolation-by-distance and extensive gene flow along most urban–rural transects, with the exception of a single city that exhibited genetic differentiation between urban and rural populations. Our results show that urbanization repeatedly drives parallel evolution of an ecologically important trait across many cities that vary in size, and this evolution is best explained by urban–rural gradients in natural selection.
Keywords: adaptive evolution, invasive species, parallel clines, plant defence, urban ecology
1. Introduction
Urbanization is among the most important anthropogenic disturbances affecting biotic and abiotic environments [1–3]. Approximately 3% of Earth's land surface is covered in urban development [4,5], and cities are continuing to expand throughout the world [6]. Recent evidence suggests that urbanization may be the dominant anthropogenic factor affecting the evolution of populations [7]. For example, changes in the environment caused by urbanization can alter natural selection and adaptive evolution [8]. Urban populations may also experience greater genetic drift because they are often smaller and more isolated than non-urban populations [9,10]. Finally, urban development can restrict dispersal and the movement of alleles across a landscape (i.e. gene flow), leading to greater genetic differentiation between populations [11,12]. Although the effects of urbanization on selection, genetic drift and gene flow have been studied individually in different systems, how these mechanisms interact to affect evolution across multiple cities of a single species has not been examined.
Environmental changes associated with urbanization can drive the evolution of novel adaptations within populations. Urban development leads to changes in multiple biotic and abiotic environmental factors, including increased pollution, warmer temperatures, more impervious surface and homogenization of communities [13]. These changes can alter natural selection on populations [8]. For example, coastal waters surrounding urban areas frequently have greater PCB concentrations, which can be lethal to fish [14]. This PCB contamination has imposed strong selection on at least two fish species (Microgadus tomcod and Fundulus heteroclitus), which has resulted in the evolution of resistance in aryl-hydrocarbon receptor genes [14,15]. Similarly, the abundance of buildings in Puerto Rico's cities has caused urban populations of the crested anole (Anolis cristatellus) to evolve longer limbs and stickier toe pads, which increases the ability of these lizards to adhere to and travel along smooth artificial surfaces in urban environments [16,17]. However, whether these effects of urbanization on natural selection and adaptive evolution are consistent across cities is poorly understood.
Urbanization can also have large effects on non-adaptive evolutionary processes, such as genetic drift. The construction of buildings and roads fragments natural habitats [18], which can isolate and reduce the size of existing populations, causing a population bottleneck [2,19]. Urban fragmentation and environmental change can also lead to local extirpation of urban populations and subsequent recolonization from non-urban populations. Such recolonization events are frequently associated with founder events in which new urban populations are established by a small number of individuals (e.g. [20]). Under both scenarios, population bottlenecks and founder events are expected to make populations more sensitive to stochastic changes in allele frequencies [7]. Recent simulations show that such neutral processes can lead to the evolution of phenotypic and genetic clines, which are typically and potentially erroneously attributed to adaptive evolution [21,22].
The effects of urbanization on fragmentation are also expected to affect gene flow between populations. Numerous studies suggest that major roads [23,24], buildings [10] and natural barriers [11] restrict gene flow within cities, whereas corridors of natural or restored habitat can facilitate gene flow in some organisms [25,26]. For example, red-backed salamander populations that persist in forest fragments within the oldest parts of Montreal, Canada, have genetically diverged following 300+ years of isolation with limited gene flow. By contrast, populations in, more recently, fragmented urban forests and contiguous non-urban forests show less genetic divergence. Most previous research on the effects of urbanization on gene flow has focused on patterns of genetic variation within and between populations in a single city [7]. It is therefore unclear whether the effects of urbanization on non-adaptive evolution (i.e. genetic drift and gene flow) generalize across cities, especially when cities vary in area, human population size and other features such as road and building density. If certain urban features restrict or facilitate gene flow, this may have important consequences for the ability of populations to genetically diverge and adapt to urban environments [27]. Thus, the study of population genetic structure across multiple cities can greatly advance our understanding of the effects of urbanization on evolution.
This paper expands on our recent research on urban evolution in white clover, Trifolium repens (Fabaceae). Trifolium repens is a perennial herbaceous plant, native to Eurasia and introduced globally to temperate environments [28]. This species exhibits a Mendelian polymorphism for the production of hydrogen cyanide (HCN), in which plants either produce HCN (cyanogenic) or lack the ability to produce HCN (acyanogenic) [29]. HCN is a potent antiherbivore chemical defence that reduces damage by many invertebrate and mammalian herbivores [30–32]. HCN also imposes an ecological cost on plants by reducing freezing tolerance [33–35]. We previously showed that the frequency of cyanogenic genotypes within populations decreased with urbanization across three large cities (Toronto, Boston and New York), whereas there was no change in a fourth city (Montreal) [36]. Experiments, temperature gradients and GIS implicated a role of reduced snow depth and colder minimum winter temperatures within city centres, ultimately selecting against HCN in favour of acyanogenic genotypes. The city that lacked a cline consistently had more snow in both urban and rural environments than the cities that showed clines. Our previous work did not resolve whether urban–rural clines in HCN are a phenomenon restricted to large metropolitan areas, or whether they may also occur in smaller cities and towns. The study by Thompson et al. [36] also did not provide any insights into the potential roles that genetic drift and gene flow may play in constraining or facilitating the evolution of HCN in response to urbanization. This latter gap is important because recent simulations show that neutral processes can independently lead to the evolution of lower HCN within cities, whereas high gene flow may prevent the evolution of such clines [21].
Here, we examine how natural selection, genetic drift and gene flow may affect HCN evolution in T. repens in response to urbanization. The first two questions we asked were: (1) does T. repens evolve parallel clines in HCN in response to urbanization, and (2) does the strength of urban–rural clines vary with city size? Answering question 1 allowed us to understand whether our earlier results [36] generalize to smaller cities and towns, such that T. repens populations consistently evolve lower HCN in urban than rural populations. In answering question 2, we expected that urban–rural clines would be strongest in large cities, either because environmental gradients are longer and stronger, and thus associated with a greater change in selection, or because the opportunity for population bottlenecks and reduced gene flow might be greater in large cities [27,37]. After testing the generality of urban–rural clines in HCN, we used 16 microsatellite molecular markers to characterize the population genetic structure of T. repens along urban–rural clines. These analyses answered two additional questions: (3) do urban populations have less genetic diversity than rural populations, and (4) are urban populations genetically differentiated from rural populations, after accounting for the effects of dispersal limitation (i.e. isolation-by-distance (IBD))? A loss of genetic diversity (Q3) would be expected if colonization of urban areas from rural populations was associated with population bottlenecks. We expected that genetic differentiation would be weakest between urban and rural populations of small cities (Q4) if gene flow between urban and rural populations was negatively related to city size [27]. Finally, recent reviews claim that native species frequently show greater genetic differentiation among urban populations because of habitat fragmentation leading to increased drift and decreased gene flow [7]. Whether this prediction applies to introduced species like T. repens, which thrive in urban environments, is unclear. This is the first study we are aware of that examines how selection, genetic drift and gene flow affect evolution across multiple urban environments.
2. Material and methods
(a). Study system
Our study focused on the evolution of T. repens along urban–rural transects across cities in south-central Ontario, Canada. Trifolium repens is introduced to North America, where it thrives in areas with regular grazing or mowing, including pastures, lawns and roadsides in urban and rural environments. Plants are self-incompatible, producing clusters of flowers that are packed into dense inflorescences pollinated by bees [38]. Plants also reproduce clonally through stems (i.e. stolons) that grow horizontally along the soil surface, and a single clone can occupy an area up to 1 m across [38].
The cyanogenesis polymorphism is controlled by two unlinked Mendelian inherited loci, CYP79D15 and Li. CYP79D15 is involved in the production of the cyanogenic glycosides linamarin and lotaustralin [29,39]. Li encodes the enzyme linamarase, which hydrolyses the cyanogenic glycoside to produce HCN [40,41]. The cyanogenic glycoside and linamarase are stored in different parts of the cell and come into contact to produce HCN when the tissue is damaged [29]. A plant requires a functional copy of both CYP79D15 and Li to produce HCN, and these alleles have dominant expression. Non-functional alleles occur at both loci and are caused by a partial or complete deletion of the exon [39,40,42]. Plants that are homozygous for a non-functional allele at either locus are acyanogenic. Multiple studies show that HCN is an effective defence against generalist herbivores [30–32]. Independent work also shows that HCN decreases tolerance to freezing, putatively through autotoxicity because HCN interferes with cellular respiration [33–35]. As a result of the joint effects of HCN in defence and reduced freezing tolerance, Daday [28,43] showed that the frequency of cyanogenic genotypes decreased at higher latitudes in Europe, North America and Japan.
South-central Ontario is a temperate climate dominated by agricultural land and interspersed cities and towns (hereafter referred to as ‘cities’). We restricted sampling to a single geographical area to minimize large-scale climatic variation (e.g. snow fall and temperature), while selecting cities to vary in characteristics that might influence selection, drift and gene flow [27]. We selected 20 cities that varied by two orders of magnitude in area and human population size, and by one order of magnitude in human population density (figure 1; electronic supplementary material, table S1). All city statistics were taken from the 2016 Canadian census data [44].
Figure 1.

Map of southern Ontario showing the location of the cities sampled. We sampled HCN frequency along transects in each of 20 cities and population genetic structure in eight of these cities (yellow text). The size of circles is scaled to city area. Further information on these populations is available in the electronic supplementary material, table S1. (Online version in colour.)
(b). Population sampling and hydrogen cyanide assays
In each city, we identified a linear transect that captured a gradient in urbanization, including urban (high percentage of area covered in buildings and roads), suburban (high density residential areas) and rural areas. Our transects were designed so that half of the distance of each transect passed from the city centre to the outer edge of the suburbs (hereafter referred to as ‘urban’), and an equal distance passed through rural areas. Since cities varied in size, the length of transects varied accordingly. We sampled between 20 and 40 sites within each city (mean 24.5), recording the latitude and longitude of sampling locations, with roughly half of the sites located in urban areas and the balance located in rural areas. Distances between adjacent sampling sites were adjusted based on the length of the transect, ranging from 150 to 500 m apart depending on city size. Collection sites included road boulevards, public parks, church yards, roadside ditches and residential lawns. In total, we sampled 490 sites across the 20 cities, and we treated individual sites as our unit of replication. We hereafter refer to sampling sites as ‘populations’. We sampled, on average, 20 plants per population (range 9–26) for a total of 9905 plants. To avoid sampling the same clone twice, plant samples were collected at a minimum of 3 m apart.
Each plant was assayed for the presence or absence of HCN using the Feigl–Anger assay method of Gleadow et al. [45]. Detailed methods for the assay are provided in the electronic supplementary material, text S1. The Feigl–Anger assay for HCN provides virtually identical results to PCR assays for the presence of dominant alleles at CYP79D15 and Li [30,39,40] and thus was an accurate method for screening cyanogenic genotypes. The data from the Feigl–Anger assay were used to calculate the relative frequency of cyanogenic plants (hereafter ‘HCN frequency’) within populations.
(c). City characteristics
We quantified several characteristics from each city as potential explanatory factors for the evolution of HCN and population genetic variation. To understand how urbanization along the transect was associated with evolution of HCN and population genetic variation, we calculated the distance of each population from the urban centre. Since equal halves of each transect were in urban and rural areas, yet transects varied in length, we standardized the length of each city's transect to a minimum value of 0 (city centre) and a maximum of 1 (furthest rural population). This ensured that the most urban part of each transect (value = 0), the suburban–rural transition area (value ∼0.5) and the furthest rural section of the transect (value = 1), were compared on an identical scale across all cities. Qualitatively identical results and conclusions were found when we used non-standardized distance (electronic supplementary material, table S2). Importantly, standardized distance was a strong predictor of % impervious surface (F1,111 = 225.03, p = 1.68 × 10⁻²⁸, R2 = 0.64, N = 120) and the number of buildings (F1,113 = 91.58, p = 4.44 × 10⁻¹⁶, R2 = 0.42, N = 120), after accounting for variation among cities. From every population, we measured the density of T. repens plants from five randomly located positions within the population. Density was estimated using a 0.5 × 0.5 m quadrat divided into 25 equal area cells. Within each quadrat, we counted the number of cells containing T. repens and averaged the number of occupied cells across the five quadrats as our measure of plant density. Using the 2016 Statistics Canada Census data [44], we collected data on the total area, human population size and human population density of each city sampled. We also recorded the number of dwellings and dwelling density, but these metrics were nearly perfectly correlated with human population size and density, respectively, so they were removed from analyses. Finally, we determined the % impervious surface and the number of buildings within a 100 m radius of each population sampled for population genetic structure using the polygon area tool in Google Earth Pro 7.3.0.3832 (Google, Inc., Mountain View, CA, USA). These measurements were made on the most recent image available for each population as of November 2017. Per cent impervious surface and the number of buildings were positively correlated with each other (r = 0.61, p < 0.001).
(d). Extraction of DNA and microsatellite genotyping
We studied the population genetic structure of T. repens across eight cities (figure 1; electronic supplementary material, table S1), which were selected to capture variation in city size. The populations and individuals used were a subset of those used in the HCN assay. In each city, 150 individuals (15 populations with 10 individuals per population) were selected for DNA extraction and genotyping, for a total of 1200 individuals. The 15 populations within each city included urban and rural populations interspersed along each transect. Populations and individuals were selected without knowledge of how they varied in HCN frequency.
Detailed molecular methods for DNA extraction, microsatellite amplification and diagnostics used to assess the efficacy of markers at depicting neutral evolution are provided in the electronic supplementary material, text S1. We characterized population genetic variation within and between populations using 16 microsatellite loci that reliably amplified and met the assumptions of Hardy–Weinberg equilibrium and showed no linkage disequilibrium (electronic supplementary material, table S3).
(e). Statistical analyses
All methods for statistical analyses are provided in electronic supplementary material, text S1. Briefly, questions 1 and 3 were addressed using linear mixed-effects models, and question 2 used multiple linear regression. Question 4 implemented a combination of standard population genetic statistics, redundancy analysis [46], Mantel correlograms [46] and estimates of population genetic structure using discriminant analysis of principal components (DAPC) [47] and the program structure [48]. Analyses were performed using r v. 3.4.0 statistical software [49] unless otherwise noted.
3. Results
(a). Does Trifolium repens evolve parallel clines in hydrogen cyanide in response to urbanization?
The frequency of HCN within populations of T. repens consistently evolved in response to urbanization. Across the 20 cities, the main effect of distance from the urban centre was positively related to the proportion of plants that produced HCN within populations (figure 2; distance: F1,476 = 6.57, p = 0.011), with an average increase in HCN frequency of 0.6% for every additional kilometre from the urban centre. The slope of HCN frequency versus distance did not significantly vary between cities, and the maximum-likelihood estimate of variance among slopes was 0 (95% CI: 0–0.013) (distance × city: χ1 < 0.001, p = 0.5). Cities significantly varied 2.2-fold in the average frequency of HCN, from 20.6 to 44.7% of plants producing HCN (χ1 = 26.1, p < 0.001).
Figure 2.

The relationship between the frequency of individuals producing hydrogen cyanide (HCN) and distance from urban centres across 20 cities. HCN frequency indicates the frequency of functional alleles at CYP79D15 and Li, which are both required to produce HCN. Distance was standardized to vary between 0 (city centre) and 1 (furthest rural population); the results based on non-standardized distance were qualitatively identical (electronic supplementary material, table S2). The relationship between HCN and distance from the urban centre averaged across all cities is shown by the bold solid line. Data points were removed to avoid clutter. Numbers correspond to each city, with numbers on the right labeling cities with positives slopes and numbers on the left labeling cities with negative slopes, although mixed model analysis showed that the slopes did not significantly vary between cities. Cities: 1—Acton, 2—Angus, 3—Barrie, 4—Bradford, 5—Brantford, 6—Cobourg, 7—Elmira, 8—Everett, 9—Fergus, 10—Georgetown, 11—Guelph, 12—London, 13—New Tecumseth, 14—Orangeville, 15—Port Hope, 16—Stouffville, 17—Stratford, 18—St Thomas, 19—Waterloo, 20—Woodstock.
(b). Does the strength of urban–rural clines vary with city size?
The strength of urban–rural clines in HCN frequency was unrelated to city size. The area of a city was not significantly related to the slope of the relationship between HCN frequency and distance (slope = −0.001, t18 = −0.256, p = 0.801). Multiple linear regression analysis that included human population size, population density, city area and average plant density did not identify any significant predictors of variation in the strength of urban–rural clines using a backward model selection procedure, which was expected given the non-significant interaction between city and distance.
The average density of T. repens plants strongly predicted the average HCN frequency within a city. Using multiple linear regression, the density of plants and the area of the city were both retained after a backward selection procedure, and these two variables explained 58% of the total variation in HCN frequency. The density of clover plants was negatively related to HCN frequency (HCN versus density: slope = −0.140, t16 = −4.723, p < 0.001), indicating that cities with denser clover populations were associated with lower HCN frequency. The area of the city was negatively related to HCN frequency, but the relationship was non-significant (HCN versus area: slope = −0.003, t16 = −1.514, p = 0.149).
(c). Do urban populations have less genetic diversity than rural populations?
Urban and rural populations did not consistently differ in levels of genetic diversity (figure 3; electronic supplementary material, tables S4 and S5). The main effect of distance from the urban centre did not significantly predict any measure of genetic diversity (electronic supplementary material, table S4). When we substituted distance for % impervious surface and the number of buildings, we found that these variables also did not predict variation in observed heterozygosity (HO), expected heterozygosity (HE) or the inbreeding coefficient (FIS) (p > 0.25). By contrast, % impervious surface was positively related to allelic richness (AR) (slopeAR versus sqrt(% impervious) = 0.46, F1,112 = 10.35, p = 0.002) (electronic supplementary material, figure S1), and the number of buildings was negatively related to AR (slopeAR versus sqrt(buildings) = −0.04, F1,112 = 5.95, p = 0.016). When these predictor variables were regressed against AR individually, % impervious surface was still a significant predictor of AR (F1,112 = 4.53, p = 0.035), whereas the number of buildings was not (F1,112 = 0.35, p = 0.557), suggesting the effects of urbanization on AR are largely associated with factors correlated with impervious surface.
Figure 3.
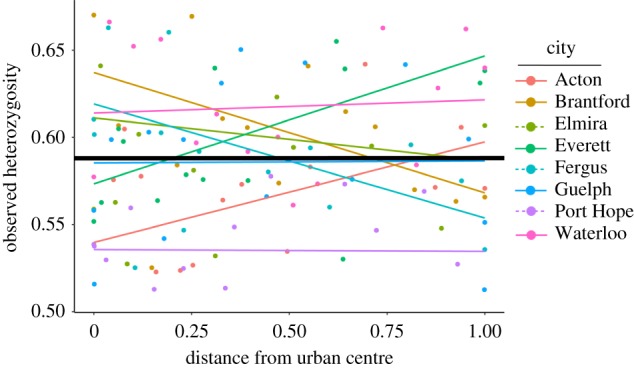
The relationship between observed heterozygosity and distance from urban centres across eight cities. The overall relationship across all cities is shown by the solid line in bold. A small number of data points were omitted above and below the minimum and maximum values shown on the y-axis to effectively illustrate the interaction.
Cities significantly varied in every measure of genetic diversity (electronic supplementary material, table S4). For example, mean observed heterozygosity varied between 0.535 in Port Hope and 0.618 in Waterloo (electronic supplementary material, table S5). Similarly, mean AR per locus within populations varied between 3.25 in Acton and 5.33 in Fergus (electronic supplementary material, table S5). Distance and city interacted to affect only HO (p = 0.035; electronic supplementary material, table S4), indicating that in some cases genetic diversity was lower in urban areas, and in other cases the opposite was true (figure 3). Using pair-wise Pearson correlations, we did not find any effects of T. repens plant density, HCN frequency, the strength of HCN urban–rural clines or the characteristics of cities (city area, % impervious surface, number of buildings, human population size and population density) on mean levels of genetic diversity within cities (electronic supplementary material, table S6).
(d). Are urban populations genetically differentiated from rural populations, after accounting for isolation-by-distance?
We frequently found evidence for IBD, but infrequently detected significant genetic differentiation between urban and rural environments. Genetic differentiation between populations within cities was relatively low (mean FST = 0.054), yet we detected significant genetic differentiation (FST > 0 at p < 0.05) in 73% of all pair-wise population comparisons (electronic supplementary material, table S7). Geographical distance significantly (p < 0.05) predicted the strength of genetic differentiation (i.e. IBD) between populations in three of eight cities (electronic supplementary material, table S8), and populations were significantly less genetically differentiated at distances less than 2 km in five of eight cities (electronic supplementary material, table S9). Genetic differentiation between urban and rural populations (urban–rural comparisons: mean FST = 0.056) was slightly greater than differentiation among urban populations (urban–urban comparisons: mean FST = 0.051) or among rural populations (rural–rural comparisons: mean FST = 0.053) (electronic supplementary material, table S10). Despite these differences, differentiation between urban and rural populations was only significantly greater in the cities of Fergus and Port Hope, after accounting for IBD (electronic supplementary material, table S8). When we implemented a Bonferroni correction based on eight tests (critical p-value = 0.0063), Port Hope was non-significant (puncorrected = 0.033), and Fergus nearly met the conservative Bonferroni threshold (puncorrected = 0.0097). We found similar results when we tested the effects of % impervious surface or the number of buildings on genetic differentiation. After accounting for IBD, % impervious surface (RDA: p < 0.001, R2 = 0.15) and the number of buildings (RDA: p = 0.011, R2 = 0.11) were negatively related to differentiation among populations in Fergus, indicative of the most urbanized populations being the least differentiated from one another. These predictors were not significant in any other city (p > 0.05).
We found that populations were genetically structured within and between cities. DAPC resulted in 10 distinct genetic clusters when all plants were included from all cities, with Guelph being the most genetically distinct (electronic supplementary material, figure S2). The DAPC ordination also showed that the urban and rural populations in Fergus were genetically distinct from one another, whereas there was broad overlap in the genetic structure of urban and rural populations in all other cities (electronic supplementary material, figure S2). When we examined population genetic structure within cities using structure, we found that the optimal number of genetic clusters (K) within cities ranged from 2 to 10 (mean ± s.d. = 4.25 ± 2.96) (figure 4). Acton and Fergus both had an optimal number of two clusters that were geographically separated along the urban–rural transect, and RDA (see above) showed that this differentiation was only significantly related to urbanization in the case of Fergus, consistent with the results from the DAPC. The remaining six cities showed evidence of extensive admixture within and between populations along urban–rural transects (figure 4).
Figure 4.

Population genetic structure in each city as determined by the program structure. The optimal number of genetic clusters (K) was assessed within each city using the method of Evanno et al. [50]. For each city, vertical columns represent individual plants, and populations are ordered according to their proximity to the urban centre, with individuals closest to the urban centre at the far left, and plants in the furthest rural populations at the far right. The colours correspond to the assignment of each plant to the genetic clusters. Plants and populations that show multiple colours provide evidence for admixture.
4. Discussion
Our results show that T. repens has consistently evolved decreased HCN in response to urbanization across 20 cities, and that this parallel evolution is best explained by changes in natural selection and not genetic drift or gene flow. These conclusions follow from four key results. First, T. repens populations evolved clines in HCN frequency regardless of city size, with an increase in the frequency of HCN genotypes from urban to rural populations (Q1 and Q2). Second, we did not find a consistent decrease in genetic diversity with increasing urbanization, as expected if the effects of genetic drift were greater in cities (Q3). To the contrary, % impervious surface was associated with greater allelic richness (AR), consistent with urbanization supporting more genetic diversity within urban T. repens populations. Third, urbanization was only unequivocally associated with greater genetic differentiation between populations in one city (Fergus) (Q4). Moreover, FST values were generally low and most cities exhibited a population genetic structure that was consistent with frequent gene flow between urban and non-urban populations. Here, we discuss how these results provide insights into the relative roles of natural selection, genetic drift and gene flow in shaping the evolution of T. repens in response to urbanization.
(a). Parallel evolution in response to urbanization
Our study provides clear and compelling evidence that urbanization causes parallel evolution in genes that control an ecologically important trait. We found surprising consistency in the evolution of HCN despite large variation in the characteristics of cities. For example, two of the steepest clines in HCN were found in one of the smallest cities (Fergus) and one of the larger cities (Guelph) (figure 2). Examination of the individual regression lines in figure 2, and from simple linear regression performed on each city (electronic supplementary material, table S11), might lead one to conclude that the effects of urbanization on HCN differed between cities. However, these slopes were, on average, positive and not significantly different from one another, both when distance was standardized and not standardized. This result indicates that urbanization consistently leads to the evolution of a decreased frequency of cyanogenic genotypes, and multiple linear regression showed that variation in the characteristics of cities (e.g. city size) do not alter this evolutionary outcome. These findings extend our earlier work by showing that evolution of HCN in response to urbanization is not restricted to large metropolitan areas [36]. Remarkably, the average change in % HCN along the 20 urban–rural gradients (0.60% km−1) was nearly identical to the rate of change identified in the nearby megacity of Toronto (0.65% km−1), and approximately twice the rate observed in New York (0.34% km−1) and Boston (0.27% km−1). If this parallel evolution is caused by natural selection, it implies that the functional CYP79D15 and Li alleles controlling the production of HCN are repeatedly selected against in cities as large as New York (NY, USA) and as small as Fergus (ON, Canada).
The results from the T. repens system add to a small but growing body of literature, suggesting that urbanization may frequently cause parallel evolution at genetic and phenotypic levels across a wide diversity of organisms [8,14,51,52]. For example, blackbirds (Turdus merula) have independently colonized cities from forest populations throughout Europe. Urban T. merula populations show increased wariness to foreign objects [53], less migratory behaviour [54,55] and exhibit repeated evolution in the same allele of the SERT gene, which is associated with harm avoidance behaviours [56]. The plant Virginia pepperweed (Lepidium virginicum) has evolved to grow faster, bolt earlier and to be more fecund in urban populations compared to non-urban populations across four cities [57]. This consistent evolutionary change in L. viriginicum appears to result from the repeated invasion of the same haplotype into urban environments in at least three of the four cities examined. Although natural selection is typically invoked as the causal evolutionary mechanism to explain these examples of parallel evolution, we are unaware of any study that has examined whether genetic drift and gene flow could contribute to these patterns.
(b). Effects of urbanization on genetic drift and genetic diversity within populations
It has been claimed that urbanization leads to smaller, more fragmented populations that are subject to stronger genetic drift [7,27]. If true, then we expect urban populations to exhibit less genetic diversity than non-urban populations. This pattern has been reported from a diverse array of native species, including mammals [9], birds [58], amphibians [12], reptiles [59], mollusks [60], insects [61], and plants [62]. The effects of urbanization on genetic drift in introduced species that thrive in urban environments is less clear [63,64].
Understanding how urbanization affects patterns of genetic diversity within populations can be important for discerning whether parallel clines in allele frequencies are likely to have arisen due to natural selection or genetic drift. This is especially relevant in a plant like T. repens, in which the production of HCN results from the epistatic interaction between two loci, and the fixation of a non-functional allele at either locus causes the population to be fixed for the acyanogenic phenotype. Using simulation modelling, Santangelo et al. [21] showed that population bottlenecks and founder events preferentially result in the fixation of acyanogenic genotypes and can lead to urban–rural clines in HCN frequency as strong as those reported here. Thus, if T. repens invades cities from rural areas, which is expected given the agricultural history of this plant [65], populations may evolve a decreased frequency of HCN in cities due to the effects of genetic drift alone [21]. Although we cannot examine this process directly, we can test whether urban populations show the expected pattern of decreased genetic diversity at neutral loci, which should occur if urban populations experienced population bottlenecks or founder events.
Our results show that urbanization did not lead to a consistent loss of genetic diversity in T. repens, and some measures of urbanization were associated with increased genetic diversity. There was no consistent effect of distance from the urban centre on any measure of genetic diversity (electronic supplementary material, table S4). Contrary to the pattern predicted for native species [27], % impervious surface was associated with increased allelic richness, indicating that urban populations contained a greater number of alleles per locus than non-urban populations (electronic supplementary material, figure S1). Greater impervious surface itself is unlikely to be the causal factor underlying this relationship, but instead urban features that covary with impervious surface. For example, most urban and suburban habitats in Ontario have an abundance of mowed grass in which T. repens thrives. By contrast, T. repens is often difficult to find in rural areas because it is restricted to mowed areas and grazed pastures, which are not always abundant in rural Ontario. It does poorly in crop lands, roadsides with tall grass and abandoned agricultural land undergoing succession [38]. Although the density of populations did not change as a function of distance from the urban centre (F1,478 = 0.11, p = 0.739), our qualitative observations suggest that the total abundance of T. repens is greater in cities than equivalently sized non-urban areas. Thus, contemporary urban T. repens populations could support a greater diversity of alleles than non-urban populations that tend to be more fragmented. Other measures of genetic diversity (Ho, HE and FIS) may have been less affected by urbanization because the large number of alleles at each locus could have allowed for the maintenance of high heterozygosity and low divergence between populations (electronic supplementary material, table S5).
Our results for the effects of urbanization on patterns of spatial variation in genetic diversity suggest that while urbanization may frequently reduce genetic diversity in native species, the effects of urbanization on exotic species that are abundant in urban environments may be reversed [27]. This hypothesis requires further investigation before firm conclusions can be made, but it is clear that urbanization can have diverse effects on patterns of genetic diversity depending on a species' natural history.
(c). Effects of urbanization on genetic divergence and gene flow between populations
Many artificial and natural features of urban environments can impede the movement of alleles across a landscape due to reduced dispersal, and these barriers can facilitate the genetic divergence of populations [7]. Consistent with this prediction, there is evidence for elevated differentiation among urban populations (i.e. urban–urban comparisons) [10,12,58] and between urban and non-urban populations (i.e. urban–non-urban comparisons) [57,66]. When such divergence occurs, it may facilitate adaptive divergence between populations.
Urbanization did not have consistent effects on genetic differentiation or gene flow among T. repens populations. Populations frequently exhibited greater relatedness at small spatial scales (less than 2 km; electronic supplementary material, table S9), whereas IBD was not detected at larger distances. Urbanization only increased genetic differentiation over and above the effects of IBD unequivocally in one city (Fergus), and differentiation among urban populations within cities was, on average, lower than urban–rural and rural–rural comparisons (electronic supplementary material, table S10). The genetic structure of populations showed evidence of widespread admixture across urban–rural transects in six of the eight cities. For example, the clear cline in HCN frequency in Guelph (figure 2) was associated with an optimal number of four genetic clusters based on structure (figure 4). These clusters were admixed in both urban and rural populations. Together, these results suggest that there was extensive gene flow among populations along urban–rural transects, potentially caused by human-mediated movement of seeds and stolons, and parallel clines in T. repens evolved despite this gene flow. These results also show that increasing city size does not cause increased differentiation between urban and non-urban T. repens populations.
(d). Relative importance of natural selection, genetic drift and gene flow
The evolution of parallel clines in response to repeated environmental gradients is often viewed as the hallmark of evolution by natural selection. It is not widely appreciated that repeated population bottlenecks or founder events can also lead to clines at genetic and phenotypic levels [21]. Restricted gene flow can facilitate adaptive genetic divergence along environmental gradients, whereas high gene flow may prevent adaptation to environmental gradients. We are unaware of any study that has compared the relative roles of natural selection, genetic drift and gene flow in shaping the evolution of populations in response to replicated urbanization gradients. However, the individual components of these processes have been examined over the course of multiple separate studies in the white-footed mouse [9,25,67,68] and blackbird [56,58]. Examining the effects of these processes in a single study would provide a strong test of the relative roles of natural selection, drift and gene flow in shaping the evolution of populations in response to urbanization.
Our study took such an approach and provides compelling evidence that natural selection is the primary evolutionary mechanism responsible for increasing HCN frequency with decreasing urbanization. High plant abundance, high levels of genetic diversity in populations and the lack of a consistent reduction in genetic diversity in urban centres rule out genetic drift as an explanatory factor for the evolution of clines in HCN. We found significant genetic differentiation and little evidence of admixture between urban and rural populations of Fergus, which may have facilitated the evolution of a cline in this city. The lack of clear differentiation and evidence of gene flow between urban and rural populations in other cities might be expected to prevent the evolution of clines, yet clines still evolved (figure 2). This finding implies that natural selection between urban and rural populations is sufficiently strong to show a clear pattern of adaptation despite the homogenizing effects of gene flow.
Supplementary Material
Supplementary Material
Acknowledgements
We thank P. Chaban, I. Cheval, M. Escobar, S. Innes, Z. Sina and K. Thompson for assistance. The paper was improved by comments from G. Bradburd, M.-J. Fortin, J. Munshi-South, R. Ness, J. Santangelo, B. Verrelli and two anonymous reviewers. We are especially grateful to Amanda Nelson who contributed substantially to this study.
Data accessibility
Data have been deposited in the Dryad Digital Repository at: https://doi.org/10.5061/dryad.2dq7pf3 [69].
Authors' contributions
M.T.J.J. and H.S.S. conceived of the study. M.T.J.J. and C.M.P. designed the study, analysed the data and drafted the manuscript. M.T.J.J., C.M.P. and M.L. collected the samples. M.L. performed the HCN assays and C.M.P. performed the molecular analyses and genotype calling. All authors revised the paper and approved the final version.
Competing interests
We declare we have no competing interests.
Funding
This work was supported by funding from the University of Toronto (H.S.S.), an NSERC USRA (C.M.P.) and a NSERC Discovery Grant and Accelerator Award (M.T.J.J.).
References
- 1.Grimm NB, et al. 2008. Global change and the ecology of cities. Science 319, 756–760. ( 10.1126/science.1150195) [DOI] [PubMed] [Google Scholar]
- 2.Aronson MF, et al. 2014. A global analysis of the impacts of urbanization on bird and plant diversity reveals key anthropogenic drivers. Proc. R. Soc. B 281, 20133330 ( 10.1098/rspb.2013.3330) [DOI] [PMC free article] [PubMed] [Google Scholar]
- 3.McKinney ML. 2006. Urbanization as a major cause of biotic homogenization. Biol. Conserv. 127, 247–260. ( 10.1016/j.biocon.2005.09.005) [DOI] [Google Scholar]
- 4.Seto KC, Sánchez-Rodríguez R, Fragkias M. 2010. The new geography of contemporary urbanization and the environment. Annu. Rev. Environ. Resour. 35, 167–194. ( 10.1146/annurev-environ-100809-125336) [DOI] [Google Scholar]
- 5.Zhou Y, et al. 2015. A global map of urban extent from nightlights. Environ. Res. Lett. 10, 054011 ( 10.1088/1748-9326/10/5/054011) [DOI] [Google Scholar]
- 6.United Nations, Department of Economic and Social Affairs, Population Division. 2015. World Urbanization Prospects: the 2014 Revision, (ST/ESA/SER.A/366).
- 7.Johnson MTJ, Munshi-South J. 2017. Evolution of life in urban environments. Science 358, eaam8327 ( 10.1126/science.aam8327) [DOI] [PubMed] [Google Scholar]
- 8.Donihue CM, Lambert MR. 2014. Adaptive evolution in urban ecosystems. Ambio 44, 194–203. ( 10.1007/s13280-014-0547-2) [DOI] [PMC free article] [PubMed] [Google Scholar]
- 9.Munshi-South J, Zolnik CP, Harris SE. 2016. Population genomics of the Anthropocene: urbanization is negatively associated with genome-wide variation in white-footed mouse populations. Evol. Appl. 9, 546–564. ( 10.1111/eva.12357) [DOI] [PMC free article] [PubMed] [Google Scholar]
- 10.Lourenço A, Álvarez D, Wang IJ. 2017. Trapped within the city: integrating demography, time since isolation and population-specific traits to assess the genetic effects of urbanization. Mol. Ecol. 26, 1498–1514. ( 10.1111/mec.14019) [DOI] [PubMed] [Google Scholar]
- 11.Beninde J, et al. 2016. Cityscape genetics: structural versus functional connectivity of an urban lizard population. Mol. Ecol. 25, 4984–5000. ( 10.1111/mec.13810) [DOI] [PubMed] [Google Scholar]
- 12.Noël S, Lapointe F-J. 2010. Urban conservation genetics: study of a terrestrial salamander in the city. Biol. Conserv. 143, 2823–2831. ( 10.1016/j.biocon.2010.07.033) [DOI] [Google Scholar]
- 13.Niemelä J. (ed.). 2011. Urban ecology: patterns, processes, and applications. Oxford, UK: Oxford University Press. [Google Scholar]
- 14.Reid NM, et al. 2016. The genomic landscape of rapid repeated evolutionary adaptation to toxic pollution in wild fish. Science 354, 1305–1308. ( 10.1126/science.aah4993) [DOI] [PMC free article] [PubMed] [Google Scholar]
- 15.Wirgin I, et al. 2011. Mechanistic basis of resistance to PCBs in Atlantic tomcod from the Hudson River. Science 331, 1322–1325. ( 10.1126/science.1197296) [DOI] [PMC free article] [PubMed] [Google Scholar]
- 16.Winchell KM, Maayan I, Fredette J, Revell LJ. 2018. Linking locomotor performance to morphological shifts in urban lizards. Proc. R. Soc. B 285, 20180229 ( 10.1098/rspb.2018.0229) [DOI] [PMC free article] [PubMed] [Google Scholar]
- 17.Winchell KM, Reynolds RG, Prado-Irwin SR, Puente-Rolón AR, Revell LJ. 2016. Phenotypic shifts in urban areas in the tropical lizard Anolis cristatellus. Evolution 70, 1009–1022. ( 10.1111/evo.12925) [DOI] [PubMed] [Google Scholar]
- 18.Dobbs C, Nitschke C, Kendal D. 2017. Assessing the drivers shaping global patterns of urban vegetation landscape structure. Sci. Total Environ. 592, 171–177. ( 10.1016/j.scitotenv.2017.03.058) [DOI] [PubMed] [Google Scholar]
- 19.Haddad NM, et al. 2015. Habitat fragmentation and its lasting impact on Earth's ecosystems. Sci. Adv. 1, e1500052 ( 10.1126/sciadv.1500052) [DOI] [PMC free article] [PubMed] [Google Scholar]
- 20.Wandeler P, Funk SM, Largiadèr CR, Gloors S, Breitenmoser U. 2003. The city-fox phenomenon: genetic consequences of a recent colonization of urban habitat. Mol. Ecol. 12, 647–656. ( 10.1046/j.1365-294X.2003.01768.x) [DOI] [PubMed] [Google Scholar]
- 21.Santangelo JS, Johnson MTJ, Ness RW. 2018. Modern spandrels: the roles of genetic drift, natural selection and gene flow in the evolution of parallel clines. Proc. R. Soc. B 285, 20180230 ( 10.1098/rspb.2018.0230) [DOI] [PMC free article] [PubMed] [Google Scholar]
- 22.Colautti RI, Lau JA. 2015. Contemporary evolution during invasion: evidence for differentiation, natural selection, and local adaptation. Mol. Ecol. 24, 1999–2017. [DOI] [PubMed] [Google Scholar]
- 23.Serieys LEK, Lea A, Pollinger JP, Riley SPD, Wayne RK. 2014. Disease and freeways drive genetic change in urban bobcat populations. Evol. Appl. 8, 75–92. ( 10.1111/eva.12226) [DOI] [PMC free article] [PubMed] [Google Scholar]
- 24.Wilson RE, Farley SD, McDonough TJ, Talbot SL, Barboza PS. 2015. A genetic discontinuity in moose (Alces alces) in Alaska corresponds with fenced transportation infrastructure. Conserv. Genet. 16, 791–800. [Google Scholar]
- 25.Munshi-South J. 2012. Urban landscape genetics: canopy cover predicts gene flow between white-footed mouse (Peromyscus leucopus) populations in New York City. Mol. Ecol. 21, 1360–1378. ( 10.1111/j.1365-294X.2012.05476.x) [DOI] [PubMed] [Google Scholar]
- 26.Furman BLS, Scheffers BR, Taylor M, Davis C, Paszkowski CA. 2016. Limited genetic structure in a wood frog (Lithobates sylvaticus) population in an urban landscape inhabiting natural and constructed wetlands. Conserv. Genet. 17, 19–30. ( 10.1007/s10592-015-0757-6) [DOI] [Google Scholar]
- 27.Johnson MTJ, Thompson KA, Saini HS. 2015. Plant evolution in the urban jungle. Am. J. Bot. 102, 1951–1953. ( 10.3732/ajb.1500386) [DOI] [PubMed] [Google Scholar]
- 28.Daday H. 1958. Gene frequencies in wild populations of Trifolium repens L. Heredity 12, 169–184. ( 10.1038/hdy.1958.22) [DOI] [Google Scholar]
- 29.Hughes M. 1991. The cyanogenic polymorphism in Trifolium repens L. (white clover). Heredity 66, 105–115. ( 10.1038/hdy.1991.13) [DOI] [Google Scholar]
- 30.Thompson KA, Johnson MTJ. 2016. Antiherbivore defenses alter natural selection on plant reproductive traits. Evolution 70, 796–810. ( 10.1111/evo.12900) [DOI] [PubMed] [Google Scholar]
- 31.Dirzo R, Harper JL. 1982. Experimental studies on slug-plant interactions: III. Differences in the acceptability of individual plants of Trifolium repens to slugs and snails. J. Ecol. 70, 101–117. ( 10.2307/2259867) [DOI] [Google Scholar]
- 32.Viette M, Tettamanti C, Saucy F. 2000. Preference for acyanogenic white clover (Trifolium repens) in the vole Arvicola terrestris. II. Generalization and further investigations. J. Chem. Ecol. 26, 101–122. ( 10.1023/A:1005441528235) [DOI] [Google Scholar]
- 33.Olsen KM, Ungerer MC. 2008. Freezing tolerance and cyanogenesis in white clover (Trifolium repens L. Fabaceae). Int. J. Plant Sci. 169, 1141–1147. ( 10.1086/591984) [DOI] [Google Scholar]
- 34.Daday H. 1965. Gene frequencies in wild populations of Trifolium repens L. IV. Mechanism of natural selection. Heredity 20, 355–365. ( 10.1038/hdy.1965.49) [DOI] [Google Scholar]
- 35.Dirzo R, Harper JL. 1982. Experimental studies on slug–plant interactions: IV. The performance of cyanogenic and acyanogenic morphs of Trifolium repens in the field. J. Ecol. 70, 119–138. ( 10.2307/2259868) [DOI] [Google Scholar]
- 36.Thompson KA, Renaudin M, Johnson MTJ. 2016. Urbanization drives the evolution of parallel clines in plant populations. Proc. R. Soc. B 283, 20162180 ( 10.1098/rspb.2016.2180) [DOI] [PMC free article] [PubMed] [Google Scholar]
- 37.Oke TR. 1973. City size and the urban heat island. ASTM Spec. Tech. Publ. 7, 769–779. ( 10.1016/0004-6981(73)90140-6) [DOI] [Google Scholar]
- 38.Burdon J. 1983. Trifolium repens L. J. Ecol. 71, 307–330. ( 10.2307/2259979) [DOI] [Google Scholar]
- 39.Olsen KM, Hsu S, Small LL. 2008. Evidence on the molecular basis of the Ac/ac adaptive cyanogenesis polymorphism in white clover (Trifolium repens L.). Genetics 179, 517–526. ( 10.1534/genetics.107.080366) [DOI] [PMC free article] [PubMed] [Google Scholar]
- 40.Olsen KM, Sutherland BL, Small LL. 2007. Molecular evolution of the Li/li chemical defence polymorphism in white clover (Trifolium repens L.). Mol. Ecol. 16, 4180–4193. ( 10.1111/j.1365-294X.2007.03506.x) [DOI] [PubMed] [Google Scholar]
- 41.Corkill L. 1940. Cyanogenesis in white clover (Trifolium repens L.). I. Cyanogenesis in single plants. New Zeal. J. Sci. Tech. A 22–23, 65–67. [Google Scholar]
- 42.Kooyers N, Olsen K. 2014. Adaptive cyanogenesis clines evolve recurrently through geographical sorting of existing gene deletions. J. Evol. Biol. 27, 2554–2558. ( 10.1111/jeb.12466) [DOI] [PubMed] [Google Scholar]
- 43.Daday H. 1954. Gene frequencies in wild populations of Trifolium repens. Heredity 8, 377–384. ( 10.1038/hdy.1954.40) [DOI] [Google Scholar]
- 44.Statistics Canada. 2016. 2016 Census: Census Profile (98-316-X), Ottawa, Canada. See http://www12.statcan.gc.ca/census-recensement/2016/dp-pd/index-eng.cfm.
- 45.Gleadow R, Bjarnhold N, Jørgensen K, Fox J, Miller R. 2011. Cyanogenic glycosides. In Research methods in plant sciences, volume 1: soil allelochemicals (eds Narwal S, Szajdak L, Sampietro D), Houston, TX: Studium Press. [Google Scholar]
- 46.Legendre P, Legendre L. 2012. Numerical ecology, 3rd edn. Amsterdam, the Netherlands: Elsevier Science. [Google Scholar]
- 47.Jombart T, Devillard S, Balloux F. 2010. Discriminant analysis of principal components: a new method for the analysis of genetically structured populations. BMC Genet. 11, 94 ( 10.1186/1471-2156-11-94) [DOI] [PMC free article] [PubMed] [Google Scholar]
- 48.Pritchard JK, Stephens M, Donnelly P. 2000. Inference of population structure using multilocus genotype data. Genetics 155, 945–959. [DOI] [PMC free article] [PubMed] [Google Scholar]
- 49.R Core Team. 2013. R: a language and environment for statistical computing. Viennia, Austria: R Foundation for Statistical Computing. [Google Scholar]
- 50.Evanno G, Regnaut S, Goudet J. 2005. Detecting the number of clusters of individuals using the software STRUCTURE: a simulation study. Mol. Ecol. 14, 2611–2620. ( 10.1111/j.1365-294X.2005.02553.x) [DOI] [PubMed] [Google Scholar]
- 51.Theodorou P, et al. 2018. Genome-wide single nucleotide polymorphism scan suggests adaptation to urbanization in an important pollinator, the red-tailed bumblebee (Bombus lapidarius L.). Proc. R. Soc. B 285, 20172806 ( 10.1098/rspb.2017.2806) [DOI] [PMC free article] [PubMed] [Google Scholar]
- 52.van't Hof AE, et al. 2016. The industrial melanism mutation in British peppered moths is a transposable element. Nature 534, 102–105. ( 10.1038/nature17951) [DOI] [PubMed] [Google Scholar]
- 53.Miranda AC, Schielzeth H, Sonntag T, Partecke J.. 2013. Urbanization and its effects on personality traits: a result of microevolution or phenotypic plasticity? Glob. Change Biol. 19, 2634–2644. ( 10.1111/gcb.12258) [DOI] [PubMed] [Google Scholar]
- 54.Evans KL, et al. 2012. Colonisation of urban environments is associated with reduced migratory behaviour, facilitating divergence from ancestral populations. Oikos 121, 634–640. ( 10.1111/j.1600-0706.2011.19722.x) [DOI] [Google Scholar]
- 55.Partecke J, Gwinner E. 2007. Increased sedentariness in European blackbirds following urbanization: a consequence of local adaptation? Ecology 88, 882–890. ( 10.1890/06-1105) [DOI] [PubMed] [Google Scholar]
- 56.Mueller JC, Partecke J, Hatchwell BJ, Gaston KJ, Evans KL. 2013. Candidate gene polymorphisms for behavioral adaptations during urbanization in blackbirds. Mol. Ecol. 22, 3629–3637. ( 10.1111/mec.12288) [DOI] [PubMed] [Google Scholar]
- 57.Yakub M, Tiffin P. 2017. Living in the city: urban environments shape the evolution of a native annual plant. Glob. Change Biol. 23, 2082–2089. ( 10.1111/gcb.13528) [DOI] [PubMed] [Google Scholar]
- 58.Evans KL, et al. 2009. Independent colonization of multiple urban centres by a formerly forest specialist bird species. Proc. R. Soc. B 276, 2403–2410. ( 10.1098/rspb.2008.1712) [DOI] [PMC free article] [PubMed] [Google Scholar]
- 59.Rubin CS, Warner RE, Bouzat JL, Paige KN. 2001. Population genetic structure of Blanding's turtles (Emydoidea blandingii) in an urban landscape. Biol. Conserv. 99, 323–330. ( 10.1016/S0006-3207(00)00198-1) [DOI] [Google Scholar]
- 60.Fauvelot C, Bertozzi F, Costantini F, Airoldi L, Abbiati M. 2009. Lower genetic diversity in the limpet Patella caerulea on urban coastal structures compared to natural rocky habitats. Mar. Biol. 156, 2313–2323. [Google Scholar]
- 61.Vandergast AG, et al. 2009. Loss of genetic connectivity and diversity in urban microreserves in a southern California endemic Jerusalem cricket (Orthoptera: Stenopelmatidae: Stenopelmatus n. sp.“santa monica”). J. Insect Conserv. 13, 329–345. [Google Scholar]
- 62.Bartlewicz J, Vandepitte K, Jacquemyn H, Honnay O. 2015. Population genetic diversity of the clonal self-incompatible herbaceous plant Linaria vulgaris along an urbanization gradient. Biol. J. Linnean Soc. 116, 603–613. ( 10.1111/bij.12602) [DOI] [Google Scholar]
- 63.Combs M, Puckett EE, Richardson J, Mims D, Munshi-South J. 2017. Spatial population genomics of the brown rat (Rattus norvegicus) in New York City. Mol. Ecol. 27, 83–98. ( 10.1111/mec.14437) [DOI] [PubMed] [Google Scholar]
- 64.Booth W, et al. 2012. Molecular markers reveal infestation dynamics of the bed bug (Hemiptera: Cimicidae) within apartment buildings. J. Med. Entomol. 49, 535–546. ( 10.1603/ME11256) [DOI] [PubMed] [Google Scholar]
- 65.Kjaergaard T. 2003. A plant that changed the world: the rise and fall of clover 1000–2000. Landsc. Res. 28, 41–49. ( 10.1080/01426390306531) [DOI] [Google Scholar]
- 66.Kamdem C, Fouet C, Gamez S, White BJ. 2017. Pollutants and insecticides drive local adaptation in African malaria mosquitoes. Mol. Biol. Evol. 34, 1261–1275. ( 10.1093/molbev/msx087) [DOI] [PMC free article] [PubMed] [Google Scholar]
- 67.Harris SE, Munshi-South J, Obergfell C, O'Neill R. 2013. Signatures of rapid evolution in urban and rural transcriptomes of white-footed mice (Peromyscus leucopus) in the New York metropolitan area. PLoS ONE 8, e74938 ( 10.1371/journal.pone.0074938) [DOI] [PMC free article] [PubMed] [Google Scholar]
- 68.Harris SE, et al. 2016. Urbanization shapes the demographic history of a native rodent (the white-footed mouse, Peromyscus leucopus) in New York City. Biol. Lett. 12, 20150983 ( 10.1098/rsbl.2015.0983) [DOI] [PMC free article] [PubMed] [Google Scholar]
- 69.Johnson MTJ, Prashad CM, Lavoignat M, Saini HS. 2018. Data from: Contrasting the effects of natural selection, genetic drift and gene flow on urban evolution in white clover (Trifolium repens) Dryad Digital Repository. ( 10.5061/dryad.2dq7pf3) [DOI] [PMC free article] [PubMed]
Associated Data
This section collects any data citations, data availability statements, or supplementary materials included in this article.
Data Citations
- Johnson MTJ, Prashad CM, Lavoignat M, Saini HS. 2018. Data from: Contrasting the effects of natural selection, genetic drift and gene flow on urban evolution in white clover (Trifolium repens) Dryad Digital Repository. ( 10.5061/dryad.2dq7pf3) [DOI] [PMC free article] [PubMed]
Supplementary Materials
Data Availability Statement
Data have been deposited in the Dryad Digital Repository at: https://doi.org/10.5061/dryad.2dq7pf3 [69].