

Abstract
T cells continuously sample CNS-derived antigens in the periphery, yet it is unknown how they sample and respond to CNS antigens derived from distinct brain areas. We expressed ovalbumin (OVA) neoepitopes in regionally distinct CNS areas (Cnp-OVA and Nes-OVA mice) to test peripheral antigen sampling by OVA-specific T cells under homeostatic and neuroinflammatory conditions. We show that antigen sampling in the periphery is independent of regional origin of CNS antigens in both male and female mice. However, experimental autoimmune encephalomyelitis (EAE) is differentially influenced in Cnp-OVA and Nes-OVA female mice. Although there is the same frequency of CD45high CD11b+ CD11c+ CX3CL1+ myeloid cell–T-cell clusters in neoepitope-expressing areas, EAE is inhibited in Nes-OVA female mice and accelerated in CNP-OVA female mice. Accumulation of OVA-specific T cells and their immunomodulatory effects on EAE are CX3C chemokine receptor 1 (CX3CR1) dependent. These data show that despite similar levels of peripheral antigen sampling, CNS antigen-specific T cells differentially influence neuroinflammatory disease depending on the location of cognate antigens and the presence of CX3CL1/CX3CR1 signaling.
SIGNIFICANCE STATEMENT Our data show that peripheral T cells similarly recognize neoepitopes independent of their origin within the CNS under homeostatic conditions. Contrastingly, during ongoing autoimmune neuroinflammation, neoepitope-specific T cells differentially influence clinical score and pathology based on the CNS regional location of the neoepitopes in a CX3CR1-dependent manner. Altogether, we propose a novel mechanism for how T cells respond to regionally distinct CNS derived antigens and contribute to CNS autoimmune pathology.
Keywords: autoimmunity, CNS, neuroinflammation, T cells
Introduction
Understanding how the CNS and the immune system communicate during health and disease is critical for elucidating how CNS diseases initiate, progress, and resolve. It is becoming increasingly clear that peripheral immune cells can recognize and respond to CNS-derived antigens under homeostatic conditions and even more so during neurotrauma and neurological disease (Ransohoff and Engelhardt, 2012; Engelhardt et al., 2017). Despite this, the routes and mechanisms for how different CNS cell-derived antigenic information reaches the periphery and how antigen-specific T cells migrate to different regions in the CNS and influence resident cells are still not understood.
Accumulating data suggest that multiple sclerosis (MS) patients can display unique immune cell autoreactivity to single or multiple distinct CNS antigens (Kerlero de Rosbo et al., 1993; Malyavantham et al., 2015). It is unclear how and why the nature of the autoreactive antigen, the cells that express them, and/or their regional location within the CNS, influence the immune responses targeted toward them and how these processes ultimately affect autoimmune outcome (Krakowski and Owens, 2000; Qing et al., 2000; Ji et al., 2013; Flach et al., 2016; Kadowaki et al., 2016). Nonetheless, dendritic cells (DCs) have been identified to be crucial in these processes as they are essential in initiating and facilitating how peripheral immune responses interact with CNS antigens (Karman et al., 2004b).
To understand how the peripheral immune system responds to distinct CNS cell-derived and regionally-located antigens, we generated transgenic mice using the oligodendrocyte-specific [2′,3′-cyclic-nucleotide 3′-phosphodiesterase (CNPase)] promoter and the neural progenitor cell restricted nestin promoter to express an enhanced green fluorescent protein (EGFP)-tagged fusion protein containing ovalbumin (OVA) antigenic peptides in CNPase+ and Nestin+ cells, respectively (Cnp-OVA and Nes-OVA mice; Harris et al., 2014). Using these models, we tested whether anti-OVA peptide-specific sentinel OT-I (CD8+) and OT-II (CD4+) T cells would similarly sample OVA antigens from different CNS regions in the periphery under homeostatic or neuroinflammatory conditions.
CX3C chemokine receptor 1 (CX3CR1) has been shown to be expressed on CD4 T cells residing in the lung and skin (Mionnet et al., 2010; Staumont-Sallé et al., 2014) and more recently CX3CR1 was shown to differentiate between subsets of memory CD8 T cells (Böttcher et al., 2015) and non-lymphoid tissue surveying peripheral memory T cells during lymphocytic choriomeningitis viral infection (Gerlach et al., 2016). Although the role of CX3CR1 in effector CD8 T cell localization has been described in different tissues including the lung, skin, and spleen (Böttcher et al., 2015), the role of this receptor in T-cell homing to the CNS during autoimmunity has not been tested.
Here, we show that peripheral OVA-specific T cells similarly sample CNS antigens independent of the cellular or regional origin of antigens during homeostatic conditions. Yet during neuroinflammatory disease, OVA-specific T cells exacerbate outcome in Cnp-OVA mice but ameliorate EAE in Nes-OVA mice in a CX3CR1-dependent manner. These data highlight the importance of the cellular source and regional location of autoreactive CNS antigens and reveal a novel mechanism for how antigen-specific T cells affect the neuroinflammatory outcome of CNS autoimmunity.
Materials and Methods
Mice.
The pZ/EG plasmid (generated by Dr. Andras Nagy, Mount Sinai Hospital, Toronto, ON, Canada) was designed to express EGFP under the control of the CMV/β-actin promoter. Two loxP sites flank a β-galactosidase expression cassette adjacent to a neomycin resistance gene in the plasmid, which also contains an ampicillin resistance gene between the EGFP expression cassette and the CMV/β-actin promoter complex. The DNA coding sequence for OVA257–264-OVA323–339-PCC88–104 peptides was inserted at the 3′ end of the open reading frame of EGFP before the STOP codon using the QuikChange method (Stratagene). Pigeon cytochrome C peptide (PCC) is presented by I-Ek that is not present on the MHC Allele Ab-expressing C57BL/6J mouse strain (Kaye et al., 1989). This peptide was inserted together with the OVA peptides to be used for antibody purification of the construct or future application with the B10.A mouse strain.
The pZ/EG-OVA plasmid was linearized using ScaI restriction enzyme digestion and subsequently purified by electroelution and ethanol precipitation. Transgenic pZ/EG-OVA mice were generated by microinjection of linearized, purified DNA into one-cell C57BL/6 embryos, which were implanted into pseudopregnant C57BL/6 mice. A founder pZ/EG-OVA mouse line was established. It (#147) was crossed with Cnp1Cre/Cre mice and Nestin-cre mice to obtain double transgenic offspring having constitutive Cre-mediated myelinating glial cell-specific transgene expression and neural progenitor cell-specific transgene expression respectively. Genotyping of the double transgenic mouse strains was done by PCR on genomic DNA using these primer sequences for GFP: GFP sense: 5′-CAC ATG AAG CAG CAC GAC TT-3′; GFP antisense: 5′-TGC TCA GGT AGT GGT TGT CG-3′; and the following Cre driver line-specific primer sequences: Cre mice–Cre-E3 sense: 5′-GCC TTC AAA CTG TCC ATC TC-3′; Cre antisense: 5′-CCC AGC CCT TTT ATT ACC AC-3′; and puro3: 5′-CAT AGC CTG AAG AAC GAG A-3′; The Thy1.1, OVA257–264-specific OT-I, and OVA323–339-specific OT-II mice were also purchased from The Jackson Laboratory, and the OT-I and OT-II mice were bred to the Thy1.1 background. The Cnp1Cre/Cre mice were a generous gift from Dr. Brian Popko (University of Chicago, Chicago, IL). B6.Cg-Tg(Nes-Cre)1/Kln/J mice were purchased from The Jackson Laboratory and B6.1290Cx3cr1tm1Zm (CX3CR1−/−) mice were purchased from Taconic. Male and female mice (8–14 weeks old) were used for peripheral T-cell sampling experiments, whereas female mice (8–14 weeks old) were exclusively used for the EAE experiments. All experiments were conducted in accordance with guidelines from the National Institutes of Health and the University of Wisconsin-Madison Institutional Animal Care and Use Committee.
EAE induction.
EAE was induced by subcutaneous immunization with 100 μg MOG35–55 peptide (Genemed Synthesis) emulsified in CFA (Difco) supplemented with 5 mg/ml H37Ra and Mycobacterium (Harris et al., 2014). Pertussis toxin (200 ng; List Biological Laboratories) was injected intraperitoneally on the day of EAE induction and again 2 d later. Clinical scores were assessed in a double-blinded manner daily according to the following scale: 0, no clinical symptoms; 1, limp/flaccid tail; 2, partial hindlimb paralysis; 3, complete hindlimb paralysis; 4, quadriplegia; 5, moribund or dead. Intermediate scores were assigned for intermediate symptoms.
Adoptive transfer.
Lymphocytes (106) from pooled lymph node preparation from OT-I Thy1.1 and OT-II Thy1.1 transgenic mice were adoptively transferred intravenously into the retro-orbital vein of recipient mice (Harris et al., 2014).
Lymphocyte isolation, and FACS.
Mice were deeply anesthetized with isoflurane and then transcardially perfused with cold PBS. Single-cell suspensions were made from cervical lymph nodes (CLNs) and spleens by grinding the tissues between the frosted ends of glass slides(Harris et al., 2014). Red blood cells were lysed using ACK lysis buffer, and cells were washed with HBSS. Brain and spinal cord tissues were minced with razor blades and pushed through 70 μm nylon cell strainers. Cells were washed, resuspended in 70% Percoll, and overlaid with 30% Percoll. The gradient was centrifuged at 2400 rpm for 30 min at 4°C without brake. The interface was removed and washed before plating. All collected organs were weighed, and live cells were counted using a hemocytometer.
Data were acquired on a BD LSR II flow cytometer (BD Biosciences) and analyzed using FlowJo software (Tree Star).
Fluorescent microscopy.
For frozen sections, mice were first perfused with cold PBS, followed by perfusion with 4% PFA/PBS. Harvested tissues were left in 25% sucrose/PBS overnight at 4°C. Ten- to 40-μm-thick tissue cryosections were cut and stored at −80°C until staining. Floating sections were incubated in PBS two times for 10 min at room temperature before applying primary conjugated antibodies in FACS buffer (PBS/ with 2% BSA/ and 0.1% sodium azide) with 0.1% Triton X-100 (1:1000) overnight at 37°C. Sections were then washed two times for 10 min each time with PBS and secondary antibodies were applied in PBS (1:500) for 2 h if necessary. Last, sections were washed three times for 10 min each time with PBS and mounted with ProLong Gold antifade reagent containing DAPI (Invitrogen). All images were acquired with a camera (Optronics) mounted on a fluorescence microscope (Olympus BX41, Leeds Precision Instruments). The brightness/contrast of the acquired digital images was applied equally across the entire image and equally to control images, and then analyzed using Adobe Photoshop CS4 software.
Stereology.
Quantification of myelination by optical density and area in were quantified by immunocytochemistry and ImageJ software based on FluoroMyelin. Quantification of T cells was counted manually by nonbiased stereology in a double-blinded manner. Quantification of Immunostaining was performed with ImageJ to measure area fraction by nonbiased stereology in a double-blinded manner. For each histological quantification, a minimum of five separate sagittal sections for each region of each mouse was analyzed to best reconstruct the overall 3-dimensional structure of the tissue. The number of immunopositive cells were quantified by analyzing digital images collected using Olympus software. For each sections 5–10 fields-of-view were randomly sampled at 10× magnification from each brain region-of-interest starting with the olfactory bulbs then back toward the brainstem and spinal cord. We used a computerized threshold to detect markers for area fraction analyses.
Antibodies.
The following fluorophore-conjugated antibodies were purchased from BD Biosciences: anti-CD4 (RM4-5), anti-CD8 (53-6.7), anti-CD11c (557400) anti-CD90.1 (Thy1.1) (OX-7). All isotype controls were purchased from BD Biosciences. GFP booster was purchased from Bulldog Biosciences. Anti-Fcγ-R (2.4G2) was produced from a hybridoma. IBA-1 (019-19741) was purchased from WAKO. FluoroMyelin (F34652) and Click-IT Plus TUNEL assay (C10617) was purchased from ThermoFisher Scientific. Anti-CX3CR1 (SA011F11) was purchased from BioLegend and anti-CX3CL1 (126315) was purchased from R&D Systems. Anti-GFAP (AB5541), anti-Neun (MAB377B) and anti-CNPase (AB9342) was purchased from EDM Millipore.
Experimental design and statistical analysis.
Data for Figure 1 was performed on a combination of naive male and female mice (n = 5). Sampling for tissue sections for Figure 1a–c is detailed in stereology section above. Mann–Whitney U test was performed for Figure 1d and included two independent experiments. P values for hippocampus, cortex, brainstem, and cerebellum was 0.0079. Experimental design for Figure 2 is shown in Figure 2a and was performed on a combination of male and female mice (n = 6). Mann–Whitney U test was performed for Figure 2, c and d, and included three independent experiments (p = 0.0411). Experimental design for Figure 3 is shown in Figure 3a and was performed in female mice (n = 17, 11). Linear regression was performed for Figure 3b left and included six independent experiments. P values were <0.0001. Mann–Whitney U test was performed for Figure 3b, right, and included six independent experiments. Sampling for tissue sections for Figure 3c is detailed in stereology section above. Mann–Whitney U test was performed for Figure 3d and included three independent experiments (n = 6). P value was 0.0022. Experimental design for Figure 4 is shown in Figure 3a and was performed in female mice (n = 5). Mann–Whitney U test was performed for hippocampus/cortex (p = 0.0079), brainstem/cerebellum (p = 0.0079), and spinal cord (p = 0.0159). Sampling for tissue sections for Figure 4c is detailed in stereology section above. Experimental design for Figure 5 is shown in Figure 3a and was performed in female mice (n = 6). Mann–Whitney U test was performed in Figure 5b in two independent experiments (p = 0.0022). Mann–Whitney U test was performed for Figure 5d in two independent experiments (p = 0.0159). Mann–Whitney U test was performed for Figure 5e in two independent experiments (p = 0.0159 for diencephalon. p = 0.0079 for hippocampus and cortex). Experimental design for Figure 6, a and b, is shown in Figure 3a and was performed in female mice (n = 6). Mann–Whitney U test was performed for Figure 6b in two independent experiments (p = 0.0411). Experimental design for Figure 6d–f is shown in Figure 6c. Mann–Whitney U test was performed in Figure 6e in two independent experiments (P = < 0.0001). Experimental design for Figure 7 is shown in Figure 3a and was performed in female mice (n = 5). Sampling for tissue sections for Figure 7a is detailed in stereology section above. Mann–Whitney U test was performed in Figure 7, b and c in two independent experiments (p = 0.0159). Experimental design for Figure 8 is shown in Figure 3a and was performed in female mice (n = 5). Sampling for tissue sections for Figure 8a is detailed in stereology section above. Mann–Whitney U test was performed in Figure 8b (p = 0.0022). Mann–Whitney U test was applied to compare measures between two groups and were computed using InStat software (GraphPad Software) to make statistical comparisons between groups (Figs. 1–8). Each group of transgenic mice was compared with nontransgenic littermate controls. Multiple comparisons were made using one-way ANOVA or two-way ANOVA where appropriate. Linear regression was applied to access differences in EAE clinical score (Figs. 3, Fig. 6). Data represent mean ± SEM; *p < 0.05, **p < 0.01, ***p < 0.001, ****p < 0.0001. All quantifications were made in 5–10 sagittal sections per mouse using 5–10 animals per transgenic mice. Exact n numbers, number of independent experiments, p values, and statistical tests are also listed within the figure legends.
Figure 1.

GFP expression of CNPase and nestin-derived antigens in the CNS. a, Representative image of brain section from brainstem stained with CNPase (left), GFP (center), and merged (right) in CnpCre+/− OVAfl/fl mice. Scale bar, 10 μm. White arrows depict colocalization of cell-specific markers with GFP tagged neoepitope expression. b, Representative image of brain section from cortex stained with NeuN (left), GFP (center), and merged (right) in NesCre+/− OVAfl/fl mice. Scale bar, 10 μm. White arrows depict colocalization of cell-specific markers with GFP tagged neoepitope expression. c, Representative image of brain section stained with GFAP (left), GFP (center), and merged (right) in NesCre+/− OVAfl/fl mice. Scale bar, 10 μm. White arrows depict colocalization of cell-specific markers with GFP tagged neoepitope expression. d, Quantification of regional GFP expression by measure of area fraction in different CNS areas of CnpCre+/− OVAfl/fl and NesCre+/− OVAfl/fl mice (n = 5; 2 independent experiments). Data represent mean ± SEM. *p < 0.05. Mann–Whitney U test (d).
Figure 2.

Systemic antigen sampling by T cells of CNPase and nestin-derived antigens is similar under homeostatic conditions. a, Experimental design to test systemic T-cell proliferation in response to CNS-derived OVA antigens. Mice received 106 epitope-specific T cells intravenously. FACS staining was performed on CLN-derived lymphocytes 5 d post-transfer. b, Histograms show representative CellTrace Violet dilution of CD8+Thy1.1+ cells (top) and CD4+Thy1.1+ cells (bottom) from CLNs of each genotype of mice. c, Quantification of mean number of CellTrace Violet low/int CD8+/Thy1.1+ cells from CLNs of each mouse. d, Quantification of mean number of CellTrace Violet low/int CD4+/Thy1.1+ cells from CLNs of each mouse (n = 6; 3 independent experiments). Data represent mean ± SEM. *p < 0.05. Mann–Whitney U test (c, d).
Figure 3.

Antigen-specific T cells differentially affect EAE in CNPase and nestin-derived neoepitope-expressing transgenic mice. a, Experimental design to test the influence of secondary antigen-specific T cells on ongoing EAE. EAE was induced at day 0 in CnpCre+/− OVAfl/fl, CnpCre+/− OVA−/−, NesCre+/− OVAfl/fl and NesCre+/− OVA−/− mice. OVA peptide-specific OT-I Thy1.1 and OT-II Thy1.1 T cells were transferred intravenously at onset of disease (EAE days 7–10). EAE scores were monitored and mice were sacrificed at EAE day 30. b, Clinical score data in mice from day 0 to day 30 EAE (left) and average clinical scores for each mouse at terminal time point (right; n = 17, 11 mice, 6 independent experiments). c, Representative images of spinal cord in mice with No EAE and at EAE day 30 stained with FluoroMyelin-PE. White line depicts area of demyelination. Scale bar, 50 μm. The green box indicates the regions where image was magnified. d, Quantification of normalized demyelination in thoracic spinal cord of mice at EAE day 30 (n = 6 mice, 3 independent experiments). Data represent mean ± SEM. **p < 0.01, ****p < 0.0001 [linear regression (b, left, EAE plot), Mann–Whitney U test (b, right, d)].
Figure 4.

Antigen-specific T cells differentially steer the localization of immune responses in the CNS of Nestin and CNPase neoepitope-expressing mice during EAE. a, Quantification of CD4 T cells (left) per 10 μm2 different brain regions and spinal cord at EAE day 30. Quantification of CD8 T cells (right) per 10 μm2 different brain regions and spinal cord at EAE day 30 (n = 5, 2 independent experiments). b, Representative images of hippocampus (top) and brainstem (bottom) sections stained with CD4 (red), CD8 (green), and DAPI (blue) in CnpCre+/− OVAfl/fl and NesCre+/− OVAfl/fl mice at EAE day 30. Scale bar, 80 μm. White “*” depicts CD8 T cells and white “#” depicts CD4 T cells. Data represent mean ± SEM. *p < 0.05, **p < 0.01. Mann–Whitney U test (a).
Figure 5.

Antigen-specific T cells form clusters with CD11b+ CD11c+ myeloid cells in distinct CNS regions during EAE. a, Representative gating of CD45high CD11b+ CD11c+ myeloid cells from mice. Infiltrating myeloid cells are gated as CD45high CD11b+ CD11c+. Gating of CD11c+ cells based on IgG1 isotype control as stated in the Materials and Methods. b, Quantification of CD45high CD11b+CD11c+ cells per gram tissue in whole brain at EAE day 30 (n = 6, 2 independent experiments). c, Representative images of myeloid cell–T-cell clusters in brainstem of CnpCre+/− OVAfl/fl mice at EAE day 30. Scale bar, 20 μm (CD4 = red, CD11c = green, DAPI = blue). White arrows depict the localization of the clusters. d, Quantification of CD3/CD11c+ clusters in different brain areas and spinal cord at EAE day 30 in CnpCre+/− OVAfl/fl and CnpCre+/− OVA−/− mice (n = 5, 2 independent experiments). e, Quantification of CD3/CD11c+ clusters in different brain areas and spinal cord at EAE day 30 in NesCre+/− OVAfl/fl and NesCre+/− OVA−/− mice (n = 5, 2 independent experiments). Data represent mean ± SEM. *p < 0.05, **p < 0.01. Mann–Whitney U test (b, d, e).
Figure 6.

CX3CR1 expression on antigen-specific T cells drives their localization to-specific regions in the CNS and influences EAE outcome. a, High-magnification representative image stained with CX3CL1 (first panel), CD11c (second panel), IBA-1 (third panel), and merged (fourth panel) of brainstem in CnpCre+/− OVAfl/fl mice and cortex in NesCre+/− OVAfl/fl mice at EAE day 30. Scale bar, 5 μm. White arrows depict CD11c+ CX3CL1-expressing cells. b, Quantification of percentage of CD45high CD11b+ CD11c+ that are CX3CL1+ in the whole brain of mice at EAE day 30 (n = 6, 2 independent experiments). c, Experimental design to test the influence of secondary antigen-specific T cells deficient in CX3CR1 on ongoing EAE. EAE was induced at day 0 in CnpCre+/− OVAfl/fl, CnpCre+/− OVA−/−, NesCre+/− OVAfl/fl, and NesCre+/− OVA−/−. CX3CR1 deficient OVA peptide-specific OT-I Thy1.1 and OT-II Thy1.1 T cells were transferred intravenously at onset of disease (EAE days 7–10). EAE scores were monitored and mice were sacrificed at EAE day 30. d, Representative gating of CX3CR1+ Thy1.1+ single-positive, double-positive, and double-negative cells from cells gated on combined single-positive CD4 and CD8 T cells from brainstem and cerebellum (top row) and hippocampus and cortex (bottom row). e, Quantification of absolute number of CX3CR1+ Thy1.1+ cells per gram tissue in brainstem and cerebellum (left) and quantification of absolute number of CX3CR1+ Thy1.1+ cells per gram tissue in hippocampus and cortex (right; n = 6, 2 independent experiments). f, EAE clinical score data in mice from day 0 to day 30 Data are pooled from two independent experiments (n = 8) EAE was induced at day 0 in CnpCre+/− OVAfl/fl, CnpCre+/− OVA−/−, NesCre+/− OVAfl/fl and NesCre+/− OVA−/−. CX3CR1 deficient OVA peptide-specific OT-I Thy1.1 and OT-II Thy1.1 T cells were transferred intravenously at onset of disease (EAE days 7–10). EAE scores were monitored and mice were killed at EAE day 30. Data represent mean ± SEM. *p < 0.05, ****p < 0.0001 [linear regression (f, EAE plot), Mann–Whitney U test (b, e)].
Figure 7.
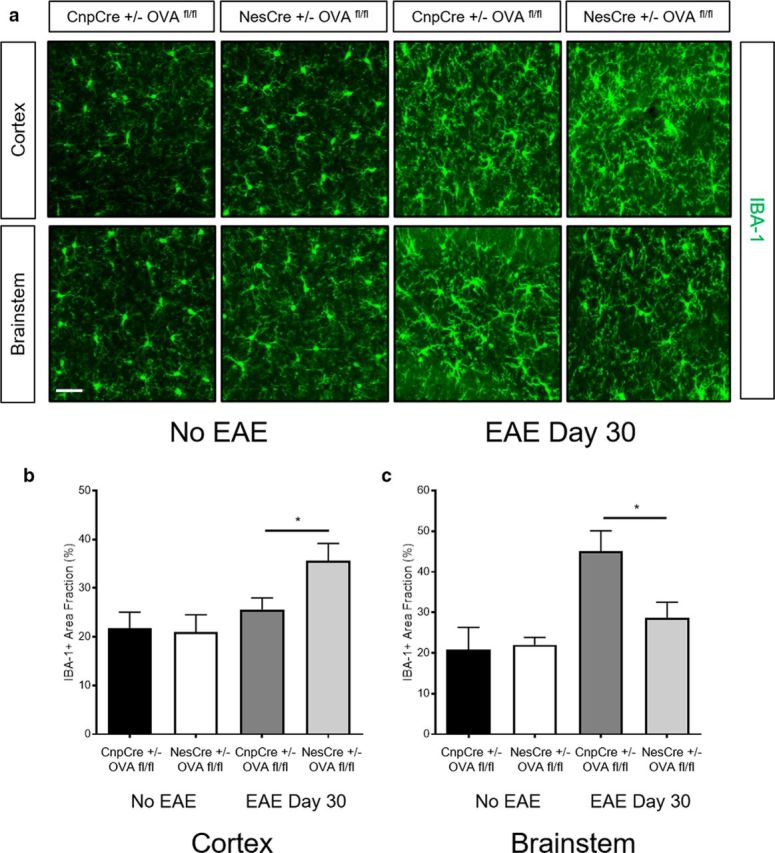
Antigen-specific T cells differentially affect myeloid cell morphology and distribution in CNPase and nestin-derived neoepitope-expressing transgenic mice during EAE. a, Representative images of cortex (top) and brainstem (bottom) sections stained with IBA-1 of naive CnpCre+/− OVAfl/fl and NesCre+/− OVAfl/fl mice as well as CnpCre+/− OVAfl/fl and NesCre+/− OVAfl/fl mice at EAE day 30. Scale bar, 10 μm. b, Quantification of IBA-1+ cells by measure of area fraction in the cortex of naive CnpCre+/− OVAfl/fl and NesCre+/− OVAfl/fl mice as well as CnpCre+/− OVAfl/fl and NesCre+/− OVAfl/fl mice at EAE day 30 (n = 6, 2 independent experiments). c, Quantification of IBA-1+ cells by measure of area fraction in the brainstem of naive CnpCre+/− OVAfl/fl and NesCre+/− OVAfl/fl mice as well as CnpCre+/− OVAfl/fl and NesCre+/− OVAfl/fl mice at EAE day 30 (n = 6, 2 independent experiments). Data represent mean ± SEM. *p < 0.05. Mann–Whitney U test (b, c).
Figure 8.

Antigen-specific T cells differentially influence TUNEL expression on neurons in CNPase and nestin-derived neoepitope-expressing transgenic mice during EAE. a, Representative images of cortex and brainstem sections stained with NeuN (red), TUNEL (green), and DAPI (blue) of CnpCre+/− OVAfl/fl and NesCre+/− OVAfl/fl mice at EAE day 30. Scale bar, 10 μm. b, Quantification of the percentage NeuN+ cells also positive for TUNEL in the cortex and brainstem of CnpCre+/− OVAfl/fl and NesCre+/− OVAfl/fl mice at EAE day 30 (n = 5). Data represent mean ± SEM. **p < 0.01. Mann–Whitney U test (b).
Ethics statement.
C57BL/6 WT mice were obtained from The Jackson Laboratory. Transgenic pZ/EG-OVA mice were generated at the University of Wisconsin Biotechnology Center Transgenic Facility by microinjection of linearized, purified DNA into one-cell C57BL/6 embryos. The Cnp1Cre/Cre mice were a generous gift from Dr. Brian Popko (University of Chicago, Chicago, IL). Experimental mice underwent adoptive transfer and/or EAE induction. All animal procedures used in this study were conducted in strict compliance with the NIH Guide for the Care and Use of Laboratory Animals and approved by the University of Wisconsin Center for Health Sciences Research Animal Care Committee. All mice (∼25 g) were anesthetized with isoflurane for procedures, and all efforts were made to minimize suffering.
Data availability.
The data that support the findings of this study are available from the corresponding author upon request.
Results
Peripheral antigen sampling by T cells of CNPase and nestin-derived neoepitopes is similar under homeostatic conditions
To test how distinct CNS cell-derived neoepitopes are recognized by peripheral T cells, we used the pZ/EG plasmid to create the transgenic loxP-carrying pZ/EG-OVA mice having the DNA coding sequence for EGFP, OVA peptides OVA257–264 (MHC class I-restricted, recognized by OT-I T cells) and OVA323–339 (MHC class II-restricted, recognized by OT-II T cells), as well as control peptide PCC88–104 (Harris et al., 2014). The pZ/EG-OVA mouse strain was crossed with the Nestin-Cre or CNPase-Cre mice to obtain CnpCre+/− OVAfl/fl (Cnp-OVA) and NesCre+/− OVAfl/fl mice (Nes-OVA), as well as respective littermates (CnpCre+/− OVA−/− and NesCre+/− OVA−/− mice).
Immunofluorescence staining with GFP booster antibodies in combination with CNPase confirmed that Cnp-OVA mice successfully incorporated EGFP into CNP+ cells, whereas the littermates did not (Fig. 1a). We then evaluated the regional distribution of GFP expression in the brains of the Cnp-OVA and littermate strains. This revealed that the GFP expression was more localized to the brainstem and cerebellum in Cnp-OVA mice relative to other brain regions (Fig. 1d). We also confirmed that Nes-OVA mice successfully incorporated EGFP into NeuN+ cells (Fig. 1b). Nes-OVA mice also minimally expressed GFP in some GFAP+ cells (Fig. 1c). We did not visualize any noticeable GFP staining of endothelial cells or microglia in the Nes-OVA mice (data not shown). Furthermore, we evaluated the regional distribution of GFP in the brains of the Nes-OVA and littermates, which revealed that the GFP expression was more localized to the cortex and hippocampus in Nes-OVA mice relative to other brain regions (Fig. 1d).
To test antigen sampling in the periphery from distinct CNS cell-derived neoepitopes under steady-state conditions; we adoptively transferred naive CellTrace Violet-labeled CD8+Thy1.1+ OT-I and CD4+Thy1.1+OT-II T cells into Cnp-OVA and Nes-OVA mice as well as their littermate strains (Fig. 2a). Five days post-adoptive transfer we observed significant CellTrace Violet dilution of OT-I cells in the CLNs of Cnp-OVA and Nes-OVA mice but not in littermate strains (Fig. 2b,c). We also observed significant CellTrace Violet dilution of OT-II cells in the cervical lymph nodes (CLNs) of Cnp-OVA and Nes-OVA mice compared with littermate controls but not to the same extent (Fig. 2b,d). These data show that despite the distinct difference in regional distribution of neoepitopes in the Cnp-OVA and Nes-OVA mice, both strains display similar levels of peripheral T cell surveillance.
Antigen-specific T cells differentially affect EAE in CNPase and nestin-derived neoepitope-expressing transgenic mice
We next tested how distinct CNS cell-derived neoepitope-specific T cells affect ongoing neuroinflammation modeled in EAE. To do this, we induced EAE in Cnp-OVA and Nes-OVA mice as well as their respective littermate strains. Once EAE symptoms were detectable (days 7–10), we adoptively transferred OVA-specific T cells and monitored the EAE clinical scores and pathology (Fig. 3a). Our data revealed that transfer of OT-I and OT-II cells into Cnp-OVA mice with ongoing EAE significantly accelerated and augmented EAE clinical score compared with littermate controls. Contrastingly, transfer of OVA-specific T cells into Nes-OVA mice with ongoing EAE significantly reduced EAE clinical scores (Fig. 3b). Transfer of only OT-I and/or OT-II T cells at days 7–10 did not elicit significant changes in EAE scores as well (data not shown). Histopathological analysis using FluoroMyelin and staining verified EAE clinical scores showing that Cnp-OVA mice had significantly more demyelination in the spinal cord compared with littermate strains and Nes-OVA mice had significantly less demyelination compared with littermate mice (Fig. 3c,d). These data indicate that distinct CNS cell-derived neoepitope-specific T cells differentially affect ongoing MOG35–55-induced EAE clinical score and pathology in mice.
Antigen-specific T cells differentially steer the localization of immune responses in the CNS of nestin and CNPase neoepitope-expressing mice during EAE
To understand the contrasting effect of the adaptive transfer of OVA-specific T cells on EAE clinical scores in Nes-OVA or Cnp-OVA mice, we analyzed T-cell distribution in the CNS tissues of Cnp-OVA and Nes-OVA mice. Following quantification of CD4 T cells via immunohistochemistry, we found that Cnp-OVA mice had a significantly higher number of CD4 T cells in the spinal cord, brainstem, and cerebellum relative to littermate strains at EAE day 30. On the other hand, we observed that the Nes-OVA mice had significantly more CD4 T cells in the hippocampus and cortex relative to littermate strains at EAE day 30 (Fig. 4a, left). Analyses of the CD8 T cell numbers revealed similar results, showing that that Cnp-OVA mice had significantly more CD8 T cells in the brainstem and cerebellum relative to littermates and the Nes-OVA mice had significantly more CD8 T cells in the hippocampus and cortex relative to littermates (Fig. 4a, right). Analysis of Cnp-OVA mice at EAE day 30 revealed that although there were some CD4 T cells near the hippocampus in the CA3 region, there were very little if any CD8 T cells in the hippocampus (Fig. 4b). Contrastingly, in the brainstem of Cnp-OVA mice at EAE day 30, there is a dense population of both CD4 and CD8 T cells. Representative images of Nes-OVA mice at EAE day 30 reveal a highly dense population of CD4 T cells throughout the hippocampus and also sporadically distributed CD8 T cells in the same area with limited amount of CD4 and CD8 T cells in the brainstem relative to Cnp-OVA mice (Fig. 4b). These data suggest that distinct CNS cell-derived neoepitope-specific T cells steer the localization of immune responses in mice with ongoing EAE within the CNS toward the location of their cognate antigen.
Antigen-specific T cells form clusters with CD11b+ CD11c+ myeloid cells in distinct CNS regions during EAE
Given previous data showing the importance of myeloid cells in facilitating interactions between T cells of different antigen specificities (Karman et al., 2004a,b; Anandasabapathy et al., 2011), we evaluated the frequency of CD45high CD11b+ CD11c+ cells in the brain during EAE in each of the four mouse strains. To do this, we isolated whole brains from Cnp-OVA and Nes-OVA mice as well as littermate strains at EAE day 30 that received the transfer of OVA-specific T cells at the onset of disease. Using flow cytometry, we gated on the CD45high CD11b+ cells to distinguish infiltrating myeloid cells from local microglia, and analyzed the CD11c+-expressing cells. These data revealed that both the Cnp-OVA and Nes-OVA mice had higher numbers of CD45high CD11b+ CD11c+ cells relative to their respective littermate mice from the brain (Fig. 5 a,b). Representative images from the brainstem of Cnp-OVA mice depict myeloid cell-T cell clusters stained with CD11c and CD4 (Fig. 5c). Furthermore, we quantified the number of CD11c+/CD3+ clusters in different regions of the CNS using immunohistochemistry. We show the Cnp-OVA mice had significantly more myeloid cell-T cell clusters in the brainstem, cerebellum, and spinal cord relative to littermates (Fig. 5d). These data also revealed that the Nes-OVA mice had significantly more myeloid cell-T cell clusters in the diencephalon, hippocampus, and cortex compared with their littermates (Fig. 5e). Altogether, this suggests that transfer of antigen-specific T cells into mice with ongoing EAE leads to enrichment of myeloid cell–T-cell clusters in distinct CNS regions.
CX3CR1 expression on antigen-specific T cells drives their localization to specific regions in the CNS and influences EAE outcome
To understand the mechanism of how neoepitope-specific T cells migrate toward the brainstem and cerebellum in Cnp-OVA mice and toward the hippocampus and cortex in Nes-OVA mice during EAE, we performed immunohistochemistry on an array of cytokines known to be involved in inducing T cell migration during autoimmune neuroinflammation. These results identified CX3CL1 as the most abundant cytokine with regional expression levels highly correlated to the EGFP location in Cnp-OVA and Nes-OVA mice shown in Figure 1. Although CX3CL1 has been shown to be prominently expressed on neurons during EAE (Sunnemark et al., 2005; Lou et al., 2011, 2012; Limatola and Ransohoff, 2014; Panek et al., 2015), several groups have identified CX3CL1 expression on CD11c+ cells, which is important for the recruitment of encephalitogenic T cells during various diseases (Kanazawa et al., 1999; Papadopoulos et al., 1999; Nukiwa et al., 2006). Given these data, we performed immunohistochemistry and performed flow cytometry on brains from Cnp-OVA and Nes-OVA mice as well as their respective littermate strains at EAE day 30 following the transfer of OVA-specific T cells at the onset of disease. Representative images indicate that myeloid cell–T-cell clusters in Cnp-OVA mice contain CD11c+ CX3CL1+-expressing cells mainly in the brainstem, whereas in myeloid cell–T-cell clusters in Nes-OVA mice, CD11c+ CX3CL1+-expressing cells localize mainly in the cortex (Fig. 6a). Flow cytometry of the whole brains revealed that Cnp-OVA mice and Nes-OVA mice both had a higher percentage of CD45high CD11c+ CX3CL1+-expressing cells compared with their respective littermate strains (Fig. 6b).
To test whether CX3CR1 expression on antigen-specific T cells drives their migration to distinct brain regions, we induced EAE in Cnp-OVA and Nes-OVA mice as well as their littermate strains. Once EAE symptoms began (days 7–10), we adoptively transferred CX3CR1 KO and WT OVA-specific T cells into the host mice and monitored the EAE clinical scores and pathology (Fig. 6c). We then isolated the brainstem and cerebellum as well as the hippocampus and cortex from these mice to find out where the CX3CR1+ T cells were located in each of the mice. Our results also show that CX3CR1+ T cells primarily localized to the brainstem and cerebellum of Cnp-OVA mice and to the hippocampus and cortex of Nes-OVA mice (Fig. 6d,e). More importantly, we observed that adoptive transfer of CX3CR1 KO OVA-specific T cells into Cnp-OVA mice and Nes-OVA mice did not affect EAE scores compared with the transfer of WT OVA-specific T cells into the same host mice (Fig. 6f). These results indicate that the influence of distinct CNS cell-derived antigen-specific T cells on mice with EAE is dependent on CX3CR1 driven migration to distinct areas.
Antigen-specific T cells differentially affect myeloid cell morphology and distribution in CNPase and nestin-derived neoepitope-expressing transgenic mice during EAE
To evaluate whether or not the differential distribution of OVA-specific T cells influence myeloid cells during EAE, we performed immunohistochemistry on sections from Nes-OVA and Cnp-OVA mice without EAE and at EAE day 30. These experiments revealed that Nes-OVA mice had higher levels of IBA-1 in the cortex compared with Cnp-OVA mice at EAE day 30 or compared with No EAE mice (Fig. 7a,b). On the other hand, Cnp-OVA mice had higher levels of IBA-1 staining in the brainstem relative to Nes-OVA mice at EAE day 30 and No EAE mice (Fig. 7a,c). These results suggest that the differential distribution of T cells in the Nes-OVA and Cnp-OVA mice during EAE correlates with augmented myeloid cell activation by measure of IBA-1 expression.
Antigen-specific T cells differentially influence TUNEL expression on neurons in CNPase and nestin-derived neoepitope-expressing transgenic mice during EAE
To address whether the increased immune cell load in different brain areas influenced neuronal death regionally in Cnp-OVA and Nes-OVA mice, we performed a TUNEL assay in conjunction with NeuN staining on brain sections from Cnp-OVA and Nes-OVA mice at EAE day 30. These results revealed that Nes-OVA mice had a greater expression of double-expressing TUNEL+ NeuN+ cells in the cortex at EAE day 30 compared with Cnp-OVA mice. On the other hand, Cnp-OVA mice had a greater higher expression of double-expressing TUNEL+ NeuN+ cells in the brainstem at EAE day 30 compared with Nes-OVA mice (Fig. 8a,b). These results indicate that while Nes-OVA mice display reduced EAE scores compared with Cnp-OVA mice, they may have dysfunction related to higher-order brain areas such as memory and cognition due to the neuronal death observed in the cortex.
Discussion
Our data highlight the importance of the cellular source and regional location of autoreactive CNS antigens while also reveal a novel mechanism for how antigen-specific T cells migrate and influence outcome during CNS autoimmunity. We have previously shown that antigen sampling and immunosurveillance in the CNS are similar to nonimmune privileged tissues but antigen-specific T cells infiltrate the CNS only when neuroinflammation is present (Harris et al., 2014). Here, we studied how the same T cells respond to their cognate antigens when the antigens are expressed distinctly in different CNS cell types and regions as well as how they influence the outcome of neuroinflammatory disease. We show that T-cell peripheral sampling from the CNS is independent of where and what cell type the neoepitopes are derived from. We also show that CX3CR1-dependent T-cell migration to distinct brain regions significantly influences the outcome of ongoing neuroinflammatory disease.
Using different antigen expressing CNS cell-specific T-cell transgenic models, other laboratories have shown that multiple antigen-specific T cells can influence the course of neuroinflammatory disease (Na et al., 2008; Saxena et al., 2008). Several models have been used to induce expression of foreign antigens into various CNS cells using oligodendrocyte (Leone et al., 2003; Hövelmeyer et al., 2005; Cao et al., 2006; Na et al., 2008; Saxena et al., 2008; Schildknecht et al., 2009), astrocyte (Cornet et al., 2001), and neuronal promoters (Casanova et al., 2001; Sanchez-Ruiz et al., 2008; Scheikl et al., 2012), yet, there are no studies to test whether the same antigen-specific T cells can influence ongoing myelin initiated autoimmune disease differentially based on the location and cellular source of the epitopes. Following MOG35–55-induced neuroinflammation, we show that antigen-specific T cells influence clinical outcome in a distinct manner depending on the source and location of the neoepitopes.
The influence of multiple antigen-specific T cells on EAE also depends on the regional location of myeloid cell-T cell clusters within the CNS. This suggests that CD11c-expressing infiltrating cells could provide a platform for interaction between T cells of different antigen specificities. Our flow cytometry data suggest that most of the CD11c+ cells are peripherally derived (CD45high CD11b+ CD11c+). Several studies, including this one, have shown that myeloid cells can contribute to the inflammatory microclusters seen in EAE and MS lesions. These clusters have been described before and can strongly express chemokines such as CCL5, CX3CL1, CXCL19, and CXCL10 which are critical for the recruitment of encephalitogenic T cells (Paterka et al., 2016). Future studies to evaluate whether inhibiting myeloid cell function and activity can influence T-cell migration and phenotype in our system is imperative. Moreover, it will be key to identify the myeloid cell-specific factors responsible for augmenting proinflammatory cascades involving T cells of multiple antigenic specificities.
Finally, our data indicate that the influence of the transfer of antigen-specific T cells into ongoing MOG-induced EAE is dependent on their expression of CX3CR1. Although several studies identify CX3CL1 to be prominently expressed on neurons during EAE(Harrison et al., 1998; Sunnemark et al., 2005; Lou et al., 2011, 2012; Limatola and Ransohoff, 2014), the role of the ligand on neural cells during autoimmune diseases of the CNS is unclear. Interestingly CX3CR1 KO mice have more severe EAE compared with WT, yet this has been suggested to be mainly due to the role of NK cells and microglia. NK cells have been suggested to limit autoimmune responses by killing DCs and producing regulatory cytokines (Huang et al., 2006; Hertwig et al., 2016), whereas microglial CX3CR1 is suggested to quell their activation and limit their proinflammatory influence on EAE(Garcia et al., 2013). These data highlight the importance of targeting chemokine receptors in a cell-specific manner when treating disease. Our data suggest that the CX3CL1 on dendritic cells plays a major role in facilitating the recruitment CX3CR1-dependent T-cell responses, which is in line with other work assessing CX3CL1-dependent migration and immune surveillance (Kanazawa et al., 1999; Papadopoulos et al., 1999; Sunnemark et al., 2005; Nukiwa et al., 2006; Garcia et al., 2013; Böttcher et al., 2015; Gerlach et al., 2016). These data strongly suggest that CX3CR1+ T cells are responding to DC expression of CX3CL1+ providing novel information about how CX3CR1 contributes to the localization of antigen-specific T cells in the CNS.
Our data show that transgenic mice that express OVA antigens in Nestin+ cells have lower EAE clinical scores following OVA-specific T-cell transfer given that the immune response is steered from motor to non-motor-associated brain areas such as the hippocampus and cortex. While this effect is beneficial for EAE clinical score, a key question is how this influences the brain areas where the T cells end up and their impact on hippocampal and cortical-dependent brain functions. Recent studies have suggested that neuronal produced factors can direct T cell phenotype (Liu et al., 2014, 2017) to protect mice from the detrimental effects of autoimmune disease (Flügel et al., 2000) so it is possible that these brain areas are better equipped to handle proinflammatory environments. Nonetheless, our data reveal that there is in fact more neuronal death in the cortex of Nes-OVA mice compared with Cnp-OVA mice at EAE day 30 suggesting that these mice could have higher-order brain deficits in memory or cognition. Although other murine models have been developed to understand how autoimmune T cells affect neuroinflammation in higher-order brain areas (Howe et al., 2012; Bonfiglio et al., 2017), our models uniquely allow us to study novel questions about the influence of multiple antigen-specific T cells on neuroinflammatory outcome without damaging the brain via cerebral injections of foreign antigens.
In patients affected by CNS autoimmune diseases such as MS, recent work has identified that inflammatory lesions affect different brain regions distinctly (Haider et al., 2016) and that unique clinical outcomes can develop as a response to where neuroinflammatory responses are located within the CNS (Parisi et al., 2014). Future studies entail identifying whether the distribution of myeloid cell–T-cell clusters and T-cell expression of CX3CR1 within the human brain correlates with MS outcome. Moreover, since the effect of antigen-specific T cells on ongoing disease was dependent on CX3CR1 signaling, modifying CX3CR1-dependent T-cell responses might be beneficial for patients inflicted with autoimmune disease. Altogether, these data reveal new information for how antigen-specific peripheral immune cells respond to regionally distinct CNS-derived antigens under naive conditions while also unveil a novel mechanism for how antigen-specific T cells modulate neuroinflammatory disease outcome.
Footnotes
This work was supported by NIH/NIGMS Grant T32 GM007507 (Neuroscience Training Program), NIH Grants R01-NS37570 (Z.F.) and R01-AI048087 (M.S.), and AHA predoctoral Grant 1525500022 (A.R.). We thank Khen Macvilay, Laura Schmitt Brunold, and Satoshi Kinoshita for excellent technical assistance; and Eric Silignavong and Christian Gerhart for assistance.
The authors declare no competing financial interests.
References
- Anandasabapathy N, Victora GD, Meredith M, Feder R, Dong B, Kluger C, Yao K, Dustin ML, Nussenzweig MC, Steinman RM, Liu K (2011) Flt3L controls the development of radiosensitive dendritic cells in the meninges and choroid plexus of the steady-state mouse brain. J Exp Med 208:1695–1705. 10.1084/jem.20102657 [DOI] [PMC free article] [PubMed] [Google Scholar]
- Bonfiglio T, Olivero G, Merega E, Di Prisco S, Padolecchia C, Grilli M, Milanese M, Di Cesare Mannelli L, Ghelardini C, Bonanno G, Marchi M, Pittaluga A (2017) Prophylactic versus therapeutic fingolimod: restoration of presynaptic defects in mice suffering from experimental autoimmune encephalomyelitis. PLoS One 12:e0170825. 10.1371/journal.pone.0170825 [DOI] [PMC free article] [PubMed] [Google Scholar]
- Böttcher JP, Beyer M, Meissner F, Abdullah Z, Sander J, Höchst B, Eickhoff S, Rieckmann JC, Russo C, Bauer T, Flecken T, Giesen D, Engel D, Jung S, Busch DH, Protzer U, Thimme R, Mann M, Kurts C, Schultze JL, et al. (2015) Functional classification of memory CD8(+) T cells by CX3CR1 expression. Nat Commun 6:8306. 10.1038/ncomms9306 [DOI] [PMC free article] [PubMed] [Google Scholar]
- Cao Y, Toben C, Na SY, Stark K, Nitschke L, Peterson A, Gold R, Schimpl A, Hünig T (2006) Induction of experimental autoimmune encephalomyelitis in transgenic mice expressing ovalbumin in oligodendrocytes. Eur J Immunol 36:207–215. 10.1002/eji.200535211 [DOI] [PubMed] [Google Scholar]
- Casanova E, Fehsenfeld S, Mantamadiotis T, Lemberger T, Greiner E, Stewart AF, Schütz G (2001) A CaMKIIalpha iCre BAC allows brain-specific gene inactivation. Genesis 31:37–42. 10.1002/gene.1078 [DOI] [PubMed] [Google Scholar]
- Cornet A, Savidge TC, Cabarrocas J, Deng WL, Colombel JF, Lassmann H, Desreumaux P, Liblau RS (2001) Enterocolitis induced by autoimmune targeting of enteric glial cells: a possible mechanism in Crohn's disease? Proc Natl Acad Sci U S A 98:13306–13311. 10.1073/pnas.231474098 [DOI] [PMC free article] [PubMed] [Google Scholar]
- Engelhardt B, Vajkoczy P, Weller RO (2017) The movers and shapers in immune privilege of the CNS. Nat Immunol 18:123–131. 10.1038/ni.3666 [DOI] [PubMed] [Google Scholar]
- Flach AC, Litke T, Strauss J, Haberl M, Gómez CC, Reindl M, Saiz A, Fehling HJ, Wienands J, Odoardi F, Lühder F, Flugel A (2016) Autoantibody-boosted T-cell reactivation in the target organ triggers manifestation of autoimmune CNS disease. Proc Natl Acad Sci U S A 113:3323–3328. 10.1073/pnas.1519608113 [DOI] [PMC free article] [PubMed] [Google Scholar]
- Flügel A, Schwaiger FW, Neumann H, Medana I, Willem M, Wekerle H, Kreutzberg GW, Graeber MB (2000) Neuronal FasL induces cell death of encephalitogenic T lymphocytes. Brain Pathol 10:353–364. 10.1111/j.1750-3639.2000.tb00267.x [DOI] [PMC free article] [PubMed] [Google Scholar]
- Garcia JA, Pino PA, Mizutani M, Cardona SM, Charo IF, Ransohoff RM, Forsthuber TG, Cardona AE (2013) Regulation of adaptive immunity by the fractalkine receptor during autoimmune inflammation. J Immunol 191:1063–1072. 10.4049/jimmunol.1300040 [DOI] [PMC free article] [PubMed] [Google Scholar]
- Gerlach C, Moseman EA, Loughhead SM, Alvarez D, Zwijnenburg AJ, Waanders L, Garg R, de la Torre JC, von Andrian UH (2016) The chemokine receptor CX3CR1 defines three antigen-experienced CD8 T cell subsets with distinct roles in immune surveillance and homeostasis. Immunity 45:1270–1284. 10.1016/j.immuni.2016.10.018 [DOI] [PMC free article] [PubMed] [Google Scholar]
- Haider L, Zrzavy T, Hametner S, Höftberger R, Bagnato F, Grabner G, Trattnig S, Pfeifenbring S, Brück W, Lassmann H (2016) The topograpy of demyelination and neurodegeneration in the multiple sclerosis brain. Brain 139:807–815. 10.1093/brain/awv398 [DOI] [PMC free article] [PubMed] [Google Scholar]
- Harris MG, Hulseberg P, Ling C, Karman J, Clarkson BD, Harding JS, Zhang M, Sandor A, Christensen K, Nagy A, Sandor M, Fabry Z (2014) Immune privilege of the CNS is not the consequence of limited antigen sampling. Sci Rep 4:4422. 10.1038/srep04422 [DOI] [PMC free article] [PubMed] [Google Scholar]
- Harrison JK, Jiang Y, Chen S, Xia Y, Maciejewski D, McNamara RK, Streit WJ, Salafranca MN, Adhikari S, Thompson DA, Botti P, Bacon KB, Feng L (1998) Role for neuronally derived fractalkine in mediating interactions between neurons and CX3CR1-expressing microglia. Proc Natl Acad Sci U S A 95:10896–10901. 10.1073/pnas.95.18.10896 [DOI] [PMC free article] [PubMed] [Google Scholar]
- Hertwig L, Hamann I, Romero-Suarez S, Millward JM, Pietrek R, Chanvillard C, Stuis H, Pollok K, Ransohoff RM, Cardona AE, Infante-Duarte C (2016) CX3CR1-dependent recruitment of mature NK cells into the central nervous system contributes to control autoimmune neuroinflammation. Eur J Immunol 46:1984–1996. 10.1002/eji.201546194 [DOI] [PMC free article] [PubMed] [Google Scholar]
- Hövelmeyer N, Hao Z, Kranidioti K, Kassiotis G, Buch T, Frommer F, von Hoch L, Kramer D, Minichiello L, Kollias G, Lassmann H, Waisman A (2005) Apoptosis of oligodendrocytes via fas and TNF-R1 is a key event in the induction of experimental autoimmune encephalomyelitis. J Immunol 175:5875–5884. 10.4049/jimmunol.175.9.5875 [DOI] [PubMed] [Google Scholar]
- Howe CL, Lafrance-Corey RG, Sundsbak RS, Lafrance SJ (2012) Inflammatory monocytes damage the hippocampus during acute picornavirus infection of the brain. J Neuroinflammation 9:50. 10.1186/1742-2094-9-50 [DOI] [PMC free article] [PubMed] [Google Scholar]
- Huang D, Shi FD, Jung S, Pien GC, Wang J, Salazar-Mather TP, He TT, Weaver JT, Ljunggren HG, Biron CA, Littman DR, Ransohoff RM (2006) The neuronal chemokine CX3CL1/fractalkine selectively recruits NK cells that modify experimental autoimmune encephalomyelitis within the central nervous system. FASEB J 20:896–905. 10.1096/fj.05-5465com [DOI] [PubMed] [Google Scholar]
- Ji Q, Castelli L, Goverman JM (2013) MHC class I-restricted myelin epitopes are cross-presented by tip-DCs that promote determinant spreading to CD8(+) T cells. Nat Immunol 14:254–261. 10.1038/ni.2513 [DOI] [PMC free article] [PubMed] [Google Scholar]
- Kadowaki A, Miyake S, Saga R, Chiba A, Mochizuki H, Yamamura T (2016) Gut environment-induced intraepithelial autoreactive CD4(+) T cells suppress central nervous system autoimmunity via LAG-3. Nat Commun 7:11639. 10.1038/ncomms11639 [DOI] [PMC free article] [PubMed] [Google Scholar]
- Kanazawa N, Nakamura T, Tashiro K, Muramatsu M, Morita K, Yoneda K, Inaba K, Imamura S, Honjo T (1999) Fractalkine and macrophage-derived chemokine: T cell-attracting chemokines expressed in T cell area dendritic cells. Eur J Immunol 29:1925–1932. 10.1002/(SICI)1521-4141(199906)29:06%3C1925::AID-IMMU1925%3E3.0.CO;2-U [DOI] [PubMed] [Google Scholar]
- Karman J, Ling C, Sandor M, Fabry Z (2004a) Initiation of immune responses in brain is promoted by local dendritic cells. J Immunol 173:2353–2361. 10.4049/jimmunol.173.4.2353 [DOI] [PubMed] [Google Scholar]
- Karman J, Ling C, Sandor M, Fabry Z (2004b) Dendritic cells in the initiation of immune responses against central nervous system-derived antigens. Immunol Lett 92:107–115. 10.1016/j.imlet.2003.10.017 [DOI] [PubMed] [Google Scholar]
- Kaye J, Hsu ML, Sauron ME, Jameson SC, Gascoigne NR, Hedrick SM (1989) Selective development of CD4+ T cells in transgenic mice expressing a class II MHC-restricted antigen receptor. Nature 341:746–749. 10.1038/341746a0 [DOI] [PubMed] [Google Scholar]
- Kerlero de Rosbo N, Milo R, Lees MB, Burger D, Bernard CC, Ben-Nun A (1993) Reactivity to myelin antigens in multiple sclerosis: peripheral blood lymphocytes respond predominantly to myelin oligodendrocyte glycoprotein. J Clin Invest 92:2602–2608. 10.1172/JCI116875 [DOI] [PMC free article] [PubMed] [Google Scholar]
- Krakowski ML, Owens T (2000) Naive T lymphocytes traffic to inflamed central nervous system, but require antigen recognition for activation. Eur J Immunol 30:1002–1009. 10.1002/(SICI)1521-4141(200004)30:4%3C1002::AID-IMMU1002%3E3.0.CO;2-2 [DOI] [PubMed] [Google Scholar]
- Leone DP, Genoud S, Atanasoski S, Grausenburger R, Berger P, Metzger D, Macklin WB, Chambon P, Suter U (2003) Tamoxifen-inducible glia-specific cre mice for somatic mutagenesis in oligodendrocytes and schwann cells. Mol Cell Neurosci 22:430–440. 10.1016/S1044-7431(03)00029-0 [DOI] [PubMed] [Google Scholar]
- Limatola C, Ransohoff RM (2014) Modulating neurotoxicity through CX3CL1/CX3CR1 signaling. Front Cell Neurosci 8:229. [DOI] [PMC free article] [PubMed] [Google Scholar]
- Liu Y, Carlsson R, Comabella M, Wang J, Kosicki M, Carrion B, Hasan M, Wu X, Montalban X, Dziegiel MH, Sellebjerg F, Sørensen PS, Helin K, Issazadeh-Navikas S (2014) FoxA1 directs the lineage and immunosuppressive properties of a novel regulatory T cell population in EAE and MS. Nat Med 20:272–282. 10.1038/nm.3485 [DOI] [PubMed] [Google Scholar]
- Liu Y, Marin A, Ejlerskov P, Rasmussen LM, Prinz M, Issazadeh-Navikas S (2017) Neuronal IFN-beta-induced PI3K/Akt-FoxA1 signalling is essential for generation of FoxA1(+)Treg cells. Nat Commun 8:14709. 10.1038/ncomms14709 [DOI] [PMC free article] [PubMed] [Google Scholar]
- Lou ZY, Chen C, He Q, Zhao CB, Xiao BG (2011) Targeting CB(2) receptor as a neuroinflammatory modulator in experimental autoimmune encephalomyelitis. Mol Immunol 49:453–461. 10.1016/j.molimm.2011.09.016 [DOI] [PubMed] [Google Scholar]
- Lou ZY, Zhao CB, Xiao BG (2012) Immunoregulation of experimental autoimmune encephalomyelitis by the selective CB1 receptor antagonist. J Neurosci Res 90:84–95. 10.1002/jnr.22721 [DOI] [PubMed] [Google Scholar]
- Malyavantham K, Weinstock-Guttman B, Suresh L, Zivadinov R, Shanahan T, Badgett D, Ramanathan M (2015) Humoral responses to diverse autoimmune disease-associated antigens in multiple sclerosis. PLoS One 10:e0129503. 10.1371/journal.pone.0129503 [DOI] [PMC free article] [PubMed] [Google Scholar]
- Mionnet C, Buatois V, Kanda A, Milcent V, Fleury S, Lair D, Langelot M, Lacoeuille Y, Hessel E, Coffman R, Magnan A, Dombrowicz D, Glaichenhaus N, Julia V (2010) CX3CR1 is required for airway inflammation by promoting T helper cell survival and maintenance in inflamed lung. Nat Med 16:1305–1312. 10.1038/nm.2253 [DOI] [PubMed] [Google Scholar]
- Na SY, Cao Y, Toben C, Nitschke L, Stadelmann C, Gold R, Schimpl A, Hünig T (2008) Naive CD8 T-cells initiate spontaneous autoimmunity to a sequestered model antigen of the central nervous system. Brain 131:2353–2365. 10.1093/brain/awn148 [DOI] [PubMed] [Google Scholar]
- Nukiwa M, Andarini S, Zaini J, Xin H, Kanehira M, Suzuki T, Fukuhara T, Mizuguchi H, Hayakawa T, Saijo Y, Nukiwa T, Kikuchi T (2006) Dendritic cells modified to express fractalkine/CX3CL1 in the treatment of preexisting tumors. Eur J Immunol 36:1019–1027. 10.1002/eji.200535549 [DOI] [PubMed] [Google Scholar]
- Panek CA, Ramos MV, Mejias MP, Abrey-Recalde MJ, Fernandez-Brando RJ, Gori MS, Salamone GV, Palermo MS (2015) Differential expression of the fractalkine chemokine receptor (CX3CR1) in human monocytes during differentiation. Cell Mol Immunol 12:669–680. 10.1038/cmi.2014.116 [DOI] [PMC free article] [PubMed] [Google Scholar]
- Papadopoulos EJ, Sassetti C, Saeki H, Yamada N, Kawamura T, Fitzhugh DJ, Saraf MA, Schall T, Blauvelt A, Rosen SD, Hwang ST (1999) Fractalkine, a CX3C chemokine, is expressed by dendritic cells and is up-regulated upon dendritic cell maturation. Eur J Immunol 29:2551–2559. 10.1002/(SICI)1521-4141(199908)29:08%3C2551::AID-IMMU2551%3E3.0.CO;2-T [DOI] [PubMed] [Google Scholar]
- Parisi L, Rocca MA, Mattioli F, Riccitelli GC, Capra R, Stampatori C, Bellomi F, Filippi M (2014) Patterns of regional gray matter and white matter atrophy in cortical multiple sclerosis. J Neurol 261:1715–1725. 10.1007/s00415-014-7409-5 [DOI] [PubMed] [Google Scholar]
- Paterka M, Siffrin V, Voss JO, Werr J, Hoppmann N, Gollan R, Belikan P, Bruttger J, Birkenstock J, Jung S, Esplugues E, Yogev N, Flavell RA, Bopp T, Zipp F (2016) Gatekeeper role of brain antigen-presenting CD11c+ cells in neuroinflammation. EMBO J 35:89–101. 10.15252/embj.201591488 [DOI] [PMC free article] [PubMed] [Google Scholar]
- Qing Z, Sewell D, Sandor M, Fabry Z (2000) Antigen-specific T cell trafficking into the central nervous system. J Neuroimmunol 105:169–178. 10.1016/S0165-5728(99)00265-9 [DOI] [PubMed] [Google Scholar]
- Ransohoff RM, Engelhardt B (2012) The anatomical and cellular basis of immune surveillance in the central nervous system. Nat Rev Immunol 12:623–635. 10.1038/nri3265 [DOI] [PubMed] [Google Scholar]
- Sanchez-Ruiz M, Wilden L, Müller W, Stenzel W, Brunn A, Miletic H, Schlüter D, Deckert M (2008) Molecular mimicry between neurons and an intracerebral pathogen induces a CD8 T cell-mediated autoimmune disease. J Immunol 180:8421–8433. 10.4049/jimmunol.180.12.8421 [DOI] [PubMed] [Google Scholar]
- Saxena A, Bauer J, Scheikl T, Zappulla J, Audebert M, Desbois S, Waisman A, Lassmann H, Liblau RS, Mars LT (2008) Cutting edge: multiple sclerosis-like lesions induced by effector CD8 T cells recognizing a sequestered antigen on oligodendrocytes. J Immunol 181:1617–1621. 10.4049/jimmunol.181.3.1617 [DOI] [PubMed] [Google Scholar]
- Scheikl T, Pignolet B, Dalard C, Desbois S, Raison D, Yamazaki M, Saoudi A, Bauer J, Lassmann H, Hardin-Pouzet H, Liblau RS (2012) Cutting edge: neuronal recognition by CD8 T cells elicits central diabetes insipidus. J Immunol 188:4731–4735. 10.4049/jimmunol.1102998 [DOI] [PubMed] [Google Scholar]
- Schildknecht A, Probst HC, McCoy KD, Miescher I, Brenner C, Leone DP, Suter U, Ohashi PS, van den Broek M (2009) Antigens expressed by myelinating glia cells induce peripheral cross-tolerance of endogenous CD8+ T cells. Eur J Immunol 39:1505–1515. 10.1002/eji.200839019 [DOI] [PubMed] [Google Scholar]
- Staumont-Sallé D, Fleury S, Lazzari A, Molendi-Coste O, Hornez N, Lavogiez C, Kanda A, Wartelle J, Fries A, Pennino D, Mionnet C, Prawitt J, Bouchaert E, Delaporte E, Glaichenhaus N, Staels B, Julia V, Dombrowicz D (2014) CX3CL1 (fractalkine) and its receptor CX3CR1 regulate atopic dermatitis by controlling effector T cell retention in inflamed skin. J Exp Med 211:1185–1196. 10.1084/jem.20121350 [DOI] [PMC free article] [PubMed] [Google Scholar]
- Sunnemark D, Eltayeb S, Nilsson M, Wallström E, Lassmann H, Olsson T, Berg AL, Ericsson-Dahlstrand A (2005) CX3CL1 (fractalkine) and CX3CR1 expression in myelin oligodendrocyte glycoprotein-induced experimental autoimmune encephalomyelitis: kinetics and cellular origin. J Neuroinflammation 2:17. 10.1186/1742-2094-2-17 [DOI] [PMC free article] [PubMed] [Google Scholar]
Associated Data
This section collects any data citations, data availability statements, or supplementary materials included in this article.
Data Availability Statement
The data that support the findings of this study are available from the corresponding author upon request.