Abstract
Electrochemotherapy and irreversible electroporation are gaining importance in clinical practice for the treatment of solid tumors. For successful treatment, it is extremely important that the coverage and exposure time of the treated tumor to the electric field are within the specified range. In order to ensure successful coverage of the entire target volume with sufficiently strong electric fields, numerical treatment planning has been proposed and its use has also been demonstrated in practice. Most of numerical models in treatment planning are based on charge conservation equation and are not able to provide time course of electric current, electrical conductivity, or electric field distribution changes established in the tissue during pulse delivery. Recently, a model based on inverse analysis of experimental data that delivers time course of tissue electroporation has been introduced. The aim of this study was to apply the previously reported time-dependent numerical model to a complex in vivo example of electroporation with different tissue types and with a long-term follow-up. The model, consisting of a tumor placed in the liver with 2 needle electrodes inserted in the center of the tumor and 4 around the tumor, was validated by comparison of measured and calculated time course of applied electric current. Results of simulations clearly indicated that proposed numerical model can successfully capture transient effects, such as evolution of electric current during each pulse, and effects of pulse frequency due to electroporation effects in the tissue. Additionally, the model can provide evolution of electric field amplitude and electrical conductivity in the tumor with consecutive pulse sequences.
Keywords: electroporation, colorectal liver metastasis, numerical modeling, treatment, planning, electric current
Introduction
Electroporation, also known as electropermeabilization and pulsed electric field treatment, is an efficient physical way of enhancing transport of molecules across cellular membranes by exposure of cells (both eukaryotic and prokaryotic) to high-voltage electric pulses.1,2 There are already many applications of electroporation in biomedicine, biotechnology, and food technology. Medical applications such as electrochemotherapy (ECT) and irreversible electroporation (IRE) for treating solid tumors, ablation of soft tissue like cardiac muscle, gene transfer for gene therapy, and DNA vaccinations are being tested in clinical trials.3 Electrochemotherapy combines electroporation with the use of chemotherapeutic drugs, which results in a large potentiation of the drugs’ efficacy.4-7 In comparison to classical protocols of chemotherapy, ECT requires lower drug doses and provides localized treatment. Clinical trials in humans have demonstrated excellent results in antitumor therapy, especially for adenocarcinoma, basal cell carcinoma, treatment of head and neck squamous carcinoma, and melanoma.8 Until now, ECT as a standard clinical procedure has been successfully used for the treatment of cutaneous and subcutaneous metastases of various cancers.5
Presence of chemotherapeutic drug and adequate local electric field distribution are crucial for therapy’s success.9 Electric field distribution in the tissue is determined by the tissue dielectric properties, electrode positioning, and applied pulse parameters. To ensure successful coverage of the entire target volume with sufficiently strong electric fields, numerical treatment planning has been proposed and its use has also been demonstrated in practice.10-13 In addition to electric field, electric current established due to applied electric pulses, temperature increase in the tissue, and cell death can be predicted by means of numerical modeling.14-16 Previously, numerical models were based on charge conservation equation that described the state of the electroporated tissue at the end of a long pulse or a train of pulses and were not able to provide time course of electric current, electrical conductivity, or electric field distribution changes established in the tissue during pulse delivery. Recently, a model describing the time-dependent course of tissue electroporation has been described.17 This numerical model is based on inverse analysis of experimental data obtained by measurement of electric current established in bovine liver samples during application of electric pulses of a broad range of voltage amplitudes, pulse durations, and pulse repetition frequencies. This model is able to predict the time evolution of an electric pulse current within a 5% error for a simple, well-defined geometric case of 2 parallel inserted needle electrodes in homogeneous bovine liver samples.
The aim of this study was to apply the previously reported time-dependent numerical model to a more realistic and complex in vivo example of electroporation with different tissues types and with a long-term follow-up. The case is described in detail by Edhemovic et al, where a solitary metastasis in the human liver was successfully treated with ECT.18 Prior to the procedure, numerical treatment planning was performed using a 3-D model geometry based on segmented magnetic resonance imaging (MRI) images. The model consisted of tumor placed in the liver with 2 needle electrodes inserted in the center of the tumor and 4 around the tumor. At that time, solving of the numerical model was based on charge conservation and was able to provide results, that is, electric current and electric field in the treated tissue, only at the end of the pulse sequences. In the present study, the same geometry was implemented in a new time-dependent numerical model in order to determine the transient behavior of the treated tissue. The new model was also validated by comparison of measured and calculated time course of applied electric current.
Materials and Methods
In Vivo Procedure and Initial Treatment Planning
The treated patient was recruited in the scope of a phase I/II clinical study (EudraCT number 2008-008290-54; http://ClinicalTrials.gov [NCT01264952]), approved by the Institutional Medical Board and the Medical Ethics Committee of the Republic of Slovenia. The patient was a 55-year-old female, presenting with a single nonresectable metastasis in contact with the inferior vena cava, middle hepatic vein, and right hepatic vein. The patient was offered an explorative surgery and ECT at the end of December 2009 and received the ECT treatment after giving written informed consent.
Before the treatment, numerical treatment planning was performed using Comsol Multiphysics version 3.5a (Comsol AB, Stockholm, Sweden). To reconstruct the 3-D geometry of the patient, pretreatment MRI images were segmented into 3 different tissues: tumor, vessels, and liver. The segments were outlined using planar closed curves using Matlab (Mathworks, Natick, Massachusetts), and these were connected vertically into a 3-D geometry using a loft operation implemented in the Comsol Live Link for Matlab. The treatment planning was performed by solving the static Laplace equation for the electric potential.
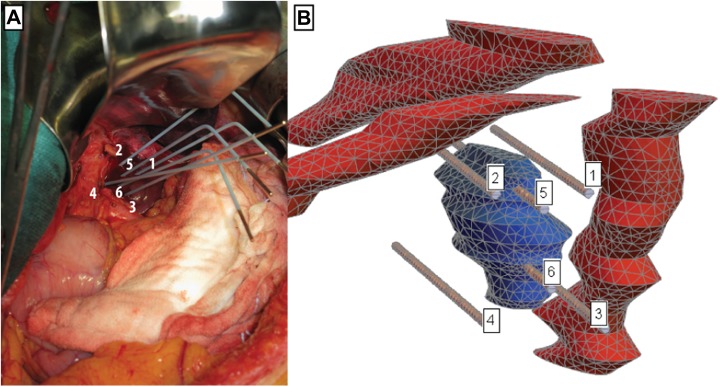
The ECT treatment was performed during open surgery. After the mobilization of the left liver, the area between the inferior vena cava and the origin of the hepatic veins was exposed. Six electrodes were inserted according to the treatment plan as shown in Figure 1. The numerical treatment planning indicated that this electrode geometry results in the most robust treatment outcome. The treatment was performed using Cliniporator Vitae (IGEA s.p.a, Carpi, Italy), with synchronization with the heartbeat (synchronizing the pulse delivery with the absolute refractory period of the heart, ie, after the R wave) controlled by Accusync R wave detector. During the treatment, ECG was also logged using Biopac MP150 with 2 ECG100C modules (BIOPAC Systems Inc, Goleta, California) for analysis of the effects of ECT on the functioning of the heart.19,20 Since the metastasis was found resectable in follow-up imaging 3 months after the ECT treatment, another operation was performed and the metastasis was excised. Histologically, complete necrosis was found without viable tumor tissue. Eight years after the ECT, the patient is without local or distant recurrence.
Figure 1.
A, Electrode positions during the in vivo electrochemotherapy (ECT) treatment of the colorectal metastasis. Shown is the final position of the electrodes. B, View of computational mesh with tumor (blue), veins (red), and electrodes.
Numerical Model
Geometry
The computational mesh for simulation by finite element method (FEM) was created in Comsol Multiphysics software and exported to a text file. Figure 1B shows the computational mesh and positioning of labeled electrodes, relative to the tumor and veins. Liver tissue is hidden in this view, because it completely surrounds all other domains and would thus obscure the view. Electrodes 5 and 6 are the only ones piercing the tumor. Needle electrodes have a diameter of 1.2 mm and their nonisolated (active) length is 40 mm. The whole computational domain represented a cuboid-shaped volume inside the patient’s liver, with dimensions of 100 × 70 × 60 mm. Computational mesh was made of 57 464 second-order tetrahedral elements, which offer superior accuracy compared to first-order elements used in the previously published study using the same mode.17
Material model and its parameters
The present study uses a previously described and validated time-dependent model of electroporation.17 The magnitude and temporal flow of applied electric current during the process of electroporation is highly nonlinear. This is not only due to geometrical placement of electrodes but also due to the number of applied electric pulses, pulse duration, pauses between consecutive pulses, and shape of the applied pulses. Previous models were able to simulate geometric effects of electrode placement and changes in tissue conductivity based on steady state solutions of electric field in the simulated domain but were unable to simulate temporal simulation of pulse delivery scenarios. A series of geometrically defined and precisely measured ex vivo measurements of electric current on bovine liver samples gave us a reference data set for development of a modified tissue conductivity model (Equation 1) based on 3 parameters: ρ por—level of poration increases as a function of the amplitude of electric field and decreases exponentially during the pulses, ϑσ—poration damage indicator models the growth of pores during the pulse application, and ϑT—thermal damage indicator models damage effects due to Ohmic tissue heating.21
| 1 |
The proposed tissue resistance model was constructed using inverse analysis by minimizing the difference between simulated and measured electric current between 2 electrodes. By using this formulation, it is possible to capture all time effects on longer timescales (>10 microseconds). The only observable effects on shorter timescales (<10 microseconds) were current spikes during abrupt changes in applied voltage (pulse rise and fall times). The shape of electric pulse spikes was modeled with equivalent parallel resitance and capaciatance (RC) circuit that represents capacitance of the tissue. The capacitive current was incorporated into the set of model-defining equations and used to model the nonequilibrium constitutive equation 2. For each time step, electric field was determined by solving equation 2 using Newton iteration. The model was implemented in Wolfram Mathematica (version 11.2; Wolfram Research, Champaign, Illinois) using the AceGen and AceFEM packages21 (version 6.819).
| 2 |
Table 1 lists the values for parameters of the linear conductivity model for different tissues, summarized from the literature. Values of other parameters of the tissue material model have been taken according to simulations of bovine liver by Langus et al.17
Table 1.
Parameters of the Linear Conductivity Model for Different Tissues.
| Tissue | Symbol | Description | Value | Reference |
|---|---|---|---|---|
| Liver | σMin | Initial tissue conductivity | 0.091 S/m | 19 |
| σMax | Final tissue conductivity | 0.45 S/m | 13 | |
| E Min | Min electric field magnitude limit in linear conductivity model | 3 × 10⁴ V/m | 23 | |
| E Max | Max electric field magnitude limit in linear conductivity model | 7 × 10⁴ V/m | 22 | |
| Tumor | σMin | Initial tissue conductivity | 0.4 S/m | 21 |
| σMax | Final tissue conductivity | 1.6 S/m | 23 | |
| E Min | Min electric field magnitude limit in linear conductivity model | 4 × 10⁴ V/m | 24 | |
| E Max | Max electric field magnitude limit in linear conductivity model | 8 × 10⁴ V/m | 24 | |
| Veins | σMin | Initial tissue conductivity | 0.7 S/m | 25 |
| σMax | Final tissue conductivity | 1.05 S/m | 25 | |
| E Min | Min electric field magnitude limit in linear conductivity model | 4 × 10⁴ V/m | 25 | |
| E Max | Max electric field magnitude limit in linear conductivity model | 1.1*105 V/m | 25 | |
| Electrode | σ | Conductivity | 106 S/m | 19 |
Boundary conditions
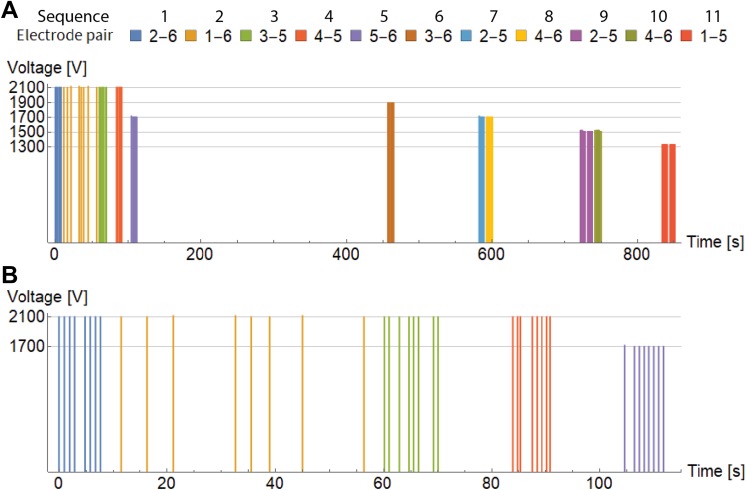
Electrical pulses were delivered by an electric pulse generator Cliniporator Vitae (IGEA s.r.l., Carpi, Italy) between different pairs of electrodes in 11 sequences with 103 pulses in total as shown in Table 2. Duration of each pulse was 100 microseconds, but they have been distributed unequally during the total duration of the treatment. Approximately 850 seconds elapsed between the first and the last pulse delivered to the patient. Delivery of pulses was synchronized with electrocardiogram, that is, 1 pulse per heartbeat was delivered. Initially, 8 pulses per electrode pair were planned, but during the operation, some sequences could not be performed at the proposed voltage because the current was too high for electroporation device. Therefore, those sequences were repeated with more pulses at lower voltage.18 Reconfiguring the lower voltages required some time, which led to a delay between pulse trains. Figure 2A shows the temporal distribution and measured voltage of all delivered pulses. Majority of sequences were delivered close together with frequency of around 1 Hz, while sequence 2 was delivered more sporadically, as can be seen on close-up of the first 5 sequences in Figure 2B. Additional details regarding pulse sequences are given in Table 3.
Table 2.
Sequences of Electric Pulses.a
| Sequence | Electrode Pair | No. of Pulses | Voltage [V] |
|---|---|---|---|
| 1 | 2-6 | 8 | 2104 |
| 2 | 1-6 | 8 | 2109 |
| 3 | 3-5 | 8 | 2104 |
| 4 | 4-5 | 8 | 2104 |
| 5 | 5-6 | 8 | 1704 |
| 6 | 3-6 | 8 | 1896 |
| 7 | 2-5 | 8 | 1704 |
| 8 | 4-6 | 8 | 1702 |
| 9 | 2-5 | 15 | 1512 |
| 10 | 4-6 | 8 | 1519 |
| 11 | 1-5 | 16 | 1329 |
a Last Column Presents an Average of Maximum Voltage Amplitudes for Each Electric Pulse Sequence.
Figure 2.
A, Temporal distribution of applied voltage pulses between different electrode pairs during the whole treatment. B, Close-up view of temporal distribution of the first 5 sequences.
Table 3.
Comparison of Simulated and Measured Electric Current for Each Pulse Sequence.
| Sequence | Electrode Pair | Average Measurements [A] | Average Simulation [A] | RMSE [A] | Difference of the First and Last Pulse [A] | Stationary Simulation [A] |
|---|---|---|---|---|---|---|
| 1 | 2-6 | 48.6 | 46.7 | 1.9 | 1.2 | 48.3 |
| 2 | 1-6 | 46.2 | 50.5 | 4.3 | −0.2 | 52.3 |
| 3 | 3-5 | 48.8 | 41.8 | 7 | 0.9 | 44.3 |
| 4 | 4-5 | 48.3 | 40 | 8.4 | 1.2 | 42.0 |
| 5 | 5-6 | 48.8 | 59.2 | 10.4 | 1.7 | 62.1 |
| 6 | 3-6 | 49.1 | 53.2 | 4.1 | 0.7 | 53.7 |
| 7 | 2-5 | 49.1 | 53 | 3.9 | 1.8 | 52.5 |
| 8 | 4-6 | 49.1 | 38.1 | 11.1 | 1.3 | 39.8 |
| 9 | 2-5 | 45.5 | 46 | 3.7 | 0.8 | 45.6 |
| 10 | 4-6 | 41.3 | 32.8 | 8.5 | 0.7 | 34.1 |
| 11 | 1-5 | 32.6 | 44 | 11.5 | 1.6 | 42.3 |
Abbreviation: A, Ampere; RMSE, root mean square of error.
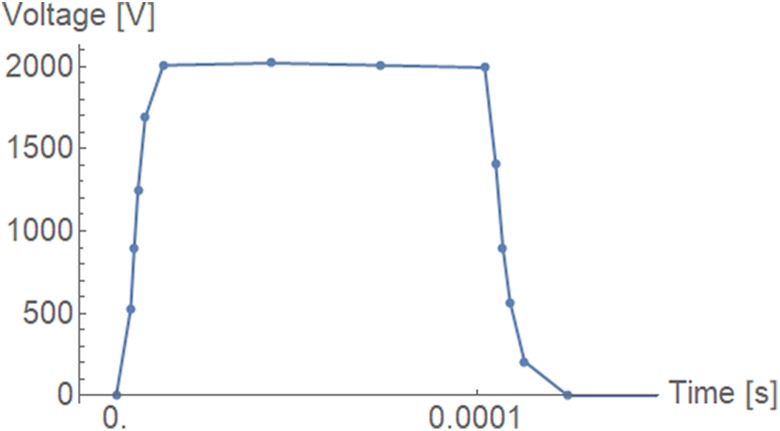
Figure 3 shows the detailed time course of voltage of the first electric pulse. It closely resembles a square pulse, and all other pulses were the same shape, except that their magnitude was different. This information was measured and recorded by the Cliniporator pulse generator with 1 MHz sampling frequency and then resampled down to reduce the number of data points, since their spacing in time was also used to control the simulation time step.
Figure 3.
Detailed view of 1 voltage pulse profile. The sample points were closer together during the rise and fall transients (∼2 µs) and further apart at the top of the pulse (∼30 µs).
Results
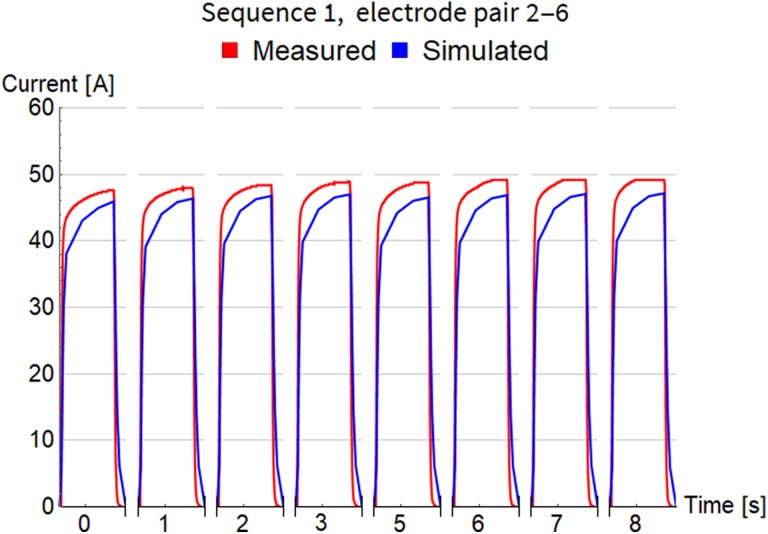
Simulation started at time 0, at the beginning of the rise transient of the first pulse, and lasted for all 103 pulses in the whole treatment, that is, 852 seconds altogether. Time step of simulations was continually adjusted to accurately describe the shape of each short pulse (on the scale of microseconds) and quickly pass the long gaps between pulses (on the scale of seconds). This fact is also challenging for visualization, because it is impossible to present electric current variations during 1 pulse and between consecutive pulses on the same timescale. The next 3 figures, Figures 4 to 6, show detailed evolution of current during each pulse for 3 sequences, while results for all 11 sequences can be found in Figure S1 of the supplementary data. The timescale on these figures is not regular and does not show the long pauses between pulses. Only approximate time at which the pulse was fired is indicated and their true temporal distribution is illustrated accurately in Figure 2.
Figure 4.
Comparison of measured and simulated electric current for pulse sequence 1. The timescale is not regular and does not show the long pauses between pulses. Only approximate time at which the pulse was fired is indicated.
Figure 5.
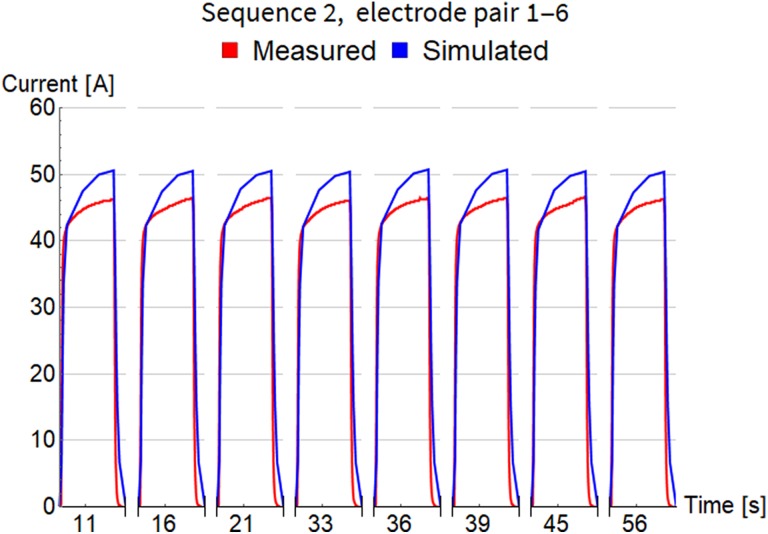
Comparison of measured and simulated electric current for pulse sequence 2. The timescale is not regular and does not show the long pauses between pulses. Only approximate time at which the pulse was fired is indicated.
Figure 6.
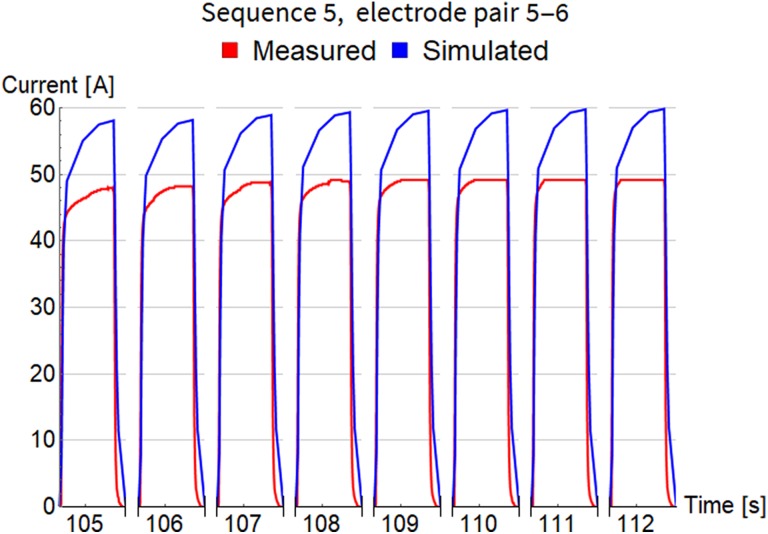
Comparison of measured and simulated electric current for pulse sequence 5. The timescale is not regular and does not show the long pauses between pulses. Only approximate time at which the pulse was fired is indicated.
In Figure 4, for pulse sequence 1, we can observe the gradually rising envelope of maximal current amplitude for consecutive pulses with short pauses (from 45.9 A for the first pulse to 47.2 A for the eighth pulse). A similar effect was also measured, albeit with somewhat higher amplitudes (from 47.6 A for the first pulse to 49.1 A for the eighth pulse), which clearly indicates that our numerical model describes rather realistically the electroporation effects occurring progressively in the exposed tissue. We can also observe detailed evolution of current during each pulse (on the scale of microseconds), indicating that the model can also successfully capture these transient effects.
Sequence 2 (in Figure 5) has much longer pauses between consecutive pulses (see Figure 2B), with the minimum around 3 seconds, which means there should be less interference between them. This is clearly visible, because all pulses have almost identical shape and magnitude both in measurements and in simulation.
Pulses in sequence 5 (Figure 6) were again delivered close together with shorter pauses. Rising envelope of maximal current is visible in the simulated results, but not in the measurements. A possible explanation for this is that the measurements were performed by the Cliniporator pulse generator, which has a measurement accuracy of 3% and a maximum current capacity of 50 A.26 Based on the current measurements of the other measurements, it is possible that the currents were slightly above 50 A but were recorded as 50 due to the limits of the measurement system.
Table 3 summarizes the comparison of electrical current (measured and simulated) with respect to maximal amplitude for each pulse within sequence. Column 5 shows root mean square of error between measurements and simulation. Column 6 shows the difference in simulated maximal amplitude of the first and the last pulse in each sequence, which confirms that our FEM model is able to capture current increase with consecutive pulses. The smallest difference is for sequence 2 where pulses have been fired with lowest frequency of all sequences (see Figure 2B). The last column holds the values of electrical current calculated by steady state method with Comsol Multiphysics software (version 5.3, Comsol AB, Stockholm, Sweden). They are very close to the results of the newly developed time-dependent model and support its correctness.
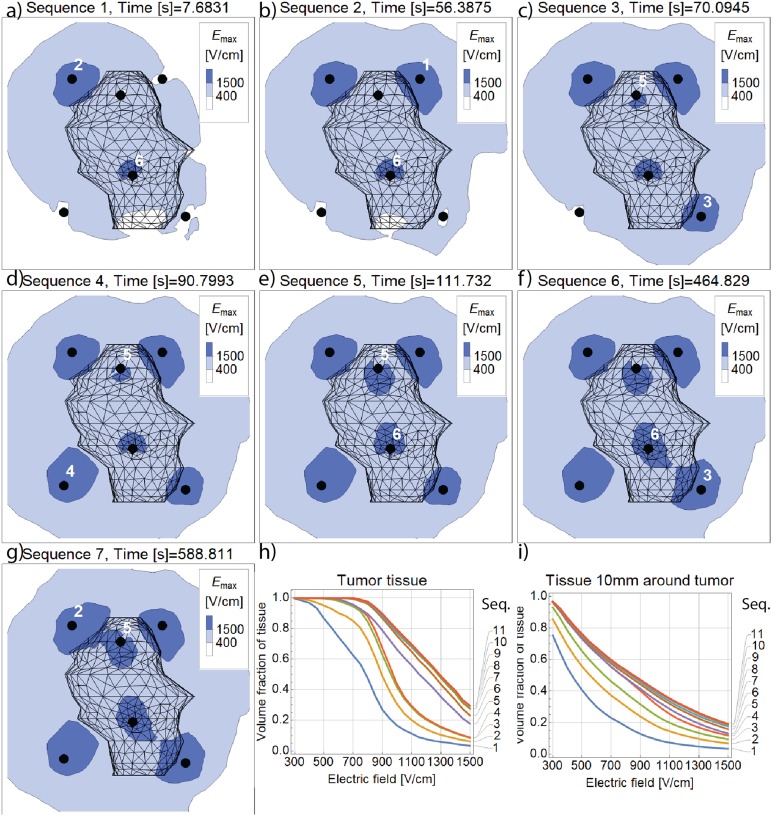
The FEM simulation enables observation of the distribution of electric field inside the computational domain, as shown in Figure 7A to G. Time at which these plots are made corresponds to the peak of the last pulse in each pulse sequence. Plots show characteristic contours of maximum computed electric field on the cross-section plane through the middle of the tumor, perpendicular to electrodes. We can observe how the area of cross section (and the volume of tissue) covered with electric field of certain magnitude rises with consecutive pulse sequences. Volume fraction of the tumor tissue covered with electric field is quantified on subplot F (Figure 7H). In the last 5 pulse sequences, maximal computed electric field almost doesn’t change, because (significantly) higher voltage has already been applied for the same pair of electrodes in some previous pulse sequence. This is also the reason why cross sections for the last 4 sequences are not shown in Figure 7; all plots after sequence 7 appear almost identical. Volume fraction covered with electrical field for tumor tissue and all other tissue (liver and veins) up to 10 mm away from tumor surface is shown in Figure 7I. Electric field coverage of this additional volume is also important because it ensures robust ECT treatment where all potentially malignant tissue is covered with sufficient electric field.
Figure 7.
A-G, Evolution of maximal values of electric field magnitude on the cross section through the middle of the tumor. H, The curves indicate the volume fraction of tumor tissue covered by electric field of at least the strength indicated on the horizontal axis. I, Electric field histogram for the safety margin tissue (10 mm from the tumor) after each successive pulse sequence.
Discussion
The in vivo ECT treatment simulation with 3 different tissue types served as a test case for the time-dependent FEM model’s capability to simulate a clinical case with nonhomogenous distribution of tissue properties. As seen in Figures 4 to 6, the agreement between simulated and measured electric current is quite good and the numerical model is able to capture transient effects of current evolution within 1 pulse and also between consecutive pulses. Table 3 summarizes the comparison of current for each pulse sequence and the error of maximal pulse amplitude does not exceed 23%, except for the last sequence, which we believe is an encouraging result for an in vivo case study. Tissue conductivity values and other model parameters were taken directly from previously published literature and have not been adjusted in order to achieve better agreement of simulated and measured current.13,14,17,25,27 Discrepancy of measurements and simulation can also be attributed to the fact that the Cliniporator device cannot record currents above 50 A. This artificial cutoff is seen in the last few pulses in Figure 4 and is even more pronounced in Figure 6. Despite the current reaching the 50 A mark, the internal overcurrent protection of the Cliniporator device was not triggered in these 2 instances.
Investigation of electric field coverage (Figure 7) revealed that even before all pulse sequences have been delivered, the whole tumor has been covered with electric field of 400 V/cm, which exceeds reversible electroporation threshold for tumor tissue (Table 1). Around 85% of the tumor volume has been covered by fields in excess of 900 V/cm, that is, above IRE threshold, as it was previously reported24; additionally 30% of its volume has been also covered by 1500 V/cm, which has recently been found as a threshold for IRE with eight 100 µs pulses using Magnetic Resonance Electrical Impedance Tomography.28 Initial treatment planning of ECT procedure18 predicted that all volume up to 10 mm around the tumor surface should be covered with electric field of 300 V/cm to grant successful electroporation of all potentially malignant tissue. At this electric field threshold, reversible electroporation is achieved in liver tissue (Table 1) and Figure 7I confirms that almost entire safety margin volume has been covered by electric field of at least 300 V/cm. Field of 400 V/cm has also covered around 0.75 cm3 of veins, which might explain the surgeon’s observation that texture of the veins appeared more firm at the subsequent operation when the metastasis was removed.18
Simulating in vivo ECT treatment poses several challenges regarding the description of geometry. As can be seen in Figure 1, electrodes were placed close together, that is, between 5 and 20 mm apart, and inserted in a soft liver tissue through a relatively small surgical opening, which necessitated the bending of 2 electrodes. In addition, moderate movement of electrodes due to muscular contractions of the patient was present during the application of electric pulses. Small geometric features (electrode diameter of 1.2 mm) and irregular shapes (tumor, veins) in combination with high electric field gradients in the vicinity of the electrodes dictate the use of fine FEM discretization in particular areas and thus relatively large number of mesh elements. Temporal specifics of ECT treatment, with short pulses and long pauses between them, requires adaptive time-stepping scheme able to capture transient effects during the pulse and efficiently step over long pauses between the pulses. By optimizing the mesh density and the number of time steps, we were able to conduct in vivo ECT treatment simulation with 6 electrodes and 103 pulses in less than 10 hours on a single PC (16 cores, 64 GB RAM). Using the less accurate first-order elements, simulation time further drops to approximately 1 hour and this already opens possibilities for automated optimization of electrode placement for arbitrary tumor shapes.
Recent advances in theoretical understanding of time-dependent tissue modeling have led to the development of an alternative numerical model by Voyer et al, in which they achieved excellent agreement between measured and simulated current of a single electroporation pulse.29 Our and their models share the same idea of splitting the electric current into 2 parallel contributions (conductive and capacitive), while modeling of the electroporation phenomenon is different. The theoretical soundness of the model by Voyer et al is very promising and we are looking forward to see the model validated on a train of pulses.
The numerical model presented in this article is not limited only to ECT, as it could also be applied for numerical analysis of IRE. Still, the probability of cell death due to electroporation and thermal effects due to Joule heating should be implemented in current version of the model in order to be able to fully analyze the effect of IRE.15 Further improvements in simulation accuracy could include data from navigation devices or radiological imaging to extract precise electrode trajectories during the treatment.13,30 Inverse analysis of simple cases for different tissue types, similar to that performed during initial development of the model,17 could give us more accurate material model parameters (conductivity, etc). However, some variation between individuals is to be expected and can also be a function of the state of the tissue.31 Flexible implementation of time-dependent electroporation FEM model also allows including other phenomena in the future, such as tissue anisotropy and coupling with heat transfer. The latter would be especially important for separating the effects of electroporation from those temperature coefficients of tissue on the increase in electric current in IRE treatments.13
Conclusion
The presented work details the application of time-dependent modeling of electroporation on a case of in vivo ECT treatment of colorectal metastasis in the liver. The model shows a very good agreement between the measured and computed current, which will allow more accurate prediction of the currents delivered during electroporation treatments, which is especially relevant for treating larger tumors and tumors in more difficult locations.
Supplemental Material
supplementary_data_v1 for Time-Dependent Finite Element Analysis of In Vivo Electrochemotherapy Treatment by Matevž Pintar, Janez Langus, Ibrahim Edhemović, Erik Brecelj, Matej Kranjc, Gregor Sersa, Tomaž Šuštar, Tomaž Rodič, Damijan Miklavčič, Tadej Kotnik, and Bor Kos in Technology in Cancer Research & Treatment
Acknowledgments
The authors acknowledge the financial support from the Slovenian Research Agency (ARRS research core funding No. P2-0249, and project “Development and validation of treatment planning methods for treating cancer with electroporation based therapies” Z3-7126). The authors acknowledge the work of Dr Barbara Mali, who performed the capture and analysis of ECG. The research was conducted in the scope of LEA EBAM (French-Slovenian European Associated Laboratory: Pulsed Electric Fields Applications in Biology and Medicine).
Abbreviations and Acronyms
- ECT
electrochemotherapy
- FEM
finite element method
- IRE
irreversible electroporation
- MRI
magnetic resonance imaging.
Footnotes
Declaration of Conflicting Interests: The author(s) declared the following potential conflicts of interest with respect to the research, authorship, and/or publication of this article: Damijan Miklavčič holds patents on electrochemotherapy that have been licensed to IGEA S.p.a (Carpi, Italy) and is also consultant to various companies with interest in electroporation-based technologies and treatments.
Funding: The author(s) disclosed receipt of the following financial support for the research, authorship, and/or publication of this article: Financially supported by the Slovenian Research Agency (ARRS research core funding No. P2-0249, and project “Development and validation of treatment planning methods for treating cancer with electroporation based therapies” Z3-7126).
ORCID iD: Bor Kos, PhD  http://orcid.org/0000-0001-6219-7046
Supplemental Material: Supplemental material for this article is available online.
References
- 1. Neumann E, Rosenheck K. Permeability changes induced by electric impulses in vesicular membranes. J Membr Biol. 1972;10(3):279–290. [DOI] [PubMed] [Google Scholar]
- 2. Kotnik T, Kramar P, Pucihar G, Miklavcic D, Tarek M. Cell membrane electroporation-part 1: the phenomenon. IEEE Electr Insul Mag. 2012;28(5):14–23. [Google Scholar]
- 3. Yarmush ML, Golberg A, Serša G, Kotnik T, Miklavčič D. Electroporation-based technologies for medicine: principles, applications, and challenges. Annu Rev Biomed Eng. 2014;16(1):295–320. doi:10.1146/annurev-bioeng-071813-104622. [DOI] [PubMed] [Google Scholar]
- 4. Mir LM, Orlowski S, Belehradek J, Paoletti C. Electrochemotherapy potentiation of antitumor effect of bleomycin by local electric pulses. Eur J Cancer. 1991;27(1):68–72. [DOI] [PubMed] [Google Scholar]
- 5. Marty M, Sersa G, Garbay J, et al. Electrochemotherapy—an easy, highly effective and safe treatment of cutaneous and subcutaneous metastases: results of ESOPE (European Standard Operating Procedures of Electrochemotherapy) study. Eur J Cancer Suppl. 2006;4(11):3–13. doi:10.1016/j.ejcsup.2006.08.002. [Google Scholar]
- 6. Sersa G, Miklavcic D, Cemazar M, Rudolf Z, Pucihar G, Snoj M. Electrochemotherapy in treatment of tumours. Eur J Surg Oncol. 2008;34(2):232–240. doi:10.1016/j.ejso.2007.05.016. [DOI] [PubMed] [Google Scholar]
- 7. Mali B, Jarm T, Snoj M, Sersa G, Miklavcic D. Antitumor effectiveness of electrochemotherapy: a systematic review and meta-analysis. Eur J Surg Oncol. 2013;39(1):4–16. doi:10.1016/j.ejso.2012.08.016. [DOI] [PubMed] [Google Scholar]
- 8. Gehl J. Electroporation: theory and methods, perspectives for drug delivery, gene therapy and research. Acta Physiol Scand. 2003;177(4):437–447. [DOI] [PubMed] [Google Scholar]
- 9. Miklavcic D, Beravs K, Semrov D, Cemazar M, Demsar F, Sersa G. The importance of electric field distribution for effective in vivo electroporation of tissues. Biophys J. 1998;74(5):2152–2158. [DOI] [PMC free article] [PubMed] [Google Scholar]
- 10. Sel D, Lebar A, Miklavcic D. Feasibility of employing model-based optimization of pulse amplitude and electrode distance for effective tumor electropermeabilization. IEEE Trans Biomed Eng. 2007;54(5):773–781. doi:10.1109/TBME.2006.889196. [DOI] [PubMed] [Google Scholar]
- 11. Zupanic A, Kos B, Miklavcic D. Treatment planning of electroporation-based medical interventions: electrochemotherapy, gene electrotransfer and irreversible electroporation. Phys Med Biol. 2012;57(17):5425–5440. doi:10.1088/0031-9155/57/17/5425. [DOI] [PubMed] [Google Scholar]
- 12. Kos B, Zupanic A, Kotnik T, Snoj M, Sersa G, Miklavcic D. Robustness of treatment planning for electrochemotherapy of deep-seated tumors. J Membr Biol. 2010;236(1):147–153. doi:10.1007/s00232-010-9274-1. [DOI] [PubMed] [Google Scholar]
- 13. Kos B, Voigt P, Miklavcic D, Moche M. Careful treatment planning enables safe ablation of liver tumors adjacent to major blood vessels by percutaneous irreversible electroporation (IRE). Radiol Oncol. 2015;49(3):234–241. doi:10.1515/raon-2015-0031. [DOI] [PMC free article] [PubMed] [Google Scholar]
- 14. Sel D, Cukjati D, Batiuskaite D, Slivnik T, Mir LM, Miklavcic D. Sequential finite element model of tissue electropermeabilization. IEEE Trans Biomed Eng. 2005;52(5):816–827. doi:10.1109/TBME.2005.845212. [DOI] [PubMed] [Google Scholar]
- 15. Garcia PA, Davalos RV, Miklavcic D. A numerical investigation of the electric and thermal cell kill distributions in electroporation-based therapies in tissue. PLoS One. 2014;9(8):e103083 doi:10.1371/journal.pone.0103083. [DOI] [PMC free article] [PubMed] [Google Scholar]
- 16. Garcia PA, Kos B, Rossmeisl JH, Pavliha D, Miklavčič D, Davalos RV. Predictive therapeutic planning for irreversible electroporation treatment of spontaneous malignant glioma. Med Phys. 2017;44(9):4968–4980. doi:10.1002/mp.12401. [DOI] [PubMed] [Google Scholar]
- 17. Langus J, Kranjc M, Kos B, Šuštar T, Miklavčič D. Dynamic finite-element model for efficient modelling of electric currents in electroporated tissue. Sci Rep. 2016;6:26409 doi:10.1038/srep26409. [DOI] [PMC free article] [PubMed] [Google Scholar]
- 18. Edhemovic I, Gadzijev EM, Brecelj E, et al. Electrochemotherapy: a new technological approach in treatment of metastases in the liver. Technol Cancer Res Treat. 2011;10(5):475–485. [DOI] [PMC free article] [PubMed] [Google Scholar]
- 19. Edhemovic I, Brecelj E, Gasljevic G, et al. Intraoperative electrochemotherapy of colorectal liver metastases. J Surg Oncol. 2014;110(3):320–327. doi:10.1002/jso.23625. [DOI] [PubMed] [Google Scholar]
- 20. Mali B, Gorjup V, Edhemovic I, et al. Electrochemotherapy of colorectal liver metastases—an observational study of its effects on the electrocardiogram. Biomed Eng Online. 2015;14(suppl 3):S5 doi:10.1186/1475-925X-14-S3-S5. [DOI] [PMC free article] [PubMed] [Google Scholar]
- 21. Korelc J, Wriggers P. Automation of Finite Element Methods. Cham, Switzerland: Springer International Publishing; 2016. doi:10.1007/978-3-319-39005-5. [Google Scholar]
- 22. Corovic S, Lackovic I, Sustaric P, Sustar T, Rodic T, Miklavcic D. Modeling of electric field distribution in tissues during electroporation. Biomed Eng Online. 2013;12(1):16 doi:10.1186/1475-925X-12-16. [DOI] [PMC free article] [PubMed] [Google Scholar]
- 23. Cukjati D, Batiuskaite D, Andre F, Miklavcic D, Mir L. Real time electroporation control for accurate and safe in vivo non-viral gene therapy. Bioelectrochemistry. 2007;70(2):501–507. doi:10.1016/j.bioelechem.2006.11.001. [DOI] [PubMed] [Google Scholar]
- 24. Pavselj N, Bregar Z, Cukjati D, Batiuskaite D, Mir LM, Miklavcic D. The course of tissue permeabilization studied on a mathematical model of a subcutaneous tumor in small animals. IEEE Trans Biomed Eng. 2005;52(8):1373–1381. doi:10.1109/TBME.2005.851524. [DOI] [PubMed] [Google Scholar]
- 25. Marčan M, Kos B, Miklavčič D. Effect of blood vessel segmentation on the outcome of electroporation-based treatments of liver tumors. PLoS One. 2015;10(5):e0125591 doi:10.1371/journal.pone.0125591. [DOI] [PMC free article] [PubMed] [Google Scholar]
- 26. Miklavcic D, Snoj M, Zupanic A, et al. Towards treatment planning and treatment of deep-seated solid tumors by electrochemotherapy. Biomed Eng Online. 2010;9:10 doi:10.1186/1475-925X-9-10. [DOI] [PMC free article] [PubMed] [Google Scholar]
- 27. Zupanic A, Corovic S, Miklavcic D. Optimization of electrode position and electric pulse amplitude in electrochemotherapy. Radiol Oncol. 2008;42(2):93–101. doi:10.2478/v10019-008-0005-5. [Google Scholar]
- 28. Kranjc M, Kranjc S, Bajd F, Serša G, Serša I, Miklavčič D. Predicting irreversible electroporation-induced tissue damage by means of magnetic resonance electrical impedance tomography. Sci Rep. 2017;7(1):10323 doi:10.1038/s41598-017-10846-5. [DOI] [PMC free article] [PubMed] [Google Scholar]
- 29. Voyer D, Silve A, Mir LM, Scorretti R, Poignard C. Dynamical modeling of tissue electroporation. Bioelectrochemistry. 2018;119:98–110. doi:10.1016/j.bioelechem.2017.08.007. [DOI] [PubMed] [Google Scholar]
- 30. Groselj A, Kos B, Cemazar M, et al. Coupling treatment planning with navigation system: a new technological approach in treatment of head and neck tumors by electrochemotherapy. Biomed Eng Online. 2015;14(suppl 3):S2 doi:10.1186/1475-925X-14-S3-S2. [DOI] [PMC free article] [PubMed] [Google Scholar]
- 31. Peyman A, Kos B, Djokić M, et al. Variation in dielectric properties due to pathological changes in human liver. Bioelectromagnetics. 2015;36(8):603–612. doi:10.1002/bem.21939. [DOI] [PubMed] [Google Scholar]
Associated Data
This section collects any data citations, data availability statements, or supplementary materials included in this article.
Supplementary Materials
supplementary_data_v1 for Time-Dependent Finite Element Analysis of In Vivo Electrochemotherapy Treatment by Matevž Pintar, Janez Langus, Ibrahim Edhemović, Erik Brecelj, Matej Kranjc, Gregor Sersa, Tomaž Šuštar, Tomaž Rodič, Damijan Miklavčič, Tadej Kotnik, and Bor Kos in Technology in Cancer Research & Treatment


