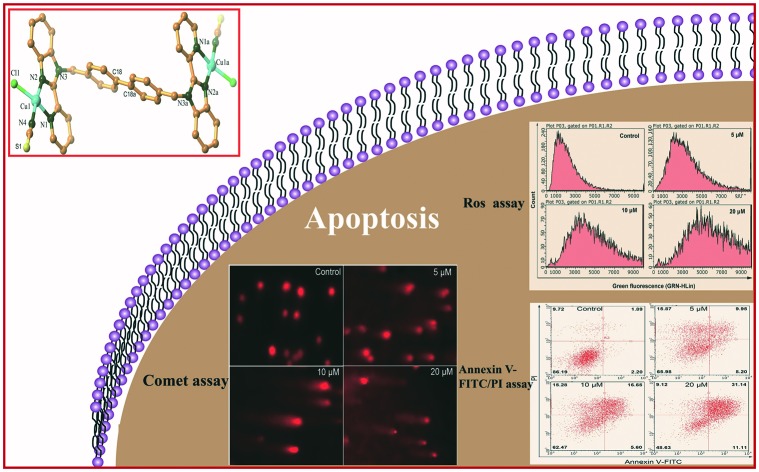
 Complex 1 with in vitro cytotoxicity strongly binds to DNA, activates ROS generation, causes mitochondria dysfunction, and induces cellular apoptosis.
Abstract
Copper is an essential element and has redox potential, thus copper complexes have been developed rapidly with the hope of curing cancer. To further develop anticancer agents and investigate their anticancer mechanisms, two Cu complexes, [Cu(bpbb)0.5·Cl·SCN]·(CH3OH) (1) and [Cu2(bpbb)·Br3·(OH)]n (2), were synthesized and characterized using 4,4′-bis((2-(pyridin-2-yl)-1H-benzo[d]imidazol-1-yl)methyl)biphenyl (bpbb), with associated Cu(ii) salts. Complex 1 is a binuclear structure, whereas 2 is a one-dimensional complex. Compared with 2, complex 1 exhibited potent in vitro cytotoxicity toward four cell lines (HCT116, BGC823, HT29, and SMMC7721), and was most effective against HCT116 cells. Therefore, further in-depth investigation was carried out using complex 1. Absorption spectral titration experiments, ethidium bromide displacement assays, and circular dichroism spectroscopic studies suggested that complex 1 binds strongly to DNA by intercalation. Complex 1 exhibited a clear concentration-dependent pBR322 DNA cleavage activity. Inductively coupled plasma mass spectrometry testing implied that complex 1 could enter cells and that DNA was one important target. Cellular level assays suggested that complex 1 activates the generation of intracellular reactive oxygen species, causing DNA damage, promoting cell cycle arrest and mitochondria dysfunction, and inducing cellular apoptosis.
1. Introduction
The landmark drug cisplatin has been used to treat many patients with a variety of cancers, alone or in combination with other anticancer agents, which places metal-based agents in the frontline in the struggle against cancer.1 Although highly effective in the clinical treatment of various types of neoplasms, a complete cure using cisplatin is still limited by acquired resistance and severe side effects. These problems have stimulated the development of alternative strategies, employing different metals, with improved pharmacological performance, which are aimed at distinct targets.2–4 New metal complexes might be effective if they have the capability to form reactive oxygen species (ROS), interact with DNA, cause mitochondria toxicity or inhibit enzymes, which offers the prospect of obtaining compounds with alternative mechanisms of action.5 Casini et al. reported a heterodinuclear Rh/Au complex exhibiting promising antiproliferative activity, which could be the result of its different overall chemical–physical properties.6 Sadler et al. reported several Ir-complexes, which showed high antiproliferative activity toward A2780, A549, and MCF-7 human cancer cells.7 Huang et al. reported a novel Au(i) complex with strong anticancer activity and low toxicity.8 Chen et al. reported anticancer and antiangiogenic Fe(ii) complexes that target thioredoxin reductase to induce cancer cell apoptosis.9 In this field, Cu complexes also demonstrated encouraging potential.10,11 Copper is an endogenous metal for humans and its complexes have been proven to be excellent for biological applications because of their biological redox activities and relatively strong affinity for nucleobases.
Cu(ii) complexes, as anticancer agents, generate a high amount of ROS, which causes oxidative damage to mitochondria and biomacromolecules. In addition, through interaction with DNA, an effect that is related to ligand planarity, Cu(ii) complexes usually possess unusual electronic behaviors and various chemical reactivities.12,13 Many Cu(ii) complexes have been reported to have moderate to good binding affinity with DNA, most frequently via intercalation and groove binding.14–16 Studies demonstrated that ligand coordination to the metal center of the complexes is required for the observed cytotoxic activity. In this situation, the larger planarity exhibited by the ligands favors an enhanced binding affinity.17 The chemical features of the coordinated ligands are closely associated with the activity of the complex, which can diversify the formed complex structures, modulate the permeability of the complex through cell membranes, and influence the redox-couple of Cu(ii) centers.18 Currently, research is increasingly focused on the design and synthesis of tailored organic ligands which lead to structure-specific constructions. The structures and bioactivities of Cu(ii) complexes with their ligands, including aromatic and largely planar pyridine-benzimidazole moieties, could provide useful insights into the chemistry and biochemistry of bioactive molecules. Thus, in the present study, we report two Cu complexes, together with their DNA binding effects, activation of ROS generation, and in vitro anticancer activities.
2. Results and discussion
2.1. Description of the crystal structures of complexes 1 and 2
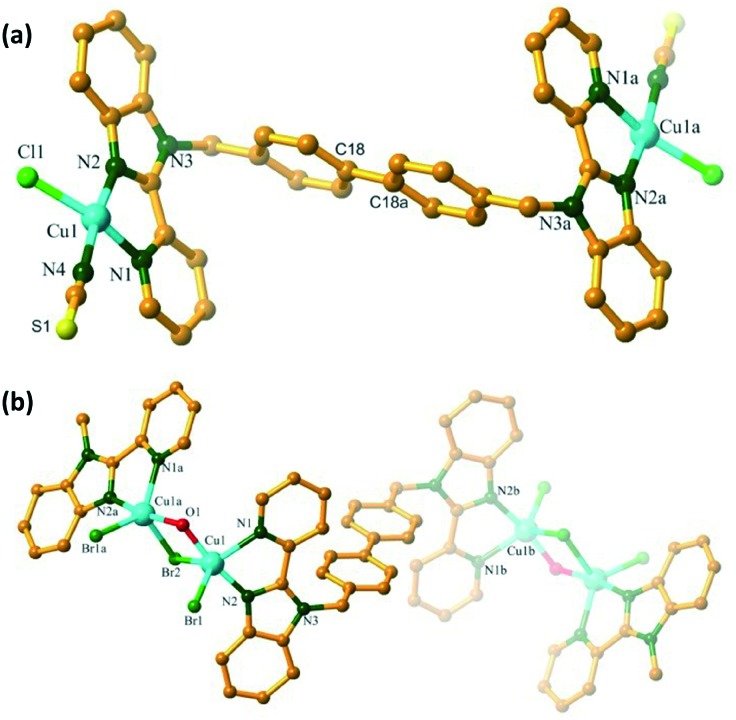
As shown in Fig. 1, complex 1 is a binuclear compound, crystallized in a triclinic cell with the P11̄ space group. The asymmetric unit consists of one Cu( space group. The asymmetric unit consists of one Cu(ii) center, half of a bpbb ligand, one chloride, and one SCN anion, accompanied by a methanol molecule, in which the chloride may be derived from the decomposition of chloroform during the heating process. The Cu(ii) center shows a square-planar coordination geometry with the N3Cl donor unit derived from one SCN anion, two pyridyl-benzimidazole N, and one chloride. The bond distance falls in the range of several reported Cu(ii) complexes. Ligand bpbb acts as a tetradentate linker connecting two Cu(ii) centers, and the Cu···Cu separation via the trans bpbb is 15.208 Å. For complex 1, the inversion center is located in the middle of the C18–C18a bond.
Fig. 1. The Cu coordination environment of 1 (a) and 2 (b) with a partial atom numbering scheme.
Replacement of CuSCN with CuBr2 gave rise to the structurally different complex 2. Complex 2 crystallizes in the monoclinic space group P21/m, and the asymmetric unit consists of one Cu center, half a bpbb ligand, two bromide anions, and one hydroxyl moiety. Complex 2 possesses a one-dimensional (1D) S-shaped chain structure. Each Cu(ii) center shows a pentacoordinated geometry with an N2Br2O donor unit derived from two pyridyl-benzimidazole N, one hydroxyl O, and two bromide anions. The two Cu(ii) centers are bridged by one O atom and one bromide, with a Cu···Cu separation of 3.1794 Å, giving rise to a dimer. These dimer moieties are bridged by bpbb, producing a 1D chain skeleton (Fig. S1†). The bridging bromide anion with Cu···Br gave a separation of 2.593 Å, indicating the presence of a weak binding interaction.19 Complex 2 is air-stable and can retain its crystalline integrity at ambient temperature. The disordered, uncoordinated solvent could not be modeled; therefore, the Platon SQUEEZE command was employed to remove the residual electron density. For complex 2, a weight loss occurred between 45 and 210 °C, and the total weight loss within this temperature range was 6.77%, which was attributed to the coordinated solvent molecules (Fig. S2†).
The stability of a complex in solution is important for biological studies. The ESI-MS spectra of complex 1 in solution show a peak at m/z 823.92, which was assigned to the formation of [Cu2(bpbb)·Cl2·SCN]+, whereas the peak at m/z 846.52 was assigned to the formation of [Cu2(bpbb)·Cl·(SCN)2]+. For complex 2, the peak at m/z 789.6 was assigned to the formation of {[Cu2(bpbb)·Br·(OH)]–H}+, which suggested that complexes 1 and 2 retained their structures in solution.
2.2. In vitro cytotoxicity
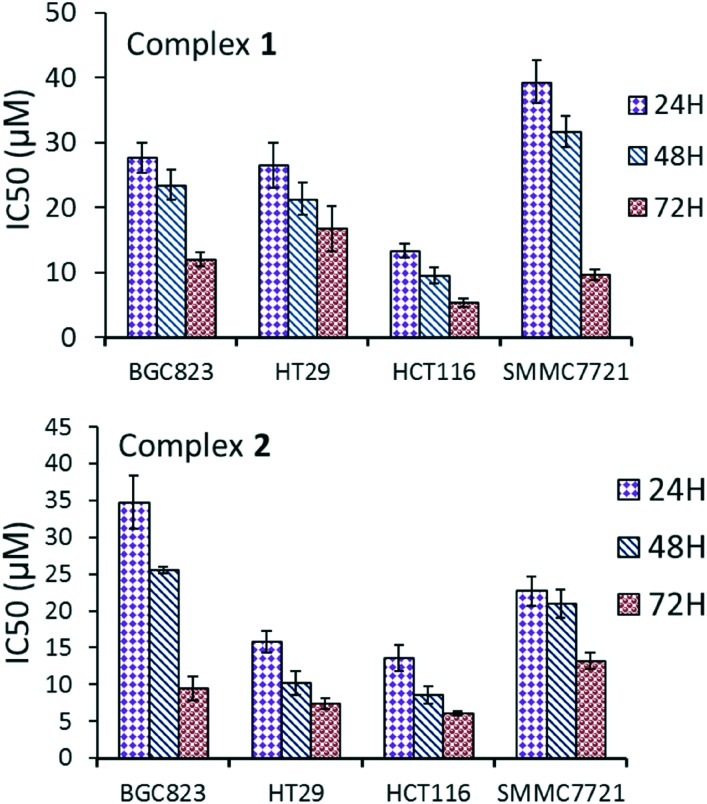
The cytotoxicity of the bpbb ligand and the Cu complexes against HCT116 (colon cancer cell line), BGC823 (gastric cancer cell line), HT29 (colon cancer cell line), SMMC7721 (liver cancer cell line) and LO2 cells (normal liver cell line) was evaluated using the 3-(4,5-dimethylthiazol-2-yl)-2,5-diphenyltetrazolium bromide (MTT) assay. By comparison, the IC50 values of bpbb and cisplatin for 48 h were also investigated under the same experimental conditions. Ultimately, the HCT116 cell line was observed to be the most sensitive to the treatment. The IC50 of ligand bpbb was 34 μM after 48 h against the HCT116 cell line, which indicated a remarkably low cytotoxicity compared with those of the Cu(ii) complexes. Complexes 1 and 2 exhibited excellent antiproliferative activity against the HCT116 cell line over 24 h, with a significantly enhanced activity with increasing incubation time, especially toward HCT116 cells (Fig. 2). The IC50 values were 13, 10, and 5 μM for 1; and 14, 9, and 6 μM for 2 after 24, 48, and 72 h of incubation for HCT116 cells, which were not only superior to cisplatin (23 ± 1 μM, for 48 h), but were also enhanced as compared with that of the corresponding ligand alone (Table S3†). This result confirmed these complexes as promising candidates for new antitumor agents. Complexes 1 and 2 were also cytotoxic to normal liver LO2 cells (Table S4†).
Fig. 2. IC50 values (μM) of complexes 1 and 2 against different cell lines.
2.3. Cellular uptake study
For a complex, entering the cell is a prerequisite for cytotoxicity.20 To investigate if the copper complexes could enter cells, the uptake of elemental copper was determined in HCT116 cells using ICP-MS. In the treated HCT116 cells, the accumulation of metal copper in the nuclei and mitochondria was 44.21 and 5.15 μg per g protein, respectively, which was higher than that of the control (18.48 and 3.04 μg per g protein). Considering that the Cu(ii) contents in the nuclei and mitochondria of untreated cells are relatively low, this increase in uptake is notable (Fig. 3a). The results suggested that complex 1 could transport across the cell membrane well and further accumulate in the nuclei and mitochondria to exert its biological effects. To verify the supposition that DNA may be an important target of the complex, the copper contents of complex 1 in an isolated DNA sample were examined (Fig. 3b). After 12 h of exposure to complex 1 at 15 μM, the accumulation of elemental copper in the DNA sample was 14.72 μg per g protein, which was higher than that of the untreated control sample (3.42 μg per g protein). This suggested that complex 1 could enter cells to combine and interact with DNA.
Fig. 3. The Cu concentrations in the treated cells incubated with complex 1 (10 μM) and the untreated control (a); the DNA accumulation of copper element determined in HCT116 cells after 12 h of exposure to 15 μM complex 1 (b).
2.4. DNA interaction properties
In most cases, DNA binding is a crucial step for DNA cleavage and fragmentation. Consequently, DNA binding studies were carried out using absorption titration, fluorescence, and circular dichroism (CD) spectroscopy; nuclease activity and DNA fragmentation were assessed using DNA cleavage and comet assays.
2.4.1. Absorption titration
To determine the mechanism of action underlying the complexes' cytotoxicity, ultraviolet-visible (UV-vis) spectroscopy was employed to investigate the binding affinity between complex 1 and DNA. Binding of the complex to DNA was anticipated to perturb the ligand-centered transitions of the complex. As shown in Fig. S5,† upon the addition of increasing concentration of DNA to a solution of complex 1, a slight hypochromism with a small red shift from 316 to 320 nm was observed, which is a characteristic indication that the complex has a good binding affinity toward DNA.21 The large planarity and extended aromaticity of pyridine-benzimidazole and the biphenyl moieties are favorable for the stacking of the complex and DNA base pairs. Therefore, the result suggested that complex 1 binds strongly to DNA, leading to small perturbations to the organic ligand.
2.4.2. Ethidium bromide (EB) displacement studies
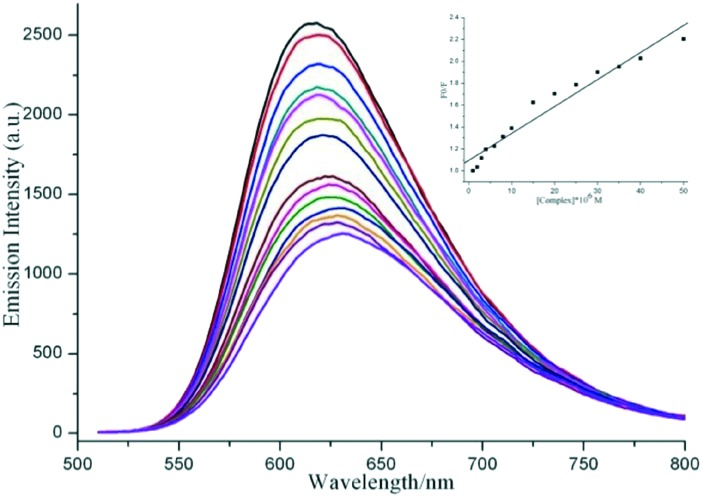
The DNA binding behavior of complex 1 was further studied by fluorescence spectral titration. The competitive binding of the tested complex to DNA could result in the replacement of EB, further revealing the DNA binding affinities of the complex. As shown in Fig. 4, as complex 1 was titrated, a dramatic hypochromism effect appeared at 612 nm, which was caused by the intercalation of the complex into DNA base pairs, replacing some of the DNA-bound EB from the system. Alternatively, the groove binding of the complex to DNA led to the reception of the excited state electron from EB to the metal-to-ligand charge transfer (MLCT) of the complex. The quenching data is in agreement with the classical linear Stern–Volmer equation, I0/I = 1 + Ksv[Q], where I0 and I are the fluorescence intensities in the absence and presence of a quencher, respectively, and [Q] is the quencher concentration. In the linear fit plot of I0/I versus [Q], Ksv represents the Stern–Volmer dynamic quenching constant. The apparent DNA binding constant (Kapp), which could convey the extent of the complex's affinity toward DNA, was calculated based on the equation, KEB[EB] = Kapp[Complex], herein KEB = 1.0 × 10⁻⁷ M–1, ([EB] = 10 μM). KEB represents the binding constant of EB to DNA, and [Complex] is the concentration of the complex at 50% reduction of the fluorescence intensity of EB. The approximate Ksv and Kapp values of 1 are calculated to be 2.47 × 10⁴ M–1 and 2.70 × 10⁶ M–1, respectively. The results indicate that the complex has strong affinity to DNA, which is comparable to other reported intercalating Cu complexes.22,23 The high values of Kapp in combination with the UV absorption spectra suggest that complex 1 binds to DNA via intercalation.
Fig. 4. The fluorescence quenching curves of EB (10 μM) bound to CT-DNA (60 μM) in the absence and presence of complex 1 (0–50 μM) in 5 mM Tris/50 mM NaCl buffer (pH 7.2). Inset: The plot of I0/I versus the complex concentration with λex = 490 nm.
2.4.3. CD spectroscopic studies
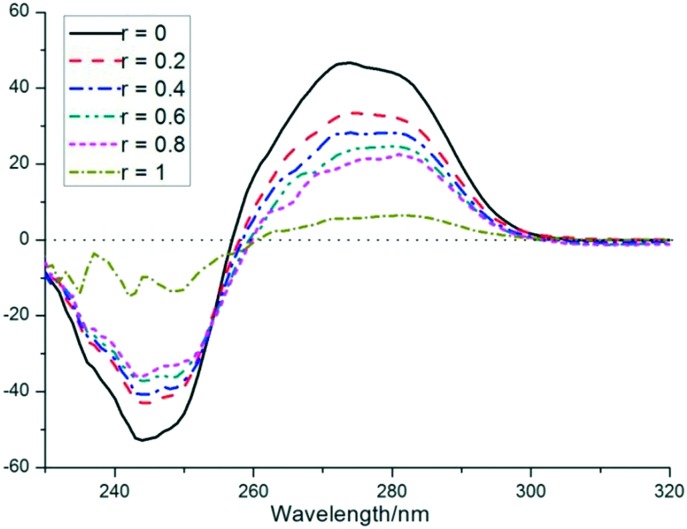
To investigate the morphological changes in DNA double strands as a result of the complex 1–DNA interaction, the CD spectra were determined in the same buffer. The bands at 275 nm caused by base stacking and at 245 nm because of the right-handed helicity of B-conformation DNA are quite sensitive to the modes of interaction of DNA with small complexes (Fig. 5). When the DNA was incubated with increasing complex concentration, changes in both the positive and negative signals of DNA were observed. The band at 245 nm showed a great decrease in intensity, suggesting the degradation of the B-band form. The band at 275 nm showed an obvious reduction in intensity, which indicated that the intercalation mode between 1 and DNA occurred.24 The large decrease in both positive and negative CD band intensities and the slight red-shift suggested that complex 1 perturbs the secondary structure of DNA effectively, and disturbs the right-handed helicity and base stacking of DNA, ultimately leading to the loss of stability. CD spectroscopic studies, in combination with absorption spectral titration and EB displacement assays, indicated that complex 1 binds strongly to DNA via intercalation.
Fig. 5. CD spectra of CT-DNA (solid line, [DNA] = 100 μM) and CT-DNA + 1 in Tris-HCl/NaCl buffer ([1]/[DNA] = 0, 0.2, 0.4, 0.6, 0.8, 1).
2.4.4. Nuclease activity
DNA cleavage is another useful method to evaluate DNA–complex interactions. To assess the ability of complex 1 to cause DNA cleavage, supercoiled (SC) plasmid pBR322 DNA (50 ng μL–1) was incubated with varying concentrations of complex 1 in buffer for 4 h with complex concentrations of 60–160 μM, in the presence of ascorbic acid. As shown in lane 3, complex 1 cannot cleave pBR322 DNA even at 160 μM in the absence of ascorbic acid (Vc). In the presence of Vc, complex 1 exhibited remarkable concentration-dependent DNA cleavage activity. As the complex concentration increased from 60 to 160 μM, the amount of supercoiled DNA (form I) decreased significantly, while that of the relaxed DNA (form II) increased to form the major fraction. When the complex concentration reached 60 μM (lane 4), linear DNA (form III) was clearly observed (Fig. 6). Complex 1 induced DNA cleavage was consistent with its hydrophobic interaction with the biopolymers. The presence of an aromatic moiety and the hard Lewis acid properties of the complex could play an important role in the DNA cleavage process.
Fig. 6. Agarose gel electrophoresis of pBR322 DNA treated with increasing concentration of complex 1. Lane 1, DNA control; lane 2, DNA + ascorbic acid (1 mM); lane 3, DNA + 1 (160 μM); lanes 4–9, DNA + 1 at 60, 80, 100, 120, 140 and 160 μM in the presence of ascorbic acid (1 mM).
2.4.5. Comet assay
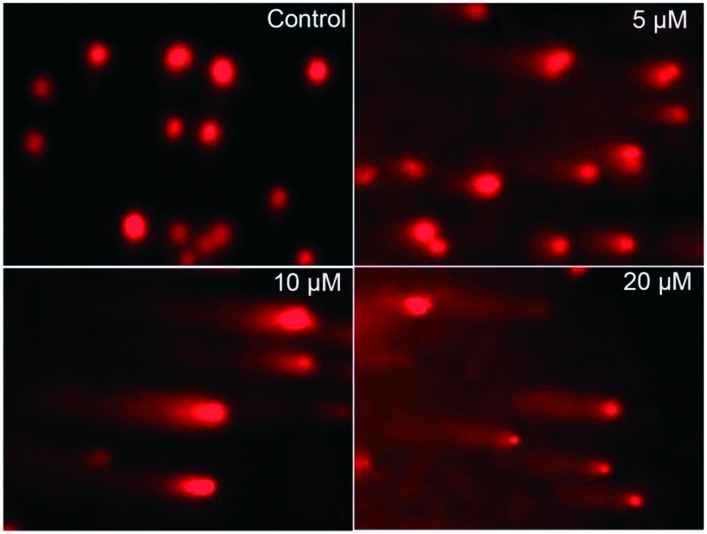
To assess whether complex 1 treatment causes DNA fragmentation in vitro, a comet assay, a simple-to-perform and sensitive method to assess DNA damage and repair, was carried out using cells treated with complex 1 (Fig. 7). Compared with the untreated control sample, complex 1 caused DNA damage in the treated HCT116 cells, as evidenced by the presence of the comet-like tails of the EB-stained DNA. As the complex concentration increased, a dose-dependent increase in electrophoretic migration of DNA fragments became apparent, which correlated with the DNA strand breaks in the cell. Untreated cells appeared as intact nuclei with no tails. This demonstrated that complex 1 induces massive DNA fragmentation and is likely to induce cell apoptosis. The result is in agreement with the high cellular uptake and strong DNA binding properties of complex 1. Taken together, the results suggested that complex 1 mediated growth inhibition involves DNA damage, which would block DNA transcription and cell division.
Fig. 7. Images of single cell gel electrophoresis for DNA damage (untreated cells and cells treated with varying concentrations of complex 1 for 12 hours).
2.5. Determination of the possible anticancer mechanism in vitro
2.5.1. Cell cycle arrest
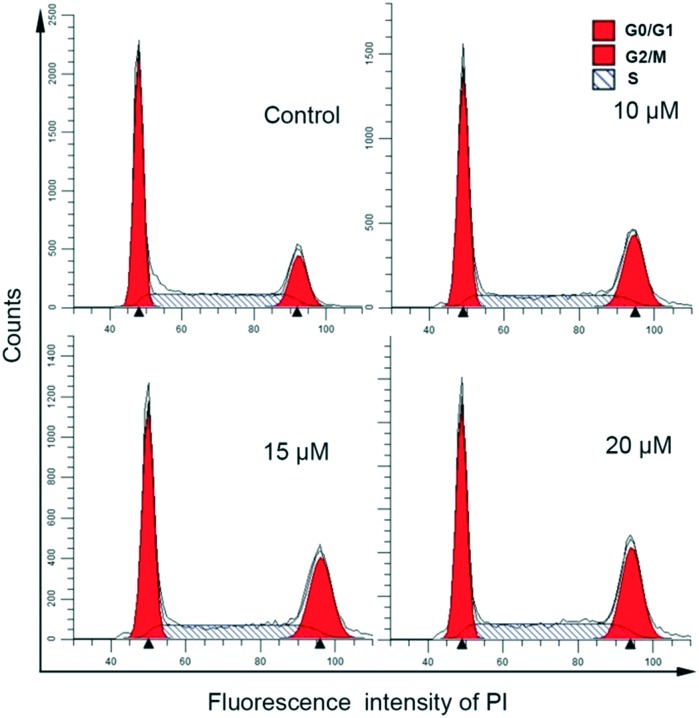
The effect of complex 1 on cell cycle perturbation and cell death was investigated by flow cytometry in propidium iodide (PI) stained HCT116 cells after treatment with complex 1 (0, 10, 15, and 20 μM) for 12 h. Flow cytometry for DNA content analysis (Fig. 8) showed that the percentages of treated HCT116 cells at different cell cycle phases changed under the influence of the indicated concentrations of 1 compared with the control cells. The population in the G2/M phase increased with a concomitant reduction in G0/G1 phase cells, suggesting that complex 1 could delay or perturb cell cycle progression through the G2/M phase in a dose-dependent manner. The maximum inhibitory rate of the G2/M phase was 29.46 for 1, while only 18.30% of the untreated control cells under the G2/M phase were detected, suggesting G2/M phase arrest. Accordingly, complex 1 treatment inhibits cellular DNA synthesis and arrests the cells in the G2/M phase of the cell cycle, which would inhibit the proliferation of cancer cells. Comparable results have also been reported, showing that the Cu complexes induce a block in the G2/M phase and a decrease in cell viability.
Fig. 8. Effects of complex 1 on the cell cycle progression of HCT116 cells after incubation with various concentrations of the complex (0, 10, 15, 20 μM) (top) for 12 h.
2.5.2. Mitochondrial transmembrane potential (Δψm)
A decline in Δψm is an important dysfunction in apoptotic processes, permitting the release of pro-apoptotic factors, such as cytochrome c, apoptosis-inducing factor, and decreases in ATP generation. To determine the involvement of the mitochondrial pathway in the induction of apoptosis, HCT116 cells were incubated with complex 1 for 12 h and stained with the indicative dye JC-1. Quantification of mitochondrial permeability was performed via flow cytometry. The scatter plots are shown in Fig. S6† representing samples treated with varying concentrations of complex 1. In the control (viable) cells, JC-1 localizes within the mitochondria, forming aggregates and resulting in red fluorescence emission corresponding to high mitochondrial membrane potential. By contrast, following incubation with increasing complex concentration, Δψm impairment induced by complex 1 was detected, indicating that the membrane was becoming more permeable. The mitochondrial potential collapsed in a concentration-dependent manner, which in turn would initiate the intrinsic apoptotic pathway. These results suggested that the intrinsic mitochondrial pathway is involved in apoptosis induced by complex 1.
2.5.3. Intracellular ROS trapping
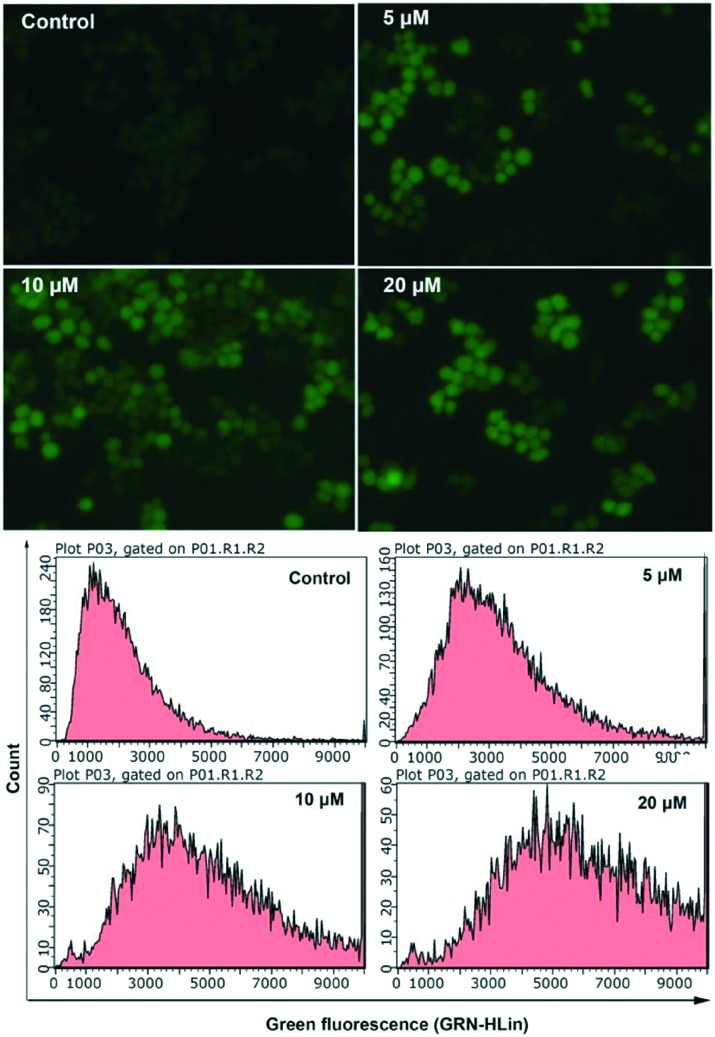
Mitochondrial dysfunction and increased ROS are related apoptotic events. Mitochondria are the main organelles that produce ROS, and previous studies demonstrated that overproduction of ROS promotes mitochondrial damage, which is responsible for the reduction of Δψm and the release of pro-apoptotic factors into the cytosol.25–27 Many studies have shown that Cu(ii) complexes can activate ROS generation in cancer cells, and the increased ROS can damage macromolecules, such as DNA and proteins, subsequently leading to cell death by apoptosis or necrosis.28 A 2′,7′-dichlorofluorescein diacetate (H2DCF-DA) probe was used to investigate whether complex 1 can produce intracellular ROS in HCT116 cells. Based on inverted fluorescence microscopy and flow cytometry measurements, the cells incubated with complex 1 showed a greater DCF fluorescence intensity and a right shifted peak appeared in a dose-dependent manner compared with those of the untreated cells (Fig. 9). This indicated that complex 1 activates the ROS-generating machinery and generates higher amounts of ROS. Therefore, it is highly possible that the reduction in Δψm induced by complex 1 was caused by ROS. Both ROS generation and Δψm reduction would promote cancer cell apoptosis.
Fig. 9. Evaluation of the formation of intracellular ROS using HCT116 cells, (top) and (bottom), the cells were incubated with complex 1 (0, 5, 10, 20 μM) for 12 h.
2.5.4. Apoptosis
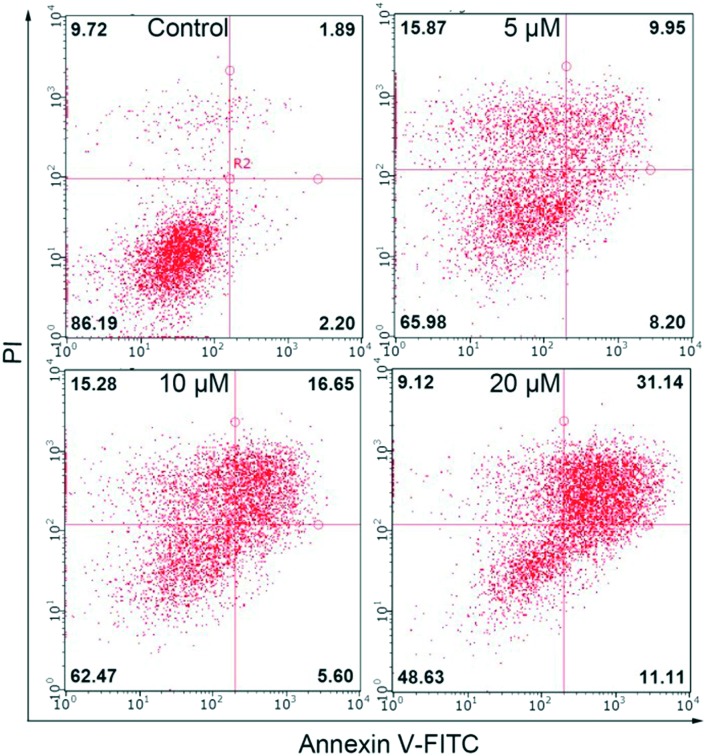
Apoptosis triggered by Cu(ii) complexes has attracted much attention on the premise that endogenous metals may be less toxic. Cell death mode analysis of HCT116 cells treated with Cu(ii) complex 1 at the indicated concentrations for 24 h was performed by using Annexin V-FITC and PI assays. Cells in the early stages of apoptosis would be stained with one of the two dyes, whereas cells would be stained with both dyes at the end-stage of apoptosis. After 24 h of treatment with the Cu(ii) complex, apoptosis and necrosis were observed (Fig. 10), which signified that complex 1 induces the loss of cell plasma membrane integrity. As the concentration of the complex increased, higher induction of the populations of Annexin V+/PI– and Annexin V+/PI+ cells appeared. These results indicated that the apoptosis-inducing capability of complex 1 seems to be a primary factor in determining its cell growth inhibition efficacy, which is in line with the results that complex 1 causes nuclear DNA fragmentation, generates a higher level of ROS, perturbs cell cycle progression, and reduces Δψm.
Fig. 10. Profiles of Annexin-V FITC and PI staining of HCT116 cells undergoing apoptosis induced by complex 1 (0, 5, 10, 20 μM).
Conclusions
Two structurally different complexes showed excellent cytotoxicity toward four cancer cell lines. Further investigations suggested that complex 1 binds tightly to DNA via intercalation, and can cleave pBR322 DNA. In HCT116 cells, complex 1 was confirmed to enter the cell with DNA as one important target, block the cell cycle in the G0/G1 phase by DNA damage, activate intracellular ROS production and cause mitochondrial membrane potential dysfunction. Accordingly, the mitochondrial mediated pathway was closely related to the progression of apoptosis. These observations suggested that complex 1 is a promising anticancer candidate.
Conflicts of interest
The authors declare no competing interests.
Supplementary Material
Acknowledgments
We gratefully acknowledge the financial support provided by the National Natural Science Foundation of China (No. 21401041 and 21371046) and the Funding Program for Academic Technology Leaders of the He'nan University of Urban Construction (No. YCJXSJSDTR201705).
Footnotes
†Electronic supplementary information (ESI) available: Experimental sections and ESI-MS. CCDC 1532091 and 1532092. For ESI and crystallographic data in CIF or other electronic format see DOI: 10.1039/c7md00462a
References
- He Y., Yuan J., Qiao Y., Wang D., Chen W., Liu X., Chen H., Guo Z. Chem. Commun. 2015;51:14064–14067. doi: 10.1039/c5cc05257b. [DOI] [PubMed] [Google Scholar]
- Liu W., Gust R. Coord. Chem. Rev. 2016;329:191–213. [Google Scholar]
- Bergamo A., Sava G. Chem. Soc. Rev. 2015;44:8818–8835. doi: 10.1039/c5cs00134j. [DOI] [PubMed] [Google Scholar]
- Chitrapriy N., Wang W., Jang Y. J., Kim S. K., Kim J. H. J. Inorg. Biochem. 2014;140:153–159. doi: 10.1016/j.jinorgbio.2014.06.017. [DOI] [PubMed] [Google Scholar]
- Romero-Canelon I., Sadler P. J. Inorg. Chem. 2013;52:12276–12291. doi: 10.1021/ic400835n. [DOI] [PubMed] [Google Scholar]
- Wenzel M., Almeida A. D., Bigaeva E., Kavanagh P., Picquet M., Gendre P. L., Bodio E., Casini A. Inorg. Chem. 2016;55:2544–2557. doi: 10.1021/acs.inorgchem.5b02910. [DOI] [PubMed] [Google Scholar]
- Liu Z., Romero-Canelon I., Habtemariam A., Clarkson G. J., Sadler P. J. Organometallics. 2014;33:5324–5333. doi: 10.1021/om500644f. [DOI] [PMC free article] [PubMed] [Google Scholar]
- Wang Y., Liu M., Cao R., Zhang W., Yin M., Xiao X., Liu Q., Huang N. J. Med. Chem. 2013;56:1455–1466. doi: 10.1021/jm3009822. [DOI] [PubMed] [Google Scholar]
- Xie L., Luo Z., Zhao Z., Chen T. J. Med. Chem. 2017;60:202–214. doi: 10.1021/acs.jmedchem.6b00917. [DOI] [PubMed] [Google Scholar]
- Santini C., Pellei M., Gandin V., Porchia M., Tisato F., Marzano C. Chem. Rev. 2014;114:815–862. doi: 10.1021/cr400135x. [DOI] [PubMed] [Google Scholar]
- Huang Q.-W., Liu S.-G., Li G.-B., Wang S.-X., Su W.-Y., Liang D.-M., Mao S.-Q. J. Struct. Chem. 2015;56:458–462. [Google Scholar]
- Loganathan R., Ramakrishnan S., Suresh E., Riyasdeen A., Akbarsha M. A., Palaniandavar M. Inorg. Chem. 2012;51:5512–5532. doi: 10.1021/ic2017177. [DOI] [PubMed] [Google Scholar]
- Zhao J.-A., Yu H.-B., Zhi S.-C., Mao R.-N., Hu J.-Y., Wang X.-X. Chin. Chem. Lett. 2017;28:1539–1546. [Google Scholar]
- Asatkar A. K., Tripathi M., Panda S., Pande R., Zade S. S. Spectrochim. Acta, Part A. 2017;171:18–24. doi: 10.1016/j.saa.2016.07.029. [DOI] [PubMed] [Google Scholar]
- Wang W., Lee Y. A., Kim G., Kim S. K., Lee G. Y., Kim J., Kim Y., Park G. J., Kim C. J. Inorg. Biochem. 2015;153:143–149. doi: 10.1016/j.jinorgbio.2015.07.015. [DOI] [PubMed] [Google Scholar]
- Anjomshoa M., Hadadzadeh H., Torkzadeh-Mahani M., Fatemi S. J., Adeli-Sardou M., Rudbari H. A., Nardo V. M. Eur. J. Med. Chem. 2015;96:66–82. doi: 10.1016/j.ejmech.2015.04.020. [DOI] [PubMed] [Google Scholar]
- Ramakrishnan S., Rajendiran V., Palaniandavar M., Periasamy V. S., Srinag B. S., Krishnamurthy H., Akbarsha M. A. Inorg. Chem. 2009;48:1309–1322. doi: 10.1021/ic801144x. [DOI] [PubMed] [Google Scholar]
- Prosser K. E., Chang S. W., Saraci F., Le P. H., Walsby C. J. J. Inorg. Biochem. 2017;167:89–99. doi: 10.1016/j.jinorgbio.2016.11.006. [DOI] [PubMed] [Google Scholar]
- Soler M., Figueras E., Serrano-Plana J., Gonzalez-Bartulos M., Massaguer A., Company A., Martinez M. A., Malina J., Brabec V., Feliu L., Planas M., Ribas X., Costas M. Inorg. Chem. 2015;54:10542–10558. doi: 10.1021/acs.inorgchem.5b01680. [DOI] [PubMed] [Google Scholar]
- Sun R. W. Y., Li K. L., Ma D. L., Yan J. J., Lok C. N., Leung C. H., Zhu N., Che C. M. Chem. - Eur. J. 2010;16:3097–3113. doi: 10.1002/chem.200902741. [DOI] [PubMed] [Google Scholar]
- Poornima S., Gunasekaran K., Kandaswarmy M. Dalton Trans. 2015;44:16361–16371. doi: 10.1039/c4dt01744g. [DOI] [PubMed] [Google Scholar]
- Palanimuthu D., Shinde S. V., Somasundaram K., Samuelson A. G. J. Med. Chem. 2013;56:722–734. doi: 10.1021/jm300938r. [DOI] [PubMed] [Google Scholar]
- Bhat S. S., Kumbhar A. A., Heptullah H., Khan A. A., Gobre V. V., Gejji S. P., Puranik V. G. Inorg. Chem. 2011;50:545–558. doi: 10.1021/ic101534n. [DOI] [PubMed] [Google Scholar]
- Fu X.-B., Liu D.-D., Lin Y., Hu W., Mao Z.-W., Le X.-Y. Dalton Trans. 2014;43:8721–8737. doi: 10.1039/c3dt53577k. [DOI] [PubMed] [Google Scholar]
- Gutierrez A. G., Aguirre A. V., Garcia-Ramos J. C., Flores-Alamo M., Hernandez-Lemus E., Ruiz-Azuara L., Mejia C. J. Inorg. Biochem. 2013;126:17–25. doi: 10.1016/j.jinorgbio.2013.05.001. [DOI] [PubMed] [Google Scholar]
- Slator C., Barron N., Howe O., Kellett A. ACS Chem. Biol. 2016;11:159–171. doi: 10.1021/acschembio.5b00513. [DOI] [PubMed] [Google Scholar]
- Liang J.-W., Wang Y., Du K.-J., Li G.-Y., Guan R.-L., Ji L.-N., Chao H. J. Inorg. Biochem. 2014;141:17–27. doi: 10.1016/j.jinorgbio.2014.08.006. [DOI] [PubMed] [Google Scholar]
- Qi J., Gou Y., Zhang Y., Yang K., Chen S., Liu L., Wu X., Wang T., Zhang W., Yang F. J. Med. Chem. 2016;59:7497–7511. doi: 10.1021/acs.jmedchem.6b00509. [DOI] [PubMed] [Google Scholar]
Associated Data
This section collects any data citations, data availability statements, or supplementary materials included in this article.


