In recent years, there has been an increasing interest in millimeter-wave (mm-wave) technologies operating at frequencies between 10 and 300 GHz. mm-wave communication provides higher transfer rates that will be employed in the next-generation wireless networks. However, mm-wave device exposure compliance assessment is challenging due to a reduced wavelength and an increased number of antennas. In this article, we discuss physical features of future mm-wave communication networks and describe the requirements for proper exposure compliance assessment. Leading technologies that can be prospectively used for mm-wave exposure compliance are surveyed. Their pros and cons with respect to operating frequency, availability, sensitivity, and speed are discussed.
OVERVIEW OF MILLIMETER-WAVE DEVICES DEVICES
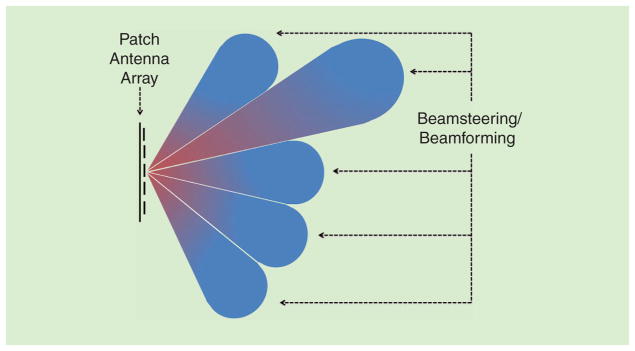
Millimeter-wave frequencies between 10 and 300 GHz are the new frontier for wireless communications that promise orders of magnitude higher bandwidths and transfer rates. The available spectrum at these higher frequencies can easily be 200 times greater than today’s cellular allocations that are mostly constrained to frequencies below 6 GHz [1]. Efficient signal transmission (Tx) and reception has been made possible via advances in low-power complementary metal–oxide–semiconductors radio-frequency (RF) circuits with a large number of miniaturized antenna elements inside each mm-wave device [2]. Millimeter- wave multiarray (mArr) systems can achieve higher gain using electrically steerable arrays, where the amplitude and phase of each antenna element is changed for what is called beamsteering or beamforming, as illustrated in Figure 1 [3]. These mArr systems are being developed and placed in a multitude of wireless devices [1]. The tremendous potential associated with mm-wave devices has led to considerable interest from both academia and industry [4], with the belief that mm-wave technology will be utilized for the next-generation wireless devices. Several propagation studies at 28 and 73 GHz have shown that for nonline-of-site conditions, sufficient signal strength can be detected between 100 and 200 m with under 1 W of transmit power [4]. Given the power levels provided by mobile devices, these distances are significantly smaller relative to its fourth-generation-communication counterpart. The reliance on highly directional antennas necessitates change in future fifth-generation (5G) systems and has a significant impact on compliance assessment of these devices.
FIGURE 1.
The schematic representation of a beamforming using the mArr antenna system.
Millimeter-wave devices can operate both in the far-field and near-field regimes [1], and a growing number of mm-wave wireless devices are now supporting near-field communication connectivity standards requiring that devices function when in close proximity to one another. Power absorption in the near field depends on a multitude of factors, including frequency of operation, medium in which the electromagnetic (EM) field is transmitted, and distance between the antenna and the body. These factors, including the shallow penetration depth and scattering effect of mm-waves, necessitate compliance protocols and systems to be adapted such that they can estimate a conservative exposure scenario [1]. Compliance testing is further complicated by the fact that mm-wave wireless systems utilize hardware to control the relative amplitude and phase of individual transmit elements and increase communication fidelity. When changing the amplitude and phase relationships between different transmitter elements, constructive or destructive interferences may occur near the wireless device. These depend on the antenna load, the distance between each antenna element, and the user’s body or other materials (e.g., clothing).
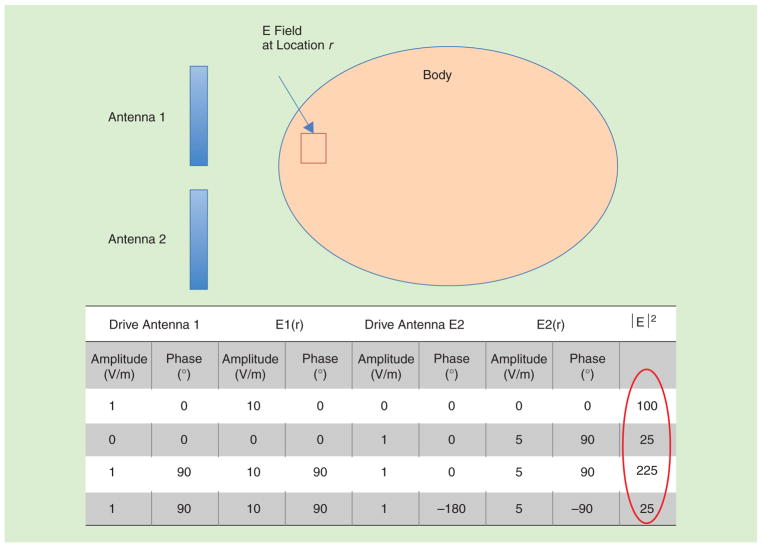
A simplified hypothetical two-antenna example is illustrated in Figure 2. Assuming that a transmit weighting of 1 with 0 phase is applied to the first antenna element results in an electric field (E field) of 10 V/m and 0 phase at the location illustrated with a red square. Conversely, if the second antenna element is pulsed solely with unit amplitude of 1 and phase of 0, the resulting E field at position r is 5 V/m with a phase of 90°. This phase relationship between the E fields generated by the transmit elements complicates the estimation of mm-wave power deposition inside the body. If, for example, antenna 1 is pulsed with amplitude of 1 with a 90° phase shift, while the second antenna is pulsed with unit amplitude, constructive E-field interference is observed where the square of the E field is magnified. Because mm-wave power deposition distribution is proportional to the square of the sum of E fields, phase and amplitude relations between antenna elements can have an impact on the power deposited inside tissues. Conversely, if the first antenna is driven with amplitude 1 and phase of 90°, while the second transmitter is driven with amplitude 1 and phase of −180°, destructive interference of the waves is observed in the region of interest (Figure 2, red box), and power deposition is reduced. These types of constructive/destructive interferences are common to multiple-antenna systems operating in the near field [5]. The abovementioned complex interactions of the E field between antenna elements of the array are highly dependent on the geometry of the antenna, composition of the body, and distance of the wireless device from dielectric tissues. These features contribute for making compliance assessment of mm-wave devices more challenging [1].
FIGURE 2.
An example of different exposure scenarios from a simplified two-channel mArr system.
Past compliance testing of wireless devices was mostly performed on devices operating below 6 GHz. To show compliance of wireless devices below 6 GHz, regulatory bodies worldwide require a specific absorption rate (SAR) measurement to be conducted in phantoms, where SAR is a measure of the rate of RF/microwave energy deposition inside tissue. Phantoms are used as they are a quasistandard technique for RF/microwave testing and medical device compliance testing. SAR in the phantom is averaged over 1 or 10 g of tissue and is required to stay below an approved regulatory limit. Millimeter-wave devices deposit the most of their energy at the surface of the body. Because the power deposition is localized to a shallow region, a traditional 1- or 10-g average SAR metric is not appropriate for mm-wave compliance because it can underestimate the power deposition inside the phantom. Furthermore, probe technology used for compliance below 6 GHz has difficulty measuring the E field close to the air boundary, where the energy deposition is maximum [2]. The utilization of a large number of transmitting elements used in mm-wave communication may necessitate a longer compliance testing procedure because a larger number of radiative patterns may need assessment. The large number of tests can pose cost and time-to-market challenges for wireless manufacturers and/or regulatory bodies in need of testing these devices. The goal of this work is to review measurement systems that can potentially be used for regulatory assessment of mm-wave devices. Advantages and disadvantages of each technology are described and conclusions are made regarding the technological needs of the future state-of-the-art mm-wave assessment systems.
MEASUREMENT SYSTEMS
Measurement systems technologies for compliance testing of mm-waves can be classified into two groups: invasive and noninvasive systems. Invasive systems require probes, e.g., E field or temperature, to be inserted into the sample where the compliance assessment takes place. Noninvasive systems assess the compliance of devices using measurements from outside of the sample without disturbing the structure of the sample. E-field probe-based systems [7], electro-optical (EO) probe-based systems [8], and optical fiber thermal sensor-based systems [9] are classified as invasive measurement systems. Infrared (IR) measurement systems [10], thermal scanner systems [11], power density (PD) measurements [12], and optical SAR systems [13], [14] can be classified as noninvasive measurement systems with minimal to no interactions between the device under test (DUT) and the measurement system.
E-FIELD PROBE-BASED SYSTEMS
SINGLE E-FIELD PROBE SYSTEMS
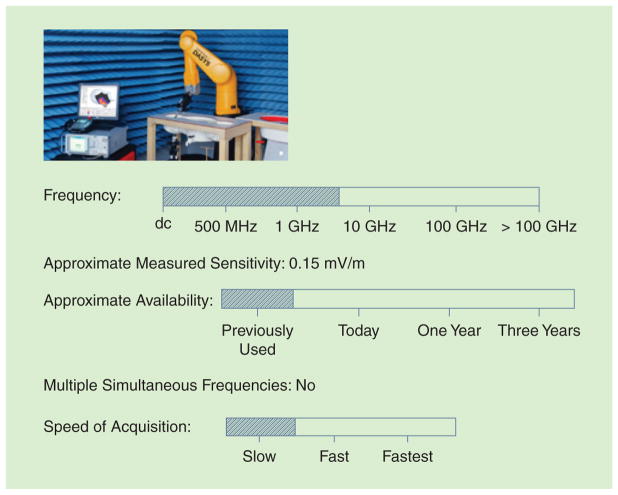
Standardized compliance testing below 6 GHz utilizes a single E-field probe [7] that is mechanically moved using an articulated robotic arm in three-dimensional (3-D) space inside a phantom filled with a liquid mimicking the electrical properties of human tissues. Figure 3 illustrates a commonly used single E-field probe system alongside features of the E-field system. For standard tests, the E field is probed first using a fast scan, which searches for the maximum E field on a two-dimensional (2-D) plane with coarse resolution. After the maximum E field on the 2-D plane is identified, a fine-resolution 3-D scan is conducted, and 1- or 10-g average SAR is computed from the magnitude E-field measurements.
FIGURE 3.
The E-field probe system features. (Photograph courtesy of speag.com.)
Pros: Established and standardized system for current cellular frequencies employed for frequencies below 6 GHz. These systems have been around since 1996 [7], and the standards, therefore, have been set and tested, while the equipment, e.g., phantoms, is optimized for this technique. These systems have been shown to have an uncertainty budget of less than 30% (K = 2), and compliance measurements using these systems are streamlined through years of evolution. These systems utilize an articulated robot arm and measurements are automated with minimal human intervention.
Cons: Moving a robotic arm to scan the E field inside the phantom can take more than 20 min to locate and determine the point of maximum average SAR. E-field probes require calibration to preserve isotropy of the probe measurements. Additionally, measurement of E-field components within a few millimeters of the surface, where most of the energy is deposited at mm-wave frequencies, is challenging because of the loss of isotropy of the probes at the phantom edge due to the air/phantom boundary interactions with the dielectric fluid [9]. Measurements are conducted in relatively coarse resolution (a few millimeters), therefore, for accurate computation of SAR and estimation of the maximum energy deposition on the surface, several interpolation techniques are used. Other estimation techniques and alteration of the E-field probe may be needed to properly assess energy deposition from devices operating at mm-wave frequencies. These systems measure the amplitude of the E field but are not capable of measuring the absolute E-field phase necessary for multielement antenna systems.
ARRAY E-FIELD PROBE SYSTEMS
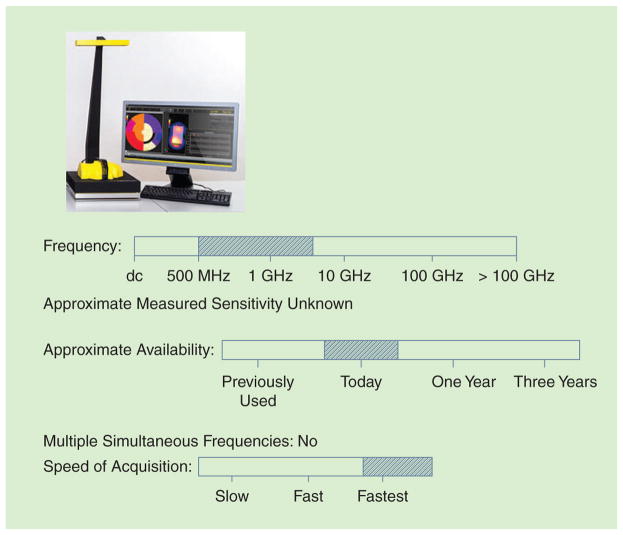
In recent years, several vendors have been developing mArr E-field probe systems because single E-field probe systems scans can require more than 20 min per measurement. The purpose of these systems was to provide an estimation of the energy deposition on the order of a few seconds. These E-field array systems utilize a large number of probes densely packed into arrays placed on a 2-D plane located inside a solid phantom. Once the DUT is activated next to the phantom, the magnitude of the E field is measured on that plane, and extrapolation techniques are used to assess the SAR between the measurement plane and the surface of the phantom. Uncertainties of using these types of systems are of a similar order of magnitude to that of single probe systems. Figure 4 illustrates a conventional array of an E-field probe system alongside its features.
FIGURE 4.
The E-field probe scanning system features. (Photograph courtesy of speag.com.)
Pros: An estimation of the spatial average SAR can be determined within seconds. These systems may be used in the future for rapid SAR measurements to rapidly estimate the setup/modes that deposit maximum energy into the phantom. Currently, E-field array probe systems are used for precompliance purposes where the frequency band responsible for the largest hotspot inside the phantoms is identified prior to full compliance measurements that are conducted using a single E-field probe system. The system is a closed system, no phantom liquid adjustment is needed, and SAR measurement is automated.
Cons: Densely located multiple E-field probes inside the phantom may interact with the DUT as well as between each other. These interactions can be more significant at higher frequencies, as denser probe placements may be required, and can be detrimental for mm-wave compliance assessment. Extrapolation techniques are needed for SAR computation on the surface, which can potentially introduce errors in the computation. In addition to the errors caused by the E-field extrapolation, the E-field probe array itself can change the average tissue properties of the phantom. Similar to the singe E-field probe systems, only the magnitude of the E field is measurable.
EO PROBE-BASED SYSTEMS
SINGLE EO PROBE SYSTEMS
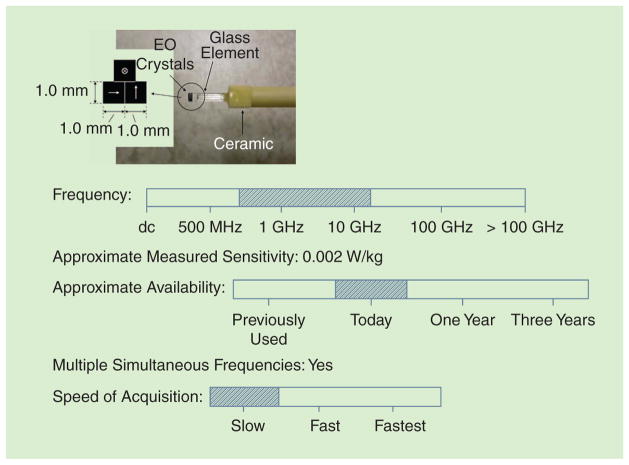
EO probes have been developed using various strategies, making use of miniature dipole antennas [15] and bulk crystals [16], such as LiNBO3 and CdTe, for compliance assessment by measuring either E field or H field. New generations of the EO probes [17] include a metal-free implementation of EO crystal that is connected to the optical components with an optical fiber. Similar to the E-field probes, EO crystals can be located into three orthogonal axes to measure orthogonal components of the E fields simultaneously [18]. The prototype of the three-axis EO probe is shown to be capable of measuring both the amplitude and phase of the E field and in a good agreement with EM field simulations performed with the finite difference time domain method [18]. A single EO probe and its features are illustrated in Figure 5.
FIGURE 5.
The EO probe system features. (Image courtesy of [17].)
Pros: The tip of the EO probe consists of a 1-mm3 cubic EO crystal without any metallic components, allowing minimal disturbance of the E field during measurement. The fabricated EO probe has flat sensitivity from 2 to 20 GHz and directivity with cross-axis sensitivity isolation greater than 45 dB. Measurement output of the probe is linear within ±0.3 dB over the SAR range from 0.01 to 100 W/kg, and the minimum sensitivity of the probe is 0.002 W/kg, satisfying the specifications determined by the International Electrotechnical Commission [19].
Cons: EO probes need to be moved inside the phantom to obtain the spatial E-field information during exposure. Similar to single E-field probe-based systems, due to the required point-by-point movement nature of the probe, full exposure assessment is time consuming. Stability of the system needs to be investigated for mm-wave exposure.
VECTOR ARRAY EO PROBE-BASED SYSTEMS
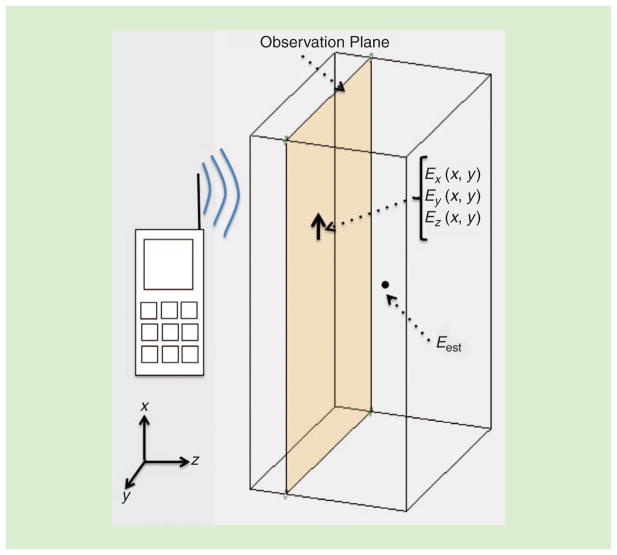
Vector array probe systems utilize 2-D arrays of EO probes that are typically placed several millimeters inside a dielectric phantom. The EO probes rely on the electro-optic effect important in optoelectronics, as it allows the modulation of optical beams by electric signals. Vector probes are capable of measuring both the magnitude and phase of the EM field, and several vector systems have been designed between the dc to 6 GHz range. For compliance measurement, EO probes are typically oriented as part of an observation plane, where a large number of densely spaced probes are distributed in a single 2-D plane, as shown in Figure 6 [8].
FIGURE 6.
The schematic representation of vector array probe-based systems. These systems incorporate multiple probes located on the observation plane. Measurements on the observation plane are extrapolated to obtain the field between the plane and the phantom surface.
E-field information is then collected using the vector probe array, and the 3-D SAR distribution inside the phantom is estimated close to the DUT. To enable the calculation of the 3-D SAR distribution properly, vector array systems rely on the equivalence principle and image theory [20]. These assume that 1) EM waves are only incident through the observation plane, 2) no reflections occur within the phantom, and 3) the electric and magnetic fields at the observation plane are secondary sources. Via these assumptions, the E-field distributions at different depths can be estimated, and subsequently, spatially average SAR can be computed from these calculations [8]. Figure 7 illustrates a vector probe system and its features.
FIGURE 7.
The EO probe vector array system features. (Photograph courtesy of art-fi.eu.)
Pros: DUTs currently have multiple transmit antennas and multiple modes of operation. As a result, many experimental conditions where the DUT is placed next to the body or head phantoms need to be evaluated prior to compliance approval of devices. Vector probe systems measure the E field on the order of a few seconds and can rapidly test all these different configurations. These systems provide a quick and easy way to estimate the power deposited by DUTs. Similarly, because each probe in the array measures the magnitude and phase of the E field, the vector probe system is particularly good at estimating the complex superposition of the E field from different antenna elements. This can be particularly attractive for wireless devices with a large number of directional antennas used for transmission.
Cons: Vector probe systems typically operate under the assumption that there is negligible interference between the RF from the DUT and the sensors inside the phantoms. Under 6 GHz, small coupling and reflections are expected between the DUT and observation plane of probes. However, at mm-wave frequencies, the majority of the energy gets deposited at the surface. Significant reflections may occur inside the phantom due to the EO probe system. Furthermore, the invasive insertion of a large number of probes, depending on the composition of the observation plane, may change the loading conditions due to the discontinuity of dielectrics inside the phantom, and the average tissue properties of the phantom may change as well. As a result, vector probe system inaccuracies may be exacerbated at higher frequencies.
OPTICAL FIBER THERMAL SENSOR-BASED SYSTEMS
Temperature-based dosimetry systems were developed using a 3-D array of optical fiber thermal sensors positioned inside a tissue-mimicking semisolid phantom [9], [21]. Average SAR is evaluated within a 1- or 10-g mass, covered by multiple optical fiber thermal sensors, by measuring the temperature rise ΔT due to field exposure in each sensor location and using
| (1) |
where Cph is the specific heat of the semisolid phantom material and Δt is the exposure duration. Thermal SAR evaluation systems show a good agreement with E-field probe measurements for frequencies <6 GHz [22]. Additionally, they are used for validating the standard based on E-field probes and for evaluating the uncertainty of the measurement system [9], [22]. Figure 8 illustrates an optical fiber thermal sensor and its features.
FIGURE 8.
The optical fiber thermal sensor features. (Image courtesy of [8].)
Pros: Optical fiber thermal sensors do not show frequency dependence as temperature measurements are obtained. Because of this property, these systems can evaluate SARs over a wide frequency range, including mm-wave frequencies. Therefore, they are also suitable for additional validation testing of other compliance testing systems.
Cons: Spatial resolution has been limited because of the large number of temperature probes that need to be positioned inside the phantom invasively. This system measures temperature change related to the exposure. Heating duration plays an important role in estimating the SAR, however, the heat diffusion effects are neglected in (1) during SAR calculations. Keeping the duration of heating small requires sufficient device output RF power to minimize the heat diffusion, while being able to accurately measure a temperature change. Device exposure characteristics need to be modified to supply sufficient power output to be detected by optical fiber thermal sensors within short exposure duration.
PD MEASUREMENTS
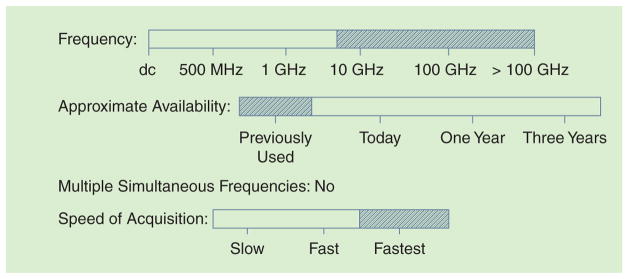
PD is a metric associated with the power radiated from an antenna used to demonstrate compliance with various regulatory requirements. PD measurements are most applicable to the determination of radiation in the far field. The measurement is performed by quantifying the signal strength received with an antenna, which is converted to a power measurement by scaling the measurement with known parameters, such as the gain of the radiating element and the distance between the element and horn antenna. The features of PD measurements are summarized in Figure 9.
FIGURE 9.
The PD features.
Pros: PD is an over-the-air measurement and can be done quickly with inexpensive equipment (an antenna and spectrum analyzer).
Cons: Calculations do not provide any spatial information regarding the spatial pattern of power deposition. PD may overestimate the power absorption due to the assumption of reflection-free power deposition. A recent study [23] has shown that utilizing PD for compliance purposes can cause the maximum output power of wireless devices operating above 6 GHz to be reduced by several decibels due to the overestimation of the technique.
THERMAL MAGNETIC RESONANCE SCANNER SYSTEM
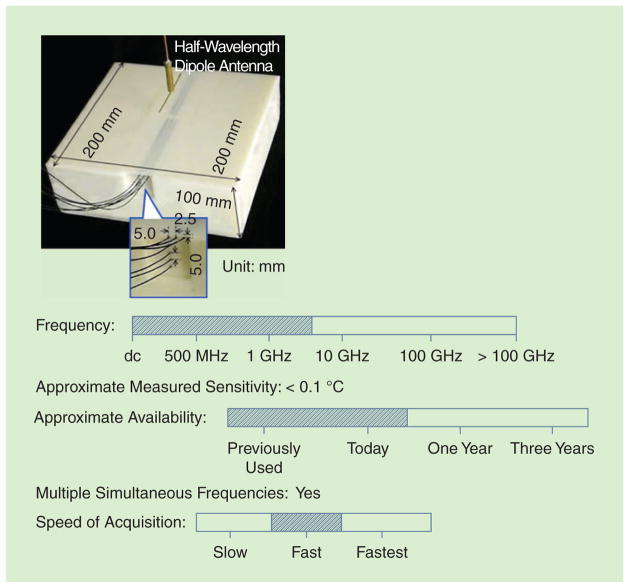
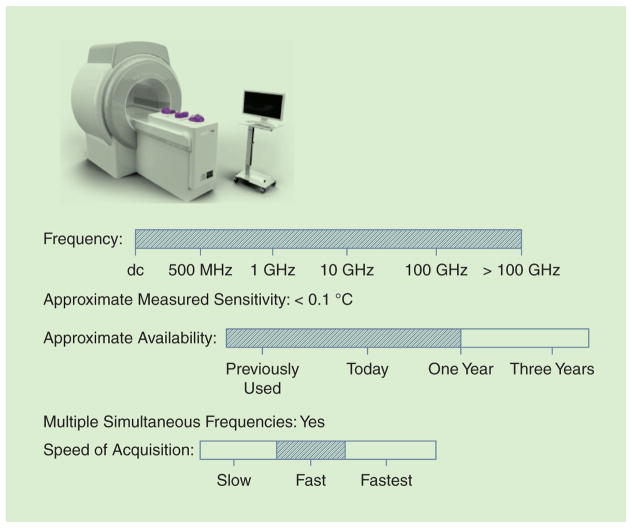
Thermal scanning using magnetic resonance imaging (MRI) has been used to noninvasively quantify temperature and energy deposition in the megahertz frequency range [24], [25]. Recently, the technique has been expanded to accommodate high-frequency wireless device sources that have traditionally been considered to be incompatible with MRI [11]. The method is sensitive to small temperature changes (<0.1°C) and evaluates SAR with millimeter resolution [11]. Recent studies have shown that from the 3-D temperature change, SAR can be computed via direct inversion of the heat equation [26]. The utilization of the heat equation inversion mitigates errors associated with heat diffusion and energy exchange with air and removes the requirement of changing device exposure characteristics to shorten the heating duration. An illustration of an MRI thermal scanner is shown in Figure 10 alongside the scanner’s features.
FIGURE 10.
The MRI thermal scanning features. (Photograph courtesy of RF Test Labs.)
Pros: MRI thermal scanning for compliance assessment of wireless devices is wide band by its nature and does not require invasive probes. The technique provides volumetric thermometry and SAR information in the entire phantom in about 1 min. Additionally, the technique’s millimeter spatial resolution enables local energy measurements at the phantom surface. This is particularly useful for compliance assessment of wireless devices operating above 6 GHz, where the energy penetration is mainly confined to the surface. The system uses highly durable semisolid phantoms with long-term dielectric stability. Temperature change evaluation from simultaneous transmission is also possible using this technique.
Cons: Thermal MR scanner systems measure minute temperature changes as a result of the power deposition. These measurements require slight heating of the phantom. A limitation of this method is its inability to measure the E-field phase relationship between Tx elements in an antenna array because this system measures only the amplitude (temperature change). This leads to a larger scan time compared to systems capable of measuring the phase when measuring the exposure from mArr systems. Similarly, temperature is currently being established as a metric for compliance purposes; therefore, it will require these standards to be updated.
OPTICAL SAR SYSTEM
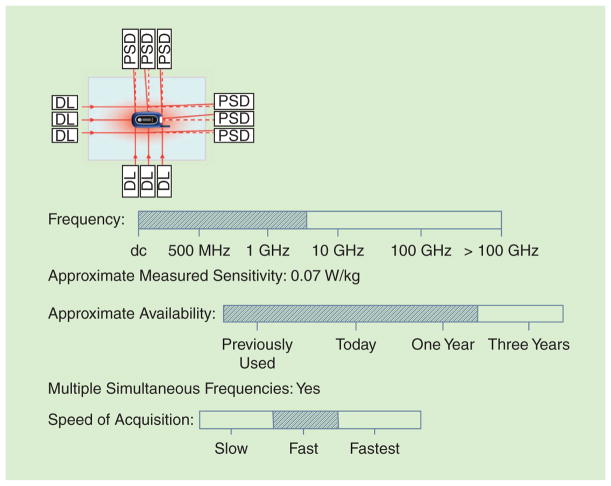
True SAR measurements of RF exposure can also be detected through the deflection of laser beams that are produced by the RF energy absorbed in a transparent phantom [13], [14]. Using multiple diode lasers, the system detects the temperature change in a phantom (filled with tissue-simulating liquid) along several paths and converts it into SAR using the specific heat of the phantom and the duration of the exposure. This is done by capturing the initial slope of the temperature rise curve. An illustration of an optical SAR system alongside its features is shown in Figure 11.
FIGURE 11.
The optical SAR system features. (Image courtesy of [32].)
Pros: Optical SAR systems are another cost-effective way to measure RF exposure and have some key advantages. These laser beams do not interfere with the RF fields nor contribute to the heating. There are no invasive probes or materials that will interfere with the RF energy that is being emitted nor will it affect the measurements of the radiation. The basic sensitivity levels achieved correspond to 0.1 W/kg. In addition, there is a high-resolution image of the area measured compared to fiber optic probes. Compared to other measurement systems, optical SAR measurement systems use inexpensive diode lasers and detectors. Instantaneous temperature rise results can be measured using optical SAR systems.
Cons: Unfortunately, optical SAR systems still have inherent issues that make for measuring RF exposure not quite a simple, reliable process. These systems require specific phantom materials, and the phantoms must consist of specific types of chemicals or materials to obtain accurate measurements. One concern is the use of optically clear liquids that are volatile and can evaporate quickly. This limits the types of chemicals that can be used to simulate the tissue. In addition, the phantom must be fairly transparent.
IR SYSTEMS
IR thermometry has been around for decades; it is commonly used to map temperature changes on the surface of objects [27]. IR technology has been utilized in many applications for industrial and research use as it offers non-contact measurements of temperature and at a high resolution [28], [29]. All of these factors have led IR technology to become an area of interest for new kinds of applications.
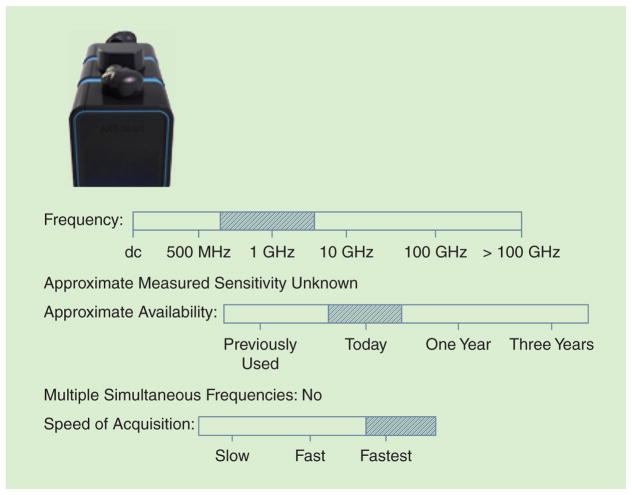
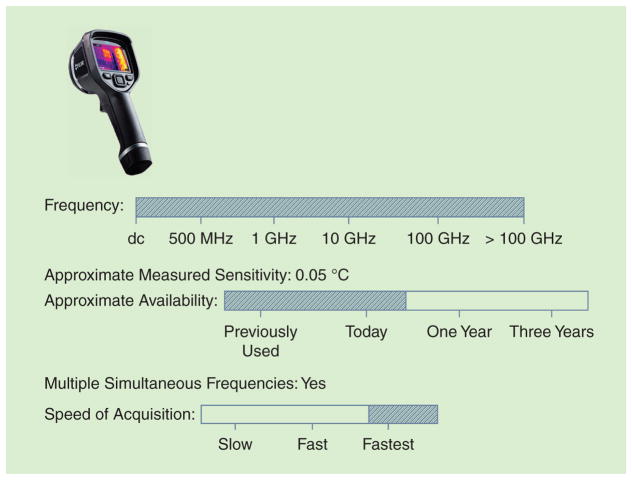
IR systems measure the thermal energy that radiates off surfaces and convert it to electrical signals, which are then interpreted as temperature measurements. IR measurement systems take into account the ambient temperature and other factors (i.e., the material of the surface) to produce a reliable, accurate measurement. Different IR measurement systems can measure either at a spot on the surface (IR gun) or measure over many points of a large area (IR camera) [10]. Overall, IR systems are effective options for measuring the radiation from RF emissions. An illustration of an IR system alongside its features is shown in Figure 12.
FIGURE 12.
The IR imaging system features. (Photo courtesy of flri.com.)
Pros: IR measurement systems are quick and efficient at measuring temperature. These systems have several advantages. First, IR systems are very fast, which allows for more measurements. This speed also allows for quick, almost instantaneous, measurements of multiple objects, which can lead to the development of automation, i.e., assembly line/conveyor belt processes. Measurements are not distorted by the material of the target, nor is there any contact with the target for energy loss, transfer, or interaction. Also measurements are contactless, and, therefore, do not contaminate or change the object. IR cameras are inexpensive as new innovations have reduced costs and improved performance. The speed of the measurement also makes it an inexpensive process for measuring RF exposure. Finally, IR cameras have a high level of accuracy with increased reliability because of the technology available.
Cons: Often, maximal heating of phantoms occurs a few millimeters inside the phantom due to the heat exchange between air and the phantom cooling down the surface. As a result, IR can underestimate maximal exposure. Additionally, IR systems are limited to surface measurements. In the case of a shell phantom, only the shell would be measurable unless the phantom shell was opened/removed. Repetitive removal of the phantom shell can degrade the structural integrity of solid gels as well as change the dielectric properties of the gel. IR imaging also directly measures temperature rather than SAR and, therefore, temperature change will have to be established within compliance standards. Furthermore, IR systems need to be carefully stored and sensors kept clean, and the distance of measurement could affect the accuracy of the measurements. Temperature is currently being established as a metric for compliance purposes.
DISCUSSION AND CONCLUSIONS
Millimeter-wave wireless devices are the next frontier of communication devices capable of transferring data at high speed. However, due to the engineering of these devices and the propagation physics at these frequencies, updates to the current exposure compliance testing technologies and standards will have to take place. The two largest challenges associated with measuring power deposition from mm-wave devices are the shallow penetration of the mm-wave, which challenges conventional testing systems, and the great diversity of directional antennas that may be positioned inside the device of the future. Because these devices can operate in the near field, a large number of tests will have to take place to properly characterize the power deposition from these devices, and this can amount to a significant time spent for exposure compliance testing of these devices [25]. From this perspective, it is helpful if the testing technology is capable of testing both amplitude and phase (in three dimensions) for the fields generated.
Knowledge of the phase information is important because it significantly reduces the number of tests. For example, for a transmit array antenna with n antennas, if the phase and amplitude information are known, n number of measurements per mode and position are required [25]. Without the phase, significantly more measurements are needed to account for the E-field correlations between the antenna elements. Possibly depending on the size of the antenna array and the spacing between antenna elements, several assumptions can be made to reduce the testing time required. Test-time reduction for exposure compliance testing is an active area of research, and it remains to be seen which types of reductions can be confidently applied to mm-wave devices. To reduce the scan time of mm-wave devices, mArr sensing technologies are used to scan the power deposition from these devices. However, the interaction of the mm-wave device and the probe array can affect the measurement accuracy. Therefore, careful characterization of the interaction between the probing system and DUT as a function of frequency is needed.
With regard to noninvasive methodologies, thermal mapping using MRI has been shown to be capable of characterizing the power deposition from mm-wave devices [30]. This method is particularly desirable for measuring the temperature change at a much higher resolution than shown in prior work, which has been demonstrated useful for probing close to surface boundaries. In the future, IR thermal imaging can be used because it provides high sensitivity to surface temperature changes. However, because this is a 2-D measurement conducted on a phantom with no shell, estimation of the maximum power deposition in 3-D inside the phantom remains challenging. One clear advantage that temperature measurement holds is its frequency insensitivity. This means that simultaneous transmission can take place while measuring the end result—temperature change. However, currently, temperature limits and measurement technologies are not defined for exposure compliance purposes of wireless devices. Therefore, updates to the current standards will have to take place prior to using temperature-based techniques.
One particularly attractive technology is the EO probe systems. These probe systems are wide band, small, and, because most of the signal is transmitted via optical cabling, there is little interference between the EO probe and the DUT relative to other invasive probe systems as nonconductive materials are used. As a result, probing close to phantom- air boundaries without disrupting the E field is possible. EO probe systems are also capable of measuring the peak E field from several different frequencies at the same time, allowing for simultaneous measurement of the power deposited from several transmitting modalities at once. This is particularly useful because devices often transmit simultaneously at different frequencies, and it will be necessary to know the E field generated from each of these transmissions. This ability to measure several frequencies at once can further improve the speed of testing for mm-wave devices. Furthermore, because EO probe systems are capable of measuring the amplitude and phase of the E field, further reductions in test time are expected when using these probes for mArr systems.
In this article, physical compliance testing technologies that can be used for the assessment of mm-wave devices were outlined. In recent years, we have seen a significant advancement in the use of EM field simulation to assess compliance predominantly in environments where controlled lab compliance testing is difficult to conduct. In cases where simulation software is used for compliance, wireless devices need to be modeled with extreme accuracy. Modeling of complex antenna-load structures to match realistic physical conditions using EM field simulations, however, is not straightforward and can be challenging for the mm-wave frequencies [31]. Possible discrepancies between simulated and manufactured devices may reduce the accuracy of RF compliance assessment, and large uncertainty margins may be needed when using EM field simulations for compliance. The utilization of simulation software for exposure assessment is an active area of research, and further research is needed to qualify its use for compliance purposes [7].
We do not have a viable solution to exposure compliance evaluation of the expected diversity of devices that will emerge soon. There are many promising new techniques that still need work to apply them suitably to the issue, but the evolution of the DUT is faster than the measurement system evolution. A paradigm shift is needed to leap ahead and offer a solution for the future.
Acknowledgments
We would like to thank Vodafone, United Kingdom, for its support of this project.
Biographies
Leeor Alon (leeoralon@yahoo.com) is a postdoctoral fellow in the Department of Radiology at the New York University School of Medicine and is a cofounder of RF Test Labs in New York City. He conducts research in magnetic resonance imaging and radio-frequency (RF) electrodynamics. His research interests include RF power exposure measurement techniques and RF safety. He is a Member of the IEEE.
Sami Gabriel (Sami.Gabriel@vodaphone.com) is the chief engineer in research and development with Vodafone Group in Newbury, England. He is an expert advisor to the U.K. Mobile Operators Association and GSM Association on mobile device specific absorption rate evaluation matters. He is a member of the IEEE International Committee on Electromagnetic Safety, Technical Committee 34.
Gene Young Cho (aglawega@gmail.com) is a postdoctoral fellow at Memorial Sloan Kettering Cancer Center and New York University School of Medicine in New York City. His work involves developing standardized quantitative magnetic resonance imaging biomarkers for breast cancer. His research interests include diffusion imaging and cancer research.
Ryan Brown (Ryan.Brown@nyumc.org) is with the New York University School of Medicine, where he develops hardware for high-field and multinuclear magnetic resonance imaging to gain insight on anatomical and functional aspects of human tissue.
Cem M. Deniz (cem_muratt@yahoo.com) is an assistant professor in the Department of Radiology at the New York University School of Medicine and is a cofounder of RF Test Labs in New York City. His research interests include exposure assessment of wireless devices, high-field magnetic resonance imaging, and radio-frequency pulse design for parallel transmission. He is a Member of the IEEE.
References
- 1.Rappaport TS, Mayzus R, Azar Y, Wang K, Wong GN, Schulz JK, Samimi M, Gutierrez F. Millimeter wave mobile communications for 5G cellular: It will work! IEEE Access. 2013;1:335–349. [Google Scholar]
- 2.Alekseev SI, Ziskin MC. Millimeter wave power density in aqueous biological samples. Bioelectromagnetics. 2001;22(4):288–291. doi: 10.1002/bem.52. [DOI] [PubMed] [Google Scholar]
- 3.Tolkachev AA, Denisenko VV, Shishlov AV, Shubov AG. High gain antenna systems for millimeter wave radars with combined electrical and mechanical beam steering. Proc IEEE Symp Phased Array System and Technology. 1996:266–271. [Google Scholar]
- 4.Rangan S, Rappaport TS, Erkip E. Millimeter- wave cellular wireless networks: Potentials and challenges. Proc IEEE. 2014;102(3):366–385. [Google Scholar]
- 5.Zhu Y, Alon L, Deniz CM, Brown R, Sodickson DK. System and SAR characterization in parallel RF transmission. Magn Reson Med. 2012;67(5):1367–1378. doi: 10.1002/mrm.23126. [DOI] [PMC free article] [PubMed] [Google Scholar]
- 6.Karjalainen J, Nekovee M, Benn H, Kim W, Park J, Sungsoo H. Challenges and opportunities of mm-wave communication in 5G networks. Proc 9th Int Conf Cognitive Radio Oriented Wireless Networks. 2014:372–376. [Google Scholar]
- 7.Schmid T, Egger O, Kuster N. Automated E-field scanning system for dosimetric assessments. IEEE Trans Microw Theory Techn. 1996;44(1):105–113. [Google Scholar]
- 8.Le DT, Hamada L, Watanabe S, Onishi T. Proc 2014 Int Symp Electromagnetic Compatibility, Tokyo (EMC’14/Tokyo) An estimation method for vector probes used in determination SAR of multiple-antenna transmission systems; pp. 629–632. [Google Scholar]
- 9.Okano Y, Shimoji H. Comparison measurement for specific absorption rate with physically different procedure. IEEE Trans Instrum Meas. 2012;61(2):439–446. [Google Scholar]
- 10.Gladman AS, Davidson SRH, Easty AC, Joy ML, Sherar MD. Infrared thermographic SAR measurements of interstitial hyperthermia applicators: Errors due to thermal conduction and convection. Int J Hyperth. 2004 Jan;20(5):539–555. doi: 10.1080/02656730410001668366. [DOI] [PubMed] [Google Scholar]
- 11.Alon L, Cho GY, Yang X, Sodickson DK, Deniz CM. A method for safety testing of radiofrequency/microwave-emitting devices using MRI. Magn Reson Med. 2015;74:1397–1405. doi: 10.1002/mrm.25521. [DOI] [PMC free article] [PubMed] [Google Scholar]
- 12.Miclaus S, Bechet P. Estimated and measured values of the radiofrequency radiation power density around cellular base stations. Environ Phys. 2007;52:429–440. [Google Scholar]
- 13.Hodzic V, Gammon RW, Balzano Q, Davis CC. Rapid optical SAR measurements. Department of Electrical and Computer Engineering, University of Maryland; College Park: 2016. Oct, [Online]. Available: https://www.ece.umd.edu/rrd/98-sarposterrrd09.pdf. [Google Scholar]
- 14.Davis C, Balzano Q, Hodzic V, Gammon RW. Fast SAR assessment and certification system for wireles device certification. 9 182 434. US Patent. 2015 Nov 10;
- 15.Kramer A, Müller P, Lott U, Kuster N, Bomholt F. Electro-optic fiber sensor for amplitude and phase detection of radio frequency electromagnetic fields. Opt Lett. 2006;31(16):2402–2404. doi: 10.1364/ol.31.002402. [DOI] [PubMed] [Google Scholar]
- 16.Togo H, Shimizu N, Nagatsuma T. Tip-on-fiber electro-optic probe for near-field measurement. NTT Technical Review. 2006 Jan; [Online]. Available: https://www.ntt-review.jp/archive/ntttechnical.php?contents=ntr200601012.pdf.
- 17.Togo H, Shimizu N, Nagatsuma T. Near-field mapping system using fiber-based electro-optic probe for specific absorption rate measurement. Antenna. 2007;E90-C(2):436–442. [Google Scholar]
- 18.Onishi T, Kiminami K, Iyama T. Proc 2008 IEEE AsiaPacific Symp Electromagnetic Compatibility and 19th Int Zurich Symp Electromagnetic Compatibility. Novel specific absorption rate measurement techniques; pp. 120–123. [Google Scholar]
- 19.Human Exposure to Radio Frequency Fields from Hand-Held and Body-Mounted Wireless Communication Devices—Human Models, Instrumentation, and Procedures—Part 2: Procedure to Determine the Specific Absorption Rate (SAR) for Wireless Communication. IEC Standard 62209–2; 2010. [Google Scholar]
- 20.Booysen AJ. Aperture theory and the equivalence principle. IEEE Antennas Propag Mag. 2003;45(3):29–40. [Google Scholar]
- 21.Okano Y. Proc 18th Int Zurich Symp Electromagnetic Compatibility, 2007. The comparison measurement for SAR by thermal evaluation and the electric field probe; pp. 147–150. [Google Scholar]
- 22.Okano Y, Sato T, Sugama Y. A specific absorption rate measurement method using fiber optic thermal sensors. IEEE Trans Instrum Meas. 2010 Jun;59(6):1705–1714. [Google Scholar]
- 23.Colombi D, Thors B, Törnevik C. Implications of EMF exposure limits on output power levels for 5G devices above 6 GHz. IEEE Antennas Wireless Propag Lett. 2015;14:1247–1249. [Google Scholar]
- 24.Cline H, Mallozzi R, Li Z, Mckinnon G, Barber W. Radiofrequency power deposition utilizing thermal imaging. Magn Reson Med. 2004;51:1129–1137. doi: 10.1002/mrm.20064. [DOI] [PubMed] [Google Scholar]
- 25.Alon L, Deniz CM, Brown R, Sodickson DK, Zhu Y. Method for in situ characterization of radiofrequency heating in parallel transmit MRI. Magn Reson Med. 2013;69:1457–1465. doi: 10.1002/mrm.24374. [DOI] [PMC free article] [PubMed] [Google Scholar]
- 26.Alon L, Cho GY, Greengard LF, Otazo R, Sodickson DK, Deniz CM. Calculation of 10g average SAR via inversion of the heat equation using MRI thermometry and thermal property measurements. Proc Int Society in Magnetic Resonance in Medicine. 2014:4902. [Google Scholar]
- 27.Wolfe WL, Zissis GJ, editors. The Infrared Handbook. Ann Arbor, MI: Environmental Research Institute of Michigan; 1985. [Google Scholar]
- 28.Alekseev SI, Ziskin MC. Influence of blood flow and millimeter wave exposure on skin temperature in different thermal models. Bioelectromagnetics. 2009;30(1):52–58. doi: 10.1002/bem.20444. [DOI] [PMC free article] [PubMed] [Google Scholar]
- 29.Alekseev SI, Ziskin MC, Fesenko EE. Problems of using a thermocouple for measurements of skin temperature rise during the exposure to millimeter waves. Biophysics. 2011;56(3):525–528. [PubMed] [Google Scholar]
- 30.Alon L, Slovinsky WS, Cho GY, Rappaport TS, Collins CM, Sodickson DK, Ziskin M, Deniz CM. mmWave exposure assessment using magnetic resonance thermal imaging. Proc Bioelectromagnetic Society Annu Meeting. 2015:B.147. [Google Scholar]
- 31.Chavannes N, Tay R, Nikoloski N, Kuster N. Suitability of FDTD-based TCAD tools RF design of mobile phones. IEEE Antennas Propag Mag. 2003;45(6):52–66. [Google Scholar]
- 32.Beg S, Gonzalez M, Davis C, Rzasa J. Measuring specific absorption rate of antennas placed near human body [Online] Available: http://www.ece.umd.edu/merit/archives/merit2010/merit_fair10_reports/report_Beg-Gonzalez.pdf.


