Abstract
T2-type RNases are responsible for self-pollen recognition and rejection in three distantly related families of flowering plants—the Solanaceae, Scrophulariaceae, and Rosaceae. We used phylogenetic analyses of 67 T2-type RNases together with information on intron number and position to determine whether the use of RNases for self-incompatibility in these families is homologous or convergent. All methods of phylogenetic reconstruction as well as patterns of variation in intron structure find that all self-incompatibility RNases along with non-S genes from only two taxa form a monophyletic clade. Several lines of evidence suggest that the best interpretation of this pattern is homology of self-incompatibility RNases from the Scrophulariaceae, Solanaceae, and Rosaceae. Because the most recent common ancestor of these three families is the ancestor of ≈75% of dicot families, our results indicate that RNase-based self-incompatibility was the ancestral state in the majority of dicots.
Multiallelic self-incompatibility systems prevent self-fertilization in many flowering plants. The molecular bases of self-incompatibility in three angiosperm families—the Brassicaceae, Papaveraceae, and Solanaceae—are all different (1–3), contradicting early speculation (4) that all self-incompatibility systems have a single origin. Nevertheless, three distantly related families—the Solanaceae, Scrophulariaceae, and Rosaceae—use T2-type RNases as the mechanism of self-pollen recognition and rejection (5–7). In this study we use an extensive plant T2-RNase database to determine whether use of self-incompatibility RNases (S-RNases) in these families is homologous or convergent.
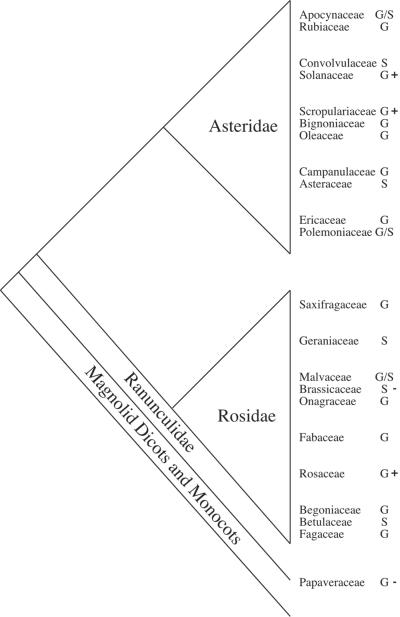
The Solanaceae and Scrophulariaceae belong to the subclass Asteridae whereas the Roasaceae are in the subclass Rosidae (Fig. 1). Homology of S-RNases would suggest that RNase-based gametophytic self-incompatibility (GSI) was present in the common ancestor of these subclasses, which together comprise roughly three-quarters of dicot families (8, 9). Moreover, a single origin would imply rampant losses of RNase-based GSI and several gains of other forms of incompatibility among higher dicots. Alternatively, polyphyletic relationships of extant S-RNases would represent a spectacular example of functional convergence.
Figure 1.
Relationships among selected dicots (modified from refs. 41 and 46). After each family the form of multiallelic self-incompatibility is indicated: G, gametophytic; S, sporophytic; +, use of S-RNases; −, use of alternative molecular mechanism. Lack of a sign indicates the mechanism of the incompatibility reaction is unknown.
Estimating the evolutionary relationships among S-RNases is difficult for several reasons. First, T2-type RNases are relatively short (≈650 bp of coding sequence), potentially providing limited information on relationships. Second, the time since divergence of the subclasses Asteridae and Rosidae is quite long, perhaps 110 million years (10). Finally, the strong negative frequency-dependent selection that operates on the S-locus is expected to cause extensive sequence divergence once the system originates (11). Thus, even if S-RNases arose separately in different groups, phylogenetic reconstructions might tend to unite them due to long-branch attraction (12), the tendency for methods of phylogenetic reconstruction to unite rapidly evolving taxa because of random homoplasies.
Previous analyses (7, 13, 14) found that S-RNases from the Scrophulariaceae and the Solanaceae likely share common ancestry, but the placement of S-RNases from the Rosaceae was uncertain. This finding is not surprising, as the Scrophulariaceae and Solanaceae share a more recent common ancestor (ref. 15; Fig. 1). The current analysis relies on a much more extensive database of T2-type RNases, uses intron number and position to corroborate groupings based on phylogenetic reconstruction of DNA sequence information, and applies recent methods of phylogenetic hypothesis testing to determine whether the use of S-RNase-based GSI represents homology.
Methods
Sequence Data.
We used two randomly selected sequences from each phylogenetic group described in ref. 14 as templates for tblastn and blastn (16) searches of GenBank (17) nr, month, and est_other databases. We relied primarily on two search strategies. First, we used entire sequences for searches using the BLOSUM62 matrix and gap costs 10, 1 (opening and extension, respectively). Second, we searched by using T2-RNase conserved regions 2 and 3 (14) as query sequences. These searches used the PAM30 matrix and gap costs 9, 1. In addition, we raised the expect value from the default value from 10 to 500 to reduce search stringency. We used sequences returned from initial searches as templates for further searches until no new sequences were obtained. All plant sequences with more than one of the characteristic conserved regions of T2-type RNases were retained.
The final dataset contained 67 plant T2-type RNases or related genes with no RNase function. To facilitate analysis by computationally intensive maximum-likelihood (ML) methods, we included only a sample of the many available sequences of S-alleles from the Solanaceae that have previously been shown to be monophyletic (14). In addition, “relic S-RNases” (18) known from the Solanaceae (e.g., Petunia inflata X2, Nicotiana alata MS1) were omitted. These are RNases clearly derived from S-RNases but do not function in self-incompatibility. Each of these genes groups closely with different S-RNases from the Solanaceae in phylogenetic reconstructions (14, 18), apparently having arisen through duplication of at least part of the S-locus (18). Omission of these genes to facilitate ML analysis should not affect our results given their derived positions in neighbor-joining (NJ) trees constructed before reducing the dataset to its final size (B.I., unpublished data). Eight full-length sequences representative of the diversity of the sequences found in the Solanaceae were used, along with the three available S-alleles from the Scophulariaceae and 16 from the Rosaceae.
We aligned amino acid sequences by using CLUSTALW 1.5 (19) and manually adjusted the alignment in SE-AL 1.0A1 (http://evolve.zoo.ox.ac.uk/software.html). The alignment begins at the 5′ end of the mature peptide (20), and sequences were terminated at the last conserved cysteine residue of S-RNases because excessive sequence divergence downstream of this site rendered the remaining sequence unalignable. The aligned amino acid sequences, roughly 210 residues in length, were used to create the DNA alignment. We omitted the third nucleotide (“wobble”) position of each codon from the dataset because extreme divergence among our sequences results in limited information potential of third position sites for resolving deep phylogenetic relationships and great potential for generating homoplasy. Analyses that include the third position agree with our findings. The sequence alignment and GenBank accessions used are available as supporting information on the PNAS web site, www.pnas.org.
Phylogenetic Analyses.
Aligned sequences were subjected to phylogenetic reconstruction by using the ML (21), NJ (22), and maximum-parsimony (MP; ref. 23) methods implemented in PAUP* 4.0B8 (24). We first used modeltest (25) to obtain the best-fit model of evolution. The optimal general time reversible (GTR) model, with its associated parameters, was used in phylogenetic reconstructions using the NJ and ML methods. The GTR model also provided a basis for weighting of nucleotide changes for MP analyses. We also applied the noise reduction option of the relative apparent synapomorphy analysis (rasa) package (http://bio.uml.edu/LW/RASA.html) to the data, including third position nucleotides, to generate a “noiseless” dataset (26). This dataset was also used to obtain unweighted NJ (NJ-RASA) and MP (MP-RASA) trees using paup* (24). Support for key nodes on the phylogenies was estimated with both nonparametric (27) and parametric bootstrap methods (28–31). Finally, we applied the taxon variance ratio analysis from rasa (25) to assess whether any sequences within the dataset were particularly susceptible to long-branch attraction (32).
Intron Data.
When genomic sequences were available, we compared them to corresponding cDNAs to identify the number and position of all introns. For key sequences from Pisum sativum and Luffa cylindrica (see below) for which only cDNA sequences were available, we designed primers to amplify genomic sequences and determine intron number and position. DNA from leaf samples of L. cylindrica and P. sativum was extracted by using a Dneasy Plant Minikit (Qiagen, Chatsworth, CA) and amplified by using primers devised from cDNAs. Amplification products were sequenced with both forward and reverse primers using the ABI 3100 sequencer (Applied Biosystems) at the University of California-San Diego Cancer Center. We used intron presence/absence information as corroborating evidence to reinforce phylogenetic hypotheses derived from coding sequence variation. The utility of intron states for resolving relationships has been previously reported in plant T2-type RNases (20, 33) and other genes (34–36).
Results
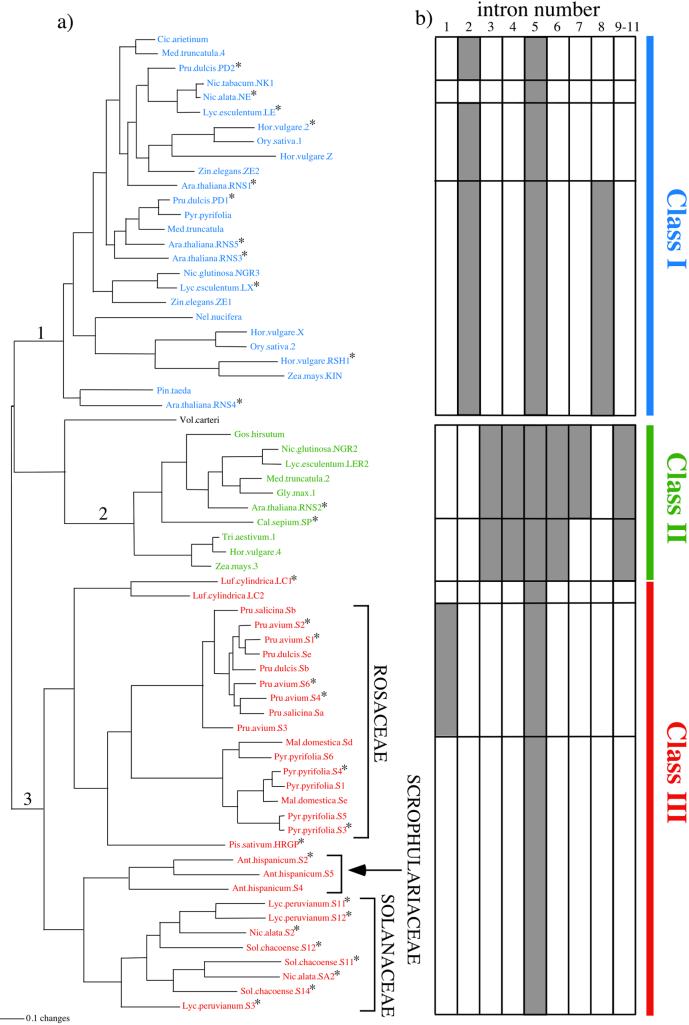
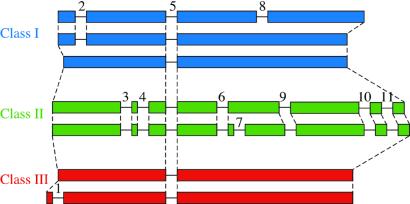
Plant T2-type RNases group into three major classes (Fig. 2a). Class I contains non-S-RNases from many higher plants, often present in two or more copies. Sequences in this clade typically contain two or three introns, with the exception of Nicotiana alata NE that has only one. Class II comprises the single-copy gene RNS2 from Arabidopsis thaliana and many apparently orthologous genes from other angiosperms. To date, no more than one member of this clade has been recovered from any diploid species. Class II RNases contain a unique sequence motif (two pairs of double cysteine residues) near the 5′ end. Although genomic DNA sequences are available from only two genes in this clade, they represent one sequence from the Rosidae (Arabidopsis thaliana RNS2) and one from the Asteridae (Calystegia sepium SP). Both have many introns—seven in C. sepium SP, and those seven plus an additional intron in A. thaliana RNS2 (Fig. 3). S-RNases from the Rosaceae, Scrophulariaceae, and Solanaceae, along with the non-S genes from L. cylindrica (LC1, LC2; Cucurbitaceae) and Pisum sativum HRGP (hydroxyproline-rich glycoprotein; Fabaceae) form the third monophyletic group (class III).
Figure 2.
(a) ML phylogeny of plant T2-type RNases. Nonparametric bootstrap support for nodes 1–3 is in Table 1. Ant., Antirrhinum; Ara., Arabidopsis; Cal., Calystegia; Cic., Cicer; Hor., Hordeum; Luf., Luffa; Lyc., Lycopersicon; Mal., Malus; Med., Medicago; Nel., Nelumbo; Nic., Nicotiana; Ory., Oryza; Pin., Pinus; Pis., Pisum; Pru., Prunus; Pyr., Pyrus; Sol., Solanum; Tri., Triticum; Vol., Volvox; Zea., Zea; Zin., Zinnia. * indicate genes for which intron structure information was obtained. (b) Patterns of intron presence/absence. Boxes indicate the presence (shaded) or absence (unshaded) of introns as numbered in Fig. 3.
Figure 3.
Intron structure of plant T2-type RNases. Boxes represent exons, lines are introns (not to scale). Dashed lines connect homologous regions. Introns are numbered from 5′ to 3′.
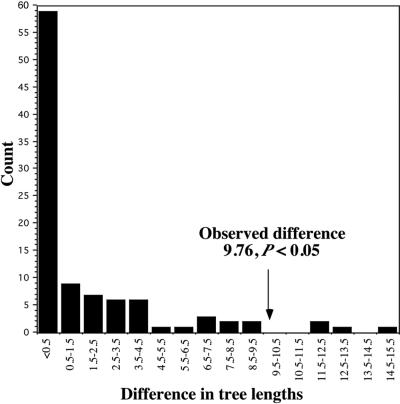
Several lines of evidence support the monophyly of class III genes. First, phylogenetic estimates using multiple methods (ML, NJ, MP, NJ-RASA, and MP-RASA) recover similar results (Fig. 2, Table 1). Although this clade receives only moderate nonparametric bootstrap support (Table 1), the nonparametric bootstrap is often conservative particularly when applied to deep phylogenetic nodes (37). The parametric bootstrap, however, rejects the alternative hypothesis of nonmonophyly of class III genes (Fig. 4, P = 0.04).
Table 1.
Non-parametric bootstrap support for nodes 1, 2, and 3 (see Fig. 2a), under various methods of phylogenetic reconstruction
| Method | Number of bootstraps | Percent support of node
|
||
|---|---|---|---|---|
| 1 | 2 | 3 | ||
| MP | 400 | <50 | 100 | 68 |
| NJ | 1,000 | 94 | 100 | 70 |
| MP-RASA | 400 | 73 | 90 | 77 |
| NJ-RASA | 1,000 | 86 | 98 | 56 |
MP, MP using character transition weightings from the best-fit general time reversible model; NJ, NJ using the best-fit general time reversible model; MP-RASA, unweighted parsimony on RASA-reduced data; NJ-RASA, unweighted NJ (uncorrected “p”) on RASA-reduced data.
Figure 4.
Parametric bootstrap (28–31) results for the hypothesis that nonmonophyly of class III RNases is consistent with the observed data. One hundred sets of DNA sequence data were generated by using seq-gen (47) to match the ML topology found under the constraint that class III RNases were nonmonophyletic. For each replicate, we subtracted the length of the shortest constrained MP tree from the length of the shortest unconstrained MP tree. The distribution of differences was compared with the difference between shortest unconstrained and constrained trees by using the empirical data. A difference as great or greater than that observed was found in only 4% of simulated datasets.
In addition, intron presence/absence data show a remarkable congruence with the recovered topology. All members of class III have only the single intron common to all T2-type plant RNases with the exception of S-alleles from the genus Prunus (Rosaceae, subfamily Amygdaloideae). Prunus S-alleles have an additional intron, the only intron in T2-type RNases located upstream of the first highly conserved region (Figs. 2b and 3). Because of the derived position of Prunus S-alleles among class III genes (Fig. 2a), we infer that this intron represents an autapomorphy. With only one exception (N. alata NE), all other plant T2-type RNases have two or more introns. The coding sequence of RNase NE from Nicotiana alata is closely related to that of RNase LE from the confamilial species Lycopersicon esculentum, which has two introns, a state more typical among class I genes. Therefore we infer that the single-intron state of RNase NE is convergent on that found in class III sequences.
Taxon variance ratios from rasa ranged from 9.4 to 12.3. The relative homogeneity of values indicates that no sequences or groups of sequences in the dataset were particularly prone to long-branch effects (J. Lyons-Weiler, personal communication; ref. 32). Taxon variance ratios for S-RNases and non-S RNases were similar.
Discussion
All S-RNases, together with the non-S genes from Pisum and Luffa, form a single clade, as characterized by phylogenetic analyses of sequence data and similarity in intron number and position. This finding implies either parallel gains of RNase-based GSI from the ancestral class III RNases or homology of RNase-based GSI in core eudicots. We favor the latter hypothesis for several reasons.
First, as long as the loss of incompatibility is more likely than its gain (a reasonable assumption given the complexity of GSI and the propensity for its loss in families that contain it), then a single gain is the most parsimonious interpretation of our phylogeny. Second, P. sativum HRGP is a most unlikely ancestor of the S-RNases from the Rosaceae. This gene has no RNase activity and is thought to be a gene of hybrid origin involved in the regulation of DNA replication in the chloroplast (38). It contains a polyproline 5′ motif common in hydroxyproline-rich glycoproteins, whereas the 3′ portion of the protein resembles T2-RNases and contains their signature conserved regions. The L. cylindrica genes, also known to occur in Momordica charantia (Cucurbitaceae), are expressed in seeds and are hypothesized to be involved in seed protection from pathogens. Although a resistance function might make these genes more likely candidates for the ancestor of the S-locus (39), this function is speculative and their cellular localization is unknown (40).
Finally, the Luffa and Pisum genes are currently the only non-S class III genes in GenBank. No molecular homologs of the Luffa genes have been found outside of the Cucurbitaceae. A Northern blot survey of various angiosperms (38) failed to produce a molecular homolog of P. sativum HRGP, indicating that this copy is possibly unique to P. sativum and its relatives. The published A. thaliana genome (41) contains five T2-type RNases, none of which belong to class III. Large-scale expressed sequence tag studies of diverse taxa (e.g., Lycopersicon esculentum, Medicago truncatula, Hordeum vulgare) also fail to contribute any members to class III. Although it is currently impossible to verify that non-S class III genes are absent from most dicot genomes, we see no reason the present database would be biased against their discovery in favor of low-copy class II genes that are known from a wide variety of angiosperms (Fig. 2a).
If the S-RNases from the Asteridae and Rosidae had separate origins, we would expect to find ancestral non-S class III genes among Asteridae. Conversely, under the single-origin hypothesis, multiple losses of incompatibility must have occurred because of the many absences of GSI in higher dicots. If loss of incompatibility was unaccompanied by a change of function, nonfunctional S-RNases would be mutated beyond recognition over evolutionary time. Therefore, under the single-origin hypothesis, we expect few extant homologs in groups not using S-RNase-based GSI. We hypothesize that the class III genes from Luffa and Pisum represent rare changes of function from a shared ancestral S-RNase.
Similarity in intron presence/absence of class III RNases provides evidence against long-branch attraction as the cause of the association of all S-RNases. In addition, the taxon variance ratio test of RASA found that groups of S-RNases from different families were no more susceptible to long-branch attraction than were other groups of RNases. If long branches were causing spurious phylogenetic associations, there is no reason S-RNases would consistently join one another.
Homology of S-RNases has many important implications. For example, it implies that the common ancestor of the Asteridae and Rosidae, the ancestor of ≈75% of all dicots, possessed RNase-based GSI. Many families of higher dicots exhibit GSI of unknown molecular basis (41). Given homology of the RNase-based GSI, this system could be much more widespread than is presently appreciated. In addition, self-incompatibility has been hypothesized to be a key feature that allowed the diversification and dominance of the angiosperms (4, 42). Testing the hypothesis that self-incompatibility facilitates diversification has proven difficult because of the poor reporting of self-incompatibility as a character and difficulties in accurate reconstruction of ancestral character states (43–45). The present analysis implies the presence of RNase-based GSI before the diversification of most dicots.
Supplementary Material
Acknowledgments
We thank T. Wehner for providing seed of L. cylindrica and R. Doolittle, D. Tank, R. Glor, J. R. Macey, D. Weisrock, B. Emerson, J. Lyons-Weiler, and A. Rambaut for help with phylogenetic analyses. A. Angert, M. Streisfeld, and two anonymous reviewers offered suggestions that significantly improved the manuscript. This work was supported by National Science Foundation Awards DEB-9527834 and DEB-0108173 (to J.R.K).
Abbreviations
- S-RNase
self-incompatibility RNase
- GSI
gametophytic self-incompatibility
- MP
maximum parsimony
- NJ
neighbor joining
- ML
maximum likelihood
- RASA
relative apparent synapomorphy analysis
Note Added in Proof.
A similar phylogenetic conclusion recently has been reached by J. Steinbachs and K. E. Holsinger by using a Bayesian approach (unpublished work).
Footnotes
This paper was submitted directly (Track II) to the PNAS office.
References
- 1.Nasrallah J B, Kao T-H, Goldberg M L, Nasrallah M E. Nature (London) 1985;318:263–267. [Google Scholar]
- 2.Anderson M A, Cornish E C, Mau S-L, Williams E G, Hogart R, Atkinson A, Bonig I, Grego B, Simpson R, Roche R J, et al. Nature (London) 1986;321:38–44. [Google Scholar]
- 3.Foote H, Ride J P, Franklin-Tong V E, Walker E A, Lawrence M J, Franklin F C. Proc Natl Acad Sci USA. 1994;91:2265–2269. doi: 10.1073/pnas.91.6.2265. [DOI] [PMC free article] [PubMed] [Google Scholar]
- 4.Whitehouse H L K. Ann Bot. 1950;14:198–216. [Google Scholar]
- 5.McClure B A, Haring V, Ebert P R, Anderson M A, Simpson R J, Sakiyama F, Clarke A E. Nature (London) 1989;342:955–957. doi: 10.1038/342955a0. [DOI] [PubMed] [Google Scholar]
- 6.Sassa H, Hirano H, Ikehashi H. Plant Cell Physiol. 1992;33:811–814. [Google Scholar]
- 7.Xue Y, Carpenter R, Dickinson H G, Coen E S. Plant Cell. 1996;8:805–814. doi: 10.1105/tpc.8.5.805. [DOI] [PMC free article] [PubMed] [Google Scholar]
- 8.Cronquist A. An Integrated System of Classification of Flowering Plants. New York: Columbia Univ. Press; 1981. [Google Scholar]
- 9.Chase M W, Soltis D E, Olmstead R G, Morgan D, Les D H, Mishler B D, Duvall M R, Price R A, Hills H G, Qiu Y L, et al. Ann Mo Bot Gard. 1993;80:528–580. [Google Scholar]
- 10.Crane P R, Friis E M, Pederson K R. Nature (London) 1995;374:27–33. [Google Scholar]
- 11.Clark A G. In: Mechanisms of Molecular Evolution. Takahata N, Clark A G, editors. Sunderland, MA: Sinauer; 1993. pp. 79–108. [Google Scholar]
- 12.Felsenstein J. Syst Zool. 1978;27:401–410. [Google Scholar]
- 13.Sassa H, Nishio T, Kowyama Y, Hisashi H, Koba T, Ikehashi H. Mol Gen Genet. 1996;250:547–557. doi: 10.1007/BF02174443. [DOI] [PubMed] [Google Scholar]
- 14.Richman A D, Broothaerts W, Kohn J R. Am J Bot. 1997;84:912–917. [PubMed] [Google Scholar]
- 15.Angiosperm Phylogeny Group. Ann Mo Bot Gard. 1998;85:531–553. [Google Scholar]
- 16.Altschul S F, Madden T L, Schäffer A A, Zhang J, Zhang Z, Miller W, Lipman D J. Nucleic Acids Res. 1997;25:3389–3402. doi: 10.1093/nar/25.17.3389. [DOI] [PMC free article] [PubMed] [Google Scholar]
- 17.Benson D A, Boguski M S, Lipman D J, Ostell J, Ouellette B F. Nucleic Acids Res. 1998;26:1–7. doi: 10.1093/nar/26.1.1. [DOI] [PMC free article] [PubMed] [Google Scholar]
- 18.Golz J F, Clarke A E, Newbigin E, Anderson M. Plant J. 1998;16:591–599. doi: 10.1046/j.1365-313x.1998.00331.x. [DOI] [PubMed] [Google Scholar]
- 19.Thompson J D, Higgins D G, Gibson T J. Nucleic Acids Res. 1994;22:4673–4680. doi: 10.1093/nar/22.22.4673. [DOI] [PMC free article] [PubMed] [Google Scholar]
- 20.Gausing K. Planta. 2000;210:574–579. doi: 10.1007/s004250050046. [DOI] [PubMed] [Google Scholar]
- 21.Felsenstein J. J Mol Evol. 1981;17:368–376. doi: 10.1007/BF01734359. [DOI] [PubMed] [Google Scholar]
- 22.Saitou N, Nei M. Mol Biol Evol. 1987;4:406–425. doi: 10.1093/oxfordjournals.molbev.a040454. [DOI] [PubMed] [Google Scholar]
- 23.Swofford D L, Olsen G J, Waddell P J, Hillis D M. In: Molecular Systematics. 2nd Ed. Hillis D M, Moritz C, Mable B K, editors. Sunderland, MA: Sinauer; 1996. pp. 407–514. [Google Scholar]
- 24.Swofford D L. PAUP*: Phylogenetic Analysis Using Parsimony (*and Other Methods) Sunderland, MA: Sinauer; 2001. , Version 4. [Google Scholar]
- 25.Posada D, Crandall K A. Bioinformatics. 1998;14:817–818. doi: 10.1093/bioinformatics/14.9.817. [DOI] [PubMed] [Google Scholar]
- 26.Lyons-Weiler J, Hoelzer G A, Tausch R J. Mol Biol Evol. 1996;13:749–757. doi: 10.1093/oxfordjournals.molbev.a025635. [DOI] [PubMed] [Google Scholar]
- 27.Felsenstein J. Evolution (Lawrence, Kans) 1985;39:783–791. doi: 10.1111/j.1558-5646.1985.tb00420.x. [DOI] [PubMed] [Google Scholar]
- 28.Efron B. Biometrika. 1985;72:45–58. [Google Scholar]
- 29.Huelsenbeck J P, Hillis D M, Jones R. In: Molecular Zoology: Advances, Strategies, and Protocols. Ferraris J D, Palumbi S R, editors. New York: Wiley; 1996. pp. 19–45. [Google Scholar]
- 30.Huelsenbeck J P, Hillis D M, Nielsen R. Syst Biol. 1996;45:546–558. [Google Scholar]
- 31.Ruedi M, Auberson M, Savolainen V. Mol Phylogenet Evol. 1998;9:567–571. doi: 10.1006/mpev.1998.0487. [DOI] [PubMed] [Google Scholar]
- 32.Lyons-Weiler J, Hoelzer G A. Mol Phylogenet Evol. 1997;8:375–384. doi: 10.1006/mpev.1997.0450. [DOI] [PubMed] [Google Scholar]
- 33.Ma R-C, Oliveira M M. Mol Gen Genet. 2000;263:925–933. doi: 10.1007/s004380000258. [DOI] [PubMed] [Google Scholar]
- 34.Sahrawy M, Hecht V, Lopezjaramillo J, Chueca A, Chartier Y, Meyer Y. J Mol Evol. 1996;42:422–431. doi: 10.1007/BF02498636. [DOI] [PubMed] [Google Scholar]
- 35.Venkatesh B, Ning Y, Brenner S. Proc Natl Acad Sci USA. 1999;96:10267–10271. doi: 10.1073/pnas.96.18.10267. [DOI] [PMC free article] [PubMed] [Google Scholar]
- 36.Rokas A, Holland P W H. Trends Ecol Evol. 2000;15:454–459. doi: 10.1016/s0169-5347(00)01967-4. [DOI] [PubMed] [Google Scholar]
- 37.Hillis D M, Bull J J. Syst Biol. 1993;42:182–192. [Google Scholar]
- 38.Gaikwad A, Tewari K K, Kumar D, Chen W, Mukherjee S K. Nucleic Acids Res. 1999;27:3120–3129. doi: 10.1093/nar/27.15.3120. [DOI] [PMC free article] [PubMed] [Google Scholar]
- 39.Singh A, Kao T-H. Int Rev Cytol. 1992;140:449–482. doi: 10.1016/s0074-7696(08)61106-7. [DOI] [PubMed] [Google Scholar]
- 40.Parry S K, Liu Y-H, Clarke A E, Newbigin E. In: Ribonucleases: Structures and Functions. D'Alessio G, Riordan J F, editors. San Diego: Academic; 1997. pp. 191–211. [Google Scholar]
- 41.Holsinger K E, Steinbachs J E. In: Evolution and Diversification of Flowering Plants. Iwatsuki K, Raven P H, editors. Tokyo: Springer; 1997. pp. 223–248. [Google Scholar]
- 42.Zavada M S, Taylor T N. Am Nat. 1988;128:538–550. [Google Scholar]
- 43.Charlesworth D. In: Evolution: Essays in Honor of John Maynard Smith. Greenwood P J, Harvey P H, Slatkin M, editors. Cambridge: Cambridge Univ. Press; 1985. pp. 237–268. [Google Scholar]
- 44.Weller S G, Donoghue M J, Charlesworth D. In: Experimental and Molecular Approaches to Plant Biosystematics. Hoch P C, Stephenson A G, editors. St. Louis: Missouri Botanical Garden; 1995. pp. 355–382. [Google Scholar]
- 45.Heilbuth J C. Am Nat. 2000;156:221–224. doi: 10.1086/303389. [DOI] [PubMed] [Google Scholar]
- 46.Matton D P, Nass N, Clarke A E, Newbigin E. Proc Natl Acad Sci USA. 1993;91:1992–1997. doi: 10.1073/pnas.91.6.1992. [DOI] [PMC free article] [PubMed] [Google Scholar]
- 47.Rambaut A, Grassly N C. Comput Appl Biosci. 1997;13:235–238. doi: 10.1093/bioinformatics/13.3.235. [DOI] [PubMed] [Google Scholar]
Associated Data
This section collects any data citations, data availability statements, or supplementary materials included in this article.


