

Summary
Sex impacts on liver physiology with severe consequences for energy metabolism and response to xenobiotic, hepatic, and extra-hepatic diseases. The comprehension of the biology subtending sex-related hepatic differences is therefore very relevant in the medical, pharmacological, and dietary perspective. The extensive application of metabolomics paired to transcriptomics here shows that, in the case of short-term fasting, the decision to maintain lipid synthesis using amino acids (aa) as a source of fuel is the key discriminant for the hepatic metabolism of male and female mice. Pharmacological and genetic interventions indicate that the hepatic estrogen receptor (ERα) has a key role in this sex-related strategy that is primed around birth by the aromatase-dependent conversion of testosterone into estradiol. This energy partition strategy, possibly the result of an evolutionary pressure enabling mammals to tailor their reproductive capacities to nutritional status, is most important to direct future sex-specific dietary and medical interventions.
Keywords: liver, sex differences, metabolism, amino acids, lipids, estrogen receptor alpha, reproduction, transcriptome, metabolome
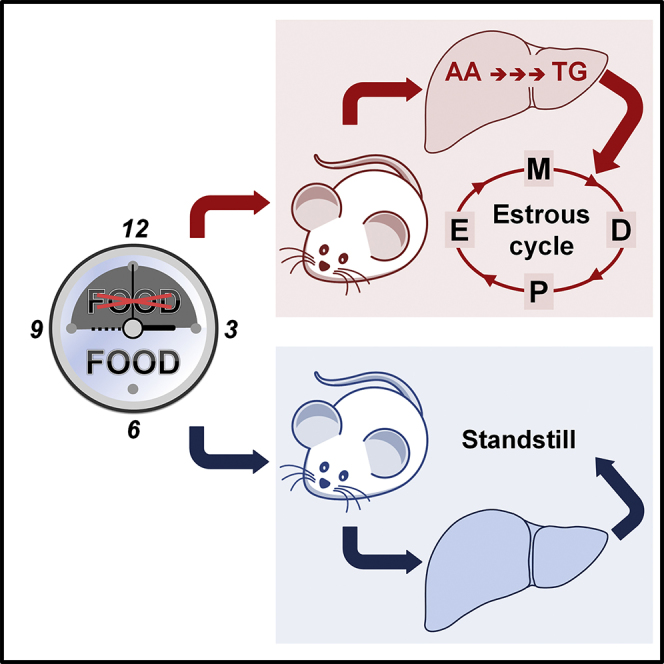
Graphical Abstract
Highlights
-
•
Omics profiling of liver metabolism reveals a sex-biased response to a short fast
-
•
Female mice, unlike males, use amino acids to increase energy deposits in the liver
-
•
Estrogen signaling in neonates in fact masculinizes liver metabolism
-
•
Hepatic ERα plays a key role in the maintenance of a sex-specific metabolism
Della Torre et al. show a major sex difference in the hepatic response to short-term fasting: females maintain the synthesis of energy storage molecules (lipids) at the expense of amino acids, and males simply slow down anabolic pathways. The mechanism is mediated by liver estrogen receptor alpha.
Introduction
The liver appears to be one of the organs functionally most affected by sex, and increasing evidence shows fundamental differences in the utilization of lipids and carbohydrates as a source of fuel in male and female mammals (Mauvais-Jarvis, 2015). The current paradigm is that at rest females tend to synthesize fatty acids (FAs) and triglycerides (TGs) to be stored as fat, and in contrast, males oxidize FAs; during exercise, women, in overt opposition to men, were reported to utilize more lipids than carbohydrates (Horton et al., 1998, Mauvais-Jarvis, 2015, Uranga et al., 2005). This strategy in energy partitioning was proposed to be a consequence of the respective sexual role. Females would be able to stock the energy necessary to maintain the reproductive capacities during periods of limited food shortage and, in due time, to spare the glucose and proteins necessary for the growth of the fetus by mobilizing the energy stores. In males it would provide a large source of energy for muscle activity (Mauvais-Jarvis, 2015).
These physiological differences impact significantly on the sex prevalence of hepatic and extra-hepatic diseases such as fatty liver and non-alcoholic fatty liver disease, metabolic syndrome, atherosclerosis, diabetes, and others that are more predominant in men (Arnold et al., 2017, Ayonrinde et al., 2011, Della Torre et al., 2014, Della Torre and Maggi, 2017, Kautzky-Willer et al., 2016, Mauvais-Jarvis, 2015, Regitz-Zagrosek and Kararigas, 2017, Spence and Pilote, 2015); because of that, sex metabolic differences would deserve a better understanding of the underlying molecular mechanisms that remain largely unidentified. Indeed, initial studies that applied the power of transcriptomics and genetics further stressed male-female differential use of lipids and carbohydrates and pinpointed some of the molecular pathways involved. The transcriptomic profiling and biochemical analyses in rodents indicated that about 10% of the transcriptionally active genes in the liver have a sex-dependent expression; transcripts for the synthesis of triglycerides, cholesterol, and very-low-density lipoprotein (VLDL) particles were more expressed in females while genes for FA oxidation, gluconeogenesis, and glycogen synthesis were predominant in males, further stressing the tendency of females to privilege lipid synthesis and males to create large glycogen stores (Hagve and Christophersen, 1986, Ivey and Gaesser, 1987, Kushlan et al., 1981, Lorbek et al., 2013, Mauvais-Jarvis, 2015, Price and Sanders, 2017, Tarnopolsky and Ruby, 2001). Experiments done with mutants of PPARα (the master regulator of FA oxidation) showed that in PPARα−/− mice the pharmacological inhibition of FA oxidation leads to lipid accumulation and death for hypoglycemia mainly in males, while only 25% of females undergoing the same treatment die because of their major ability to oxidize FAs even in the absence of the PPARα receptor (Djouadi et al., 1998).
Very little is known with regard to protein metabolism in the liver and to the existence of sex-dependent mechanisms controlling amino acid (aa) utilization in the overall energy production by hepatic cells. Yet, hepatic aa appear to be deeply involved in female reproductive physiology. In fact, aa were described to play a major role in the maintenance of the reproductive cycle and fertility (Della Torre et al., 2011) and the liver massif oxidation of aa in the initial phases of pregnancy is associated with the production of lipids to be accumulated in the maternal fat stores; in late pregnancy, the liver is responsible for the shift from the anabolic to a catabolic state that promotes the use of lipids as a maternal energy source while preserving glucose and aa for the fetus (Butte, 2000). In addition, our previous observations showed that female liver metabolism is highly influenced by the activity of hepatic ERα and that, together with estrogens, aa are able to activate transcriptionally ERα, suggesting that also aa intracellular signaling may play a role in differentiating the physiological activities of female and male livers (Della Torre et al., 2011).
The aim of our study was therefore to exploit the combined power of metabolomics and transcriptomics to get a comprehensive insight on male and female liver metabolic strategies. Our results here show a major sexual dimorphism in the use of aa as source of fuel for the production of lipids. Interestingly, in both males and females the hepatic ERα plays a key role in such a selection; in females, the lack of ERα expression reduces significantly the use of aa as a source for lipid synthesis and the production of NADPH through the pentose phosphate pathway (PPP), while the opposite is true in males where the ERα represents a break for the use of aa to feed the tricarboxylic acid cycle (TCA). These sex-specific metabolic features appear to be imprinted around birth and are not observed in muscle and adipose tissues.
Results
Liver Transcriptome Profiling Reveals a Sex-Biased Response to Short-Term Fasting
Prior experimentation demonstrated that, in female mammals, the phase of the estrous cycle has a significant impact on liver transcriptome (Della Torre et al., 2016, Villa et al., 2012), therefore the initial comparative study was carried out in females in two phases of the cycle characterized by high and low circulating estrogens (proestrus, P, and metestrus, M, respectively). All experiments were done with littermates and mice were euthanized after 6 hr of fasting, because it is known that food intake activates the hepatic estrogen receptor transcriptionally (Della Torre et al., 2011).
By considering a fold change > 1.5 and a false discovery rate < 0.01 we found that the sex-dependent differential expression engaged 1,120 genes with females at M and 859 at P. Of relevance, only 497 (<35%) were in common between P and M (Figure S1A). We next examined the extent of expression of the differentially regulated genes (DEGs) and, once more, the greatest differences were observed between males and females at M (Figure S1B). These findings led us to continue the study with females at M.
The male/female-M comparative study indicated that 8.7% of all the genes expressed in the liver was sexually differentiated; out of those, 5.2% of the genes was upregulated in females and 3.5% in males (Figures 1A and 1B). Cluster analysis of the networks related to the DEGs showed that the large majority of the genes upregulated in males was associated with the inhibition of gluconeogenesis, while fewer genes were encoding proteins for the regulation of nucleic acid and protein catabolism (Figure 1C). Conversely, the effect of fasting appeared to be very different in females where we found the upregulated genes involved in a large variety of metabolic pathways (Figure 1D).
Figure 1.

Liver Transcriptome Shows a Sex-Specific Metabolic Response to Short-Term Fasting
(A) Sexually dimorphic gene expression obtained by RNA sequencing (RNA-seq) analysis performed in the liver of males and females at metestrus (M) (fold change, |FC| > 1.5 and false discovery rate [FDR] < 0.01).
(B) Volcano plot of all detectable genes: female/male ratio of gene expression (FC) is shown on the x axis as Log2 and significance is displayed on the y axis as −Log10 of the adjusted FDR. Genes with significantly upregulated expression in males and females are colored in blue and red, respectively; genes without gender bias are displayed in gray.
(C and D) Cluster analysis of functional networks significantly enriched in the liver of males (C) and females at M (D). Only the most significant term per group is labeled.
(E–G) Heatmaps reporting as Log2 fold change the expression of genes involved in glycolysis (Glyc), gluconeogenesis (Gluc), PPP, and TCA (E), FA and TG synthesis (F), and aa metabolism and aa transport (G) from RNA-seq analysis performed in the livers of males and females at M. Only genes with an FDR < 0.05 are considered.
A more detailed analysis based on the most relevant metabolic pathways indicated that, in female liver, there was an upregulation of specific mRNAs encoding enzymes for the gluconeogenesis, PPP and TCA (Figure 1E), and a strong overexpression of mRNAs for the synthesis of FAs and TGs (Figure 1F). In line with a metabolism geared toward lipid synthesis, we found that several of the mRNAs associated with the negative regulation of gluconeogenesis and lipogenesis were significantly less expressed in females (Figure S1C). At the same time, in the female group we observed higher expression of genes encoding enzymes for amino acid (aa) metabolism, transport (Figure 1G) and detoxification (urea cycle) (Figure S1D), with lower amounts of protease and peptidase inhibitors (Figure S1E). These findings suggested that, in response to a mild fasting females, unlike males, synthesized lipids, possibly by depleting the proteins present in the liver.
Liver, but Not Fat and Muscle, Shows a Sexually Dimorphic Response to a Short-Time Fasting
To better understand the physiological relevance of the sex-related differences found, we proceeded with the quantitative measurement of the biologically most relevant metabolites present in the liver. In keeping with the transcriptomic study, the heatmap of liver metabolites (Figure 2A) pointed to major metabolic differences in the two sexes, further highlighted by principal-component analysis (PCA) (Figure 2B). In particular, in female liver we found a higher content of selected metabolites of the glycolytic/gluconeogenic pathways (glucose-6-phosphate and pyruvate), PPP (ribulose-5-phosphate and erythrose 4-phosphate), TCA cycle (citrate, α-ketoglutarate, fumarate, and malate), and lipogenesis (malonyl-CoA) (Figures 2C, 2D, and S2A; Table S1). The higher content of malonyl-CoA, together with the remarkable expression of the lipogenic genes (Figure 1F), the lower NADP+/NADPH ratio, and the higher energy charge values (Figures 2E and S2B), suggested that females favored lipid synthesis. The measurement of liver TGs confirmed such a hypothesis showing that the content of TGs in female liver was higher than in males (+150%; Figure S2C). Finally, the low aa content reinforced the findings of the transcriptomics that suggested the use of aa to sustain the TCA cycle anaplerosis (Figures 2F and S2A) in the absence of increased FA oxidation as highlighted by acyl-carnitine levels (Figure 2G). Unsupervised bioinformatics studies based on metabolomics pathway and fold enrichment analysis (Figures S2D–S2F), together with the integrated analysis of transcriptomic and metabolomic data (Figures S2G–S2I), further indicated that female liver preferentially used aa to synthetize lipids even if under a short-time fasting. All these data suggested the existence of a sex-specific strategy for the regulation of liver metabolism in case of a starvation limited in time: male livers were still in a steady state, while females were engaged in aa utilization to fuel the TCA cycle and gluconeogenesis, and to ensure the production of lipids.
Figure 2.

Metabolic Profiling Shows Female Propensity to Use aa to Synthesize Lipids in Short-Time Fasting
(A) Hierarchical clustering heatmap of biologically major metabolites of the Glyc/Gluc, PPP, TCA, energy metabolism (En. Met.), aa, and acyl-carnitines (Acyl-Carn) measured in the liver of males (left, marked by the blue bar) and of females at M (right, marked by red bar). The color-coded scale on the left indicates the normalized metabolite expression.
(B) Score plot of a principal-component analysis (PCA) of the data shown in (A) done using MetaboAnalyst 3.0 software. Colored ellipses represent 95% confidence intervals and highlight the basic clustering/separation between groups. Colored dots represent individual samples (n = 6).
(C–E) Quantitative analysis of liver metabolites belonging to Glyc/Gluc and PPP (C), TCA (D), and energy metabolism (E). Bars are mean ± SEM (n = 6). ∗p < 0.05, ∗∗p < 0.01, ∗∗∗p < 0.001 by t test.
(F and G) aa (F) and acyl-carnitines (G) quantitative analysis in the liver of males and females at M. Bars are mean ± SEM (n = 6). ∗p < 0.05, ∗∗p < 0.01 by t test.
The question to be raised at this point was to which extent the sex differences observed were a peculiarity of the liver or represented a general feature of female metabolism. This led us to extend our investigation to the other major metabolic organs: muscle and white adipose tissue (WAT). The heatmap profiles showed in Figures 3A and 3C indicated that in the two sexes both muscle and WAT had reacted very similarly to the short-time fasting. The hierarchical clustering of the 12 animals studied (six females and six males) did not enable to group each metabolic profile with regard to sex and the PCA analyses gave patterns largely overlapping in the two sexes (Figures 3B and 3D). These observations demonstrated the absence of a sex-related control mechanism of muscle and adipose metabolism that could be triggered by our experimental conditions.
Figure 3.

Male and Female Mice Have a Very Similar Muscle and WAT Metabolic Profile
(A and B) Hierarchical clustering heatmap (A) and score plot of PCA (B) of muscle from males and females at M (n = 6).
(C and D) Hierarchical clustering heatmap (C) and score plot of PCA (D) of white adipose tissue (WAT) from males and females at M (n = 6).
(E and F) Hierarchical clustering heatmap (E) and score plot of PCA (F) of the reproductive tissues from males (testis) and females at M (ovary) (n = 6).
Conversely, metabolite analysis in male and female gonads and their hierarchical clustering showed well-distinguished metabolic profiles. Compared with male (testis), female gonads (ovary) were characterized by the low content of metabolites of the glycolytic/gluconeogenic pathways and aa metabolites and a large content of acyl-carnitines, possibly indicating that also in the gonads female metabolism is geared toward aa utilization, while males tend to spare these substrates (Figure 3E). This sex-specific metabolism was further emphasized by PCA, which discriminated very well the data obtained in ovaries and testes (Figure 3F).
Thus, among the investigated organs not strictly responsible for reproductive functions, the liver appeared to have a unique ability to respond to the selected metabolic challenge in a sex-differentiated manner, and this led us to further investigate whether such a sexual identity was fixed during development.
Is the Liver a Sexually Differentiated Organ?
In mammals sexual differentiation initiates during embryo development and continues until after puberty driven by a combination of genetic and hormonal events. Early in embryogenesis, the product of the sex-determining gene (Sry) in the Y chromosome leads to the differentiation of male gonads. Following that, there is a perinatal surge of testicular activity (in rodents the first testosterone surge is in the late gestational period and the second peak occurs at the immediate postnatal time) (Corbier et al., 1992, Konkle and McCarthy, 2011, Clarkson and Herbison, 2016) responsible for the induction of the so-called organizational effects that predispose tissues other than the gonads to be “activated” at puberty by sex hormones (Mauvais-Jarvis et al., 2017). This phenomenon is well described and explains the changes driving the secondary sex characteristics. This organizational effect has been largely investigated in the brain where the high content of aromatase was described to convert circulating testosterone into estradiol; this latter hormone is responsible for the “masculinization” of neural circuits that become permissive to the activation of male functions and behaviors at puberty (Arnold and Gorski, 1984, Gorski and Wagner, 1965).
On this background knowledge, we asked whether such testosterone/estradiol-induced differentiation occurred also in the liver and we set up a series of experiments aimed at testing this hypothesis. First, we evaluated the extent to which liver is sexually differentiated in the neonates. Differently from that seen in the adults, PCA analysis obtained from the metabolic signature of livers from female and male mice at postnatal day 1 (P1) (Figure 4A) showed partially overlapping ellipses, indicating the potential for some sexual differentiation. Indeed, when we prevented liver masculinization (Plourde et al., 1995) by treating the pregnant mothers and the pups with the aromatase inhibitor Arimidex (which precluded the perinatal synthesis of estradiol from testosterone) the PCA of liver metabolites was completely superimposable in the two sexes. This provided an initial evidence that testosterone conversion into estradiol was a prerequisite for liver sexual differentiation. Consistent with that, unsupervised clustering analysis of hepatic metabolites failed to discriminate between males and females (Figures 4B and S3).
Figure 4.

Sex-Specific Liver Metabolome Is Associated with Neonatal Estrogen Signaling
(A and B) PCA (A) and hierarchical clustering heatmap (B) measured at P1 in the liver of males and females treated with vehicle (VEH) or 1 mg/kg Arimidex (Ar).
(C–E) Quantitative analysis of the metabolites measured in the liver of 3-month-old adult male and female ArKO (aromatase KO) mice. Data represent mean ± SEM (n = 3).
To further evaluate the extent to which testosterone conversion into estradiol was relevant for male liver differentiation, we measured the metabolites of the livers of adult (3-month-old) aromatase KO mice (ArKO) (see STAR Methods). No significant differences were found (Figures 4C–4E), suggesting that the metabolic sexual dimorphism of liver might have been driven by estrogens.
Finally, we attempted to masculinize female livers by treating genetically female mice with estradiol-benzoate (50 mg/kg) or vehicle at P2, P5, and P8. The metabolomic study was then done in the livers of adult animals. The results in Figure 5A showed that the estradiol-treated females had lost their hepatic, sex-specific metabolic profile, as indicated by the low content of metabolites relevant for the gluconeogenic and PPP pathways and by the relatively high content of aa (which, in the estrogen-treated females, was generally indistinguishable from males). Less obvious was the effect of estrogen treatment on the TCA cycle and energy metabolites. As expected, the same treatment carried out in parallel in males did not induce any significant metabolic alteration (Figure 5A).
Figure 5.

Estrogen Signaling in Neonates Masculinizes their Liver Metabolism
(A) Relative analysis of the relevant metabolites measured in the liver of adult male and female mice treated postnatally (at P2, P5, and P8) with VEH or 50 mg/kg estradiol-benzoate (E2). Bars are mean ± SEM (n = 4–12). ∗p < 0.05, ∗∗p < 0.01, ∗∗∗p < 0.001 versus MAL; #p < 0.05, ###p < 0.001 versus VEH by two-way ANOVA followed by Bonferroni post hoc test.
(B) Luciferase enzymatic activity measured in the liver of male and female mice at embryonal day 16.5 (E16.5), E18.5, and P1. Data represent means ± SEM (n = 2–11). ∗∗∗p < 0.001 by two-way ANOVA followed by Bonferroni post hoc test.
(C and D) The Esr1 mRNA (C) and Ar mRNA (D) contents were measured by real-time PCR in the liver of males (MAL), females (FEM), LERKO males (LERKO MAL), and LERKO females (LERKO FEM) at different developmental stages (E18.5, P0, P1, P8, P20, P40, and P50). Data represent mean ± SEM (n = 4). ∗∗∗p < 0.001 FEM versus MAL; #p < 0.05, ##p < 0.01 versus control mice by two-way ANOVA followed by Bonferroni post hoc test.
This set of experiments clearly demonstrated that in females the perinatal exposure to estradiol induced permanent changes in liver metabolic profile.
We therefore investigated the ability of neonatal liver to aromatize circulating testosterone by collecting the livers at different developmental stages (E18.5, P0, P1, P8, P20, P40, and P50) to measure Cyp19a1 gene expression. In both sexes, at no time point we could detect the mRNA encoded by the aromatase gene (data not shown); this ruled out the hypothesis of a local testosterone conversion. Yet, when we measured luciferase activity at P1 in the ERE-Luc reporter mouse (Ciana et al., 2001), the reporter content in the liver was much higher in males than in females (Figure 5B); the male-specific increase of luciferase accumulation observed at P1 in the liver was similar to that found in the sexually dimorphic brain, but not in other organs where sexual differentiation has not been reported, such as the intestine, lung, or thymus (Figure S4A). This showed that in males the ERα was transcriptionally active at the time of neonatal sexual differentiation. In agreement with this finding, Esr1 mRNA was significantly higher in the male livers at birth, where the expression of the receptor kept increasing up to day 8 to then decrease to reach the low levels characteristic of adult males (Della Torre et al., 2016) (Figure 5C). Conversely, in both sexes androgen receptor (Ar) mRNA was little expressed prior to birth up to P8 (Figure 5D). This observation, together with the fact that, in liver at E18.5, P0, and P1, Esr1 was 6–7 times more expressed than Ar (data not shown), led us to conclude that AR was unlikely to be engaged in the process of liver masculinization while the liver ERα was clearly involved.
Next, to verify that estrogens could be synthetized in organs different from the liver, we measured aromatase expression in male testis. As shown in Figure S4B, the amount of Cyp19a1 mRNA in the testis is comparable with what found in male brain at the same age.
The Role of the Hepatic Estrogen Receptor in Liver Metabolism
To finally demonstrate the role of the hepatic ERα in sustaining liver sexual dimorphism, we carried out a liver-specific deletion of the Esr1 gene using a Cre-LoxP recombination system where the Cre-recombinase was driven by the albumin promoter (LERKO mice) (Della Torre et al., 2011). The RNA sequencing (RNA-seq) study demonstrated that in the liver of adult LERKO mice the Esr1 gene expression was significantly decreased (Figure 6A). To have direct insight on the timing of ERα deletion in the liver of the LERKO mutants generated, we measured Esr1 mRNA at different developmental times. The presence of the Cre-recombinase prevented the synthesis of Esr1 mRNA already at E18.5 in both sexes (Figure 5C). Thus, an impairment of liver perinatal masculinization should have occurred in LERKO males. The elimination of ERα did not affect the expression of the AR up to day P40, but appeared to limit significantly the expression of this gene in the adult males (Figure 5D).
Figure 6.

Liver Metabolic Consequences of Esr1 Gene Ablation
(A) Heatmap of Esr1 expression in the liver of control (ERα floxed mice, CTRL) and LERKO (liver ERα KO mice) males and females at M and at P as measured by RNA-seq.
(B and C) Score plot of PCA (B) and hierarchical clustering heatmap (C) of biologically relevant metabolites measured in the liver of males (MAL), LERKO males (LERKO MAL), females (FEM), and LERKO females (LERKO FEM) (n = 6).
(D–H) Heatmap reporting as Log2 fold change the mean expression of genes involved in aa metabolism (D) (upper), aa transport (D) (lower), TCA (E), glycolysis (F) (upper), gluconeogenesis (F) (lower), synthesis of FA (G) (upper) and TG (G) (lower), TG secretion and uptake (H) from RNA-seq analysis performed in the livers of males, females, LERKO males and LERKO females.
(I) Free fatty acids (FFA), triglyceride (TG), and cholesterol (CH) content measured in the livers of control and LERKO males and females at M. The data are mean ± SEM (n = 10–14). ∗p < 0.05, ∗∗p < 0.01, and ∗∗∗p < 0.001 versus MAL; ###p < 0.001 versus control mice.
With regard to general metabolic parameters, the LERKO mutation did not affect body and WAT weight; however, food intake was increased in the male LERKO only; this augmented food intake in the absence of an increased body weight was indicative of some metabolic alterations that limited feed efficiency (Figure S4C).
Transcriptome investigation showed that in LERKO liver sex differences were maintained for 42% of the genes (Figures S4D and S4E). Gene ontology analysis, however, did not allow us to pinpoint metabolic strategies characteristic of the LERKO mutants (Figures S5A and S5B), and this induced us to continue with the metabolic study. In spite of the fact that PCA (Figure 6B) and hierarchical clustering (Figure 6C) showed a good degree of maintenance of liver sexual identity in the LERKO mutants, the neonatal ERα ablation had a significant impact on aa metabolism of adult males as indicated by the hepatic content of aa that was reduced to levels comparable with control females (Figure S6A). Yet, different from control females, in the LERKO male livers the aa did not appear to give a significant contribution to the TCA anaplerosis and, more importantly, to the gluconeogenesis or lipid synthesis (Figure S6B). This was also indicated by the very limited increase of the enzymes necessary for lipid synthesis (Figure 6G) and the lack of lipid accumulation in the hepatic parenchyma (Figure 6I). This was ascribed to the fact that male LERKO lacked the circulating estrogens and hepatic ERα necessary to direct the metabolism toward the female phenotype.
In females, ERα ablation caused a generalized increase in liver content of aa, particularly significant for Ser, Thr, and Gln (Figure S6A), potentially ascribable to a reduced aa catabolism and transport (Figure 6D). With the exception of citrate (that was significantly decreased), TCA intermediates (Figure S6B) and the related genes (Figure 6E) were unaffected by the mutation. The increased expression of the mitochondrial phosphoenolpyruvate carboxykinase 2 (Pck2) (Figure 6F) together with the low content of pyruvate and the still high content of oxaloacetate (Figure S6B) indicated that, possibly, LERKO females used lactate as a preferential substrate instead of aa as a source for gluconeogenesis. This change in the metabolic strategy might enable LERKO females to pursue the synthesis of lipids (Figure 6G). The significantly increased content of TGs (Figure 6I) in LERKO female liver was likely the result of a reduced TG secretion and of an increased lipid uptake, as suggested by the low expression of apolipoprotein A-IV (Apoa4) and the higher expression of the VLDL receptor (Vldlr) (Figure 6H). Finally, in the liver of LERKO females we observed increased amounts of medium chain acyl-carnitines (C8-C10) (Figure S6C) that suggested an impairment of FA β-oxidation despite an increased carnitine palmitoyltransferase I (Cpt1α) activity (Figure S6D). The reduced flux of aa in the TCA cycle and impaired FA β-oxidation are in line with a reduced energy charge in LERKO females (Figures S6E–S6G). All these features further contributed to an altered liver metabolism and lipid deposition.
All of these changes in females underlined the major metabolic role that the ERα has in adult female liver.
Finally, we measured the effects of the LERKO mutation in plasma (Figure S7). No major alterations were observed, most of them were associated with males where plasma concentrations of glucose and lactate were lower than in the floxed mice, but identical to females. Ala, Met, and Tyr concentrations were low in the LERKO males; however, the minimal alterations in plasma aa content suggested that the liver is the first tissue able to adapt to short-time fasting in a sex-specific mode.
Discussion
This study, by combining transcriptomic and metabolomic data, shows that the use of aa is a key element to discriminate male and female hepatic metabolism. In fact, when littermates were subjected to a metabolic challenge such as short-term fasting, males preserved liver aa by restraining lipogenic and gluconeogenic pathways; on the contrary, females utilized the aa pool. As comprehensively shown in Figure 7, aa were used for the anaplerosis of the TCA cycle and the production of the intermediates necessary for the gluconeogenic and lipogenic pathways. Interestingly, in these females the gluconeogenic pathway did not appear to generate glucose only to maintain euglycemia, but also to employ part of the glucose 6-phosphate made to synthesize the metabolites necessary to feed the PPP in order to obtain the NADPH required for FA anabolism.
Figure 7.

A Comprehensive View of Female Liver Metabolism When Fasted for a Short Period of Time
The combined transcriptome and metabolome analyses enable us to understand the response of hepatic metabolism of adult females to short fasting. The metabolites/genes more/less expressed than in males are shown in red or blue, respectively. The metabolites/genes equally expressed in the two sexes are shown in gray.
Thus, the immediate reaction of female liver to fasting was to use its available sources to continue in the production of reserves in the form of lipids. This female-specific feature seemed particularly pronounced at metestrus, a phase of the reproductive cycle where females necessitate cholesterol to initiate steroidogenesis, to build up the energy stores necessary to ovulate and to prepare the entire organism for potential pregnancy (Butte, 2000, Miller and Bose, 2011, O'Sullivan, 2009, O'Sullivan et al., 2001). Such a metabolic response to short-term fasting was liver specific as neither WAT nor muscle showed any metabolic dimorphism in our experimental conditions. These findings are consistent with the ancestral and strict functional association between the liver and the gonads (Della Torre et al., 2014, Della Torre and Maggi, 2017), where female liver is a primary sensor of the changes characterizing each reproductive stage (puberty, ovulation, early and late pregnancy, and lactation), and is the first organ to adapt its metabolism to female reproductive needs. The liver, in turn, as a major endocrine organ, may be responsible for the production of hormones able to signal to the other organs (principally the brain, but also the gonads) the metabolic/functional changes necessary to favor fertility, gestation, and lactation (e.g., lipids, transport proteins, peptides such as insulin-like growth factor 1 [IGF-1], fibroblast growth factor 21 [FGF21], leukocyte cell-derived chemotaxin-2 [LECT2], and growth differentiation factor 15 [GDF15]) or other hepatokines identified in our analyses of the transcriptome (data not shown) and known to participate in liver-gonad interactions (Della Torre et al., 2011, Runchey et al., 2014, Della Torre and Maggi, 2017, O'Rahilly, 2017, Meex and Watt, 2017).
The existence of a sexual dimorphism in liver has been described previously and proposed to be the resultant of a gonadal-hypothalamus-pituitary-liver axis (Mode and Gustafsson, 2006). According to this hypothesis, the sex-dependent pattern of the pituitary growth hormone secretion neonatally imprinted and emerging at puberty would establish and maintain the sexually dimorphic liver gene transcription. While we do not rule out the contribution of such a mechanism to some of the sex-specific metabolic functions of the adult liver, the results of the present study show that liver sexual differentiation is measurable already at P1, and the male-female metabolic differences are completely abolished by the perinatal treatment with an aromatase inhibitor. At the same time, the concentration and transcriptional activity of ERα in male liver is significantly higher than in female pointing to a direct involvement of the hepatic ERα in the neonatal liver masculinization.
As aromatase is not present in the mouse liver at birth, it remains to be understood how, in the neonate, hepatic ERα is activated. The most likely hypothesis is that the testosterone synthesized by the male gonads is converted into estradiol in organs other than the liver and then reaches the hepatic parenchyma via the bloodstream. Supporting this, we showed that testosterone aromatization may occur in the male testis where the aromatase gene is expressed at P1. This finding is in agreement with prior literature (Borday et al., 2013). Considering that the liver is the organ that drains circulating steroids for their catabolism, it is conceivable that plasma estradiol is able to reach a concentration sufficient to activate the hepatic ERα.
The extent and the nature of the epigenetic changes induced perinatally in the liver by testosterone/estradiol remain to be elucidated, certainly the Esr1 gene and the estrogen signaling participate in the full establishment of the sex-specific liver phenotype. In adult mice the expression of the hepatic ERα is sexually dimorphic; furthermore, during the female reproductive cycle, both the expression and activity of the hepatic ERα changes significantly to orchestrate liver metabolism in support of the progression of the cycle (Della Torre et al., 2016, Villa et al., 2012). The mutual regulation among liver ERα, hepatic metabolism, and reproductive functions (Della Torre et al., 2011, Della Torre et al., 2016, Villa et al., 2012) might reach its maximum degree of complexity during pregnancy, when hepatic ERα is likely involved in regulating the anabolic to catabolic shift of metabolism necessary to sustain the energetic needs of the developing embryo (Butte, 2000).
The present study highlights aa as the molecular element distinguishing male and female metabolism: the lack of masculinization in ArKO male mice was shown to align the content of aa in the two sexes; conversely, estrogen-masculinized females showed aa concentrations indistinguishable from males. In the LERKO mice not all findings had been anticipated: as expected in males we observed decreased levels of aa due to the impairment of the masculinization process associated with liver ERα ablation in neonates, while the increased aa concentrations found in females were unanticipated because the liver has a feminine metabolism by default. We believe that these results may be ascribed to a defective metabolism in the adult animals caused by the lack of ERα, the key female hepatic regulator of metabolism.
To this regard, it is important to consider that liver ERα activity is transcriptionally regulated by estrogens and aa (Della Torre et al., 2011). This dual control might be instrumental to differentiate liver ERα-dependent signaling pathways in relation to endocrine and nutritional elements. In our previous studies we demonstrated that hepatic ERα has a key role as a sensor of nutritional and gonadal signaling and as a regulator of the molecular elements essential for the progression of the reproductive cycle (e.g., lipids, transport proteins, and IGF-1) (Della Torre et al., 2011, Della Torre et al., 2016). Indeed, in case of calorie restriction it was shown that female mice expressing liver ERα were able to continue the cycle for a longer time than LERKO, possibly because of their more efficient use of dietary and liver aa (Della Torre et al., 2011).
The role of liver in preserving the indissoluble bond between metabolic and reproductive functions is deeply rooted in phylogenesis. In oviparous, the gonads, through the synthesis of specific hormones, direct liver metabolism toward the synthesis of the molecules necessary for the maturation of the egg; in turn, the liver regulates ovarian ovulation in relation to the nutritional supply (Della Torre et al., 2014, Della Torre and Maggi, 2017). Conceivably, to bear gestation, female mammals had to further refine the mechanisms necessary to cope with dietary restrictions with the mutable energy requirements associated with each reproductive phase. Our study shows that, when confronted with the lack of food, the initial strategy of female liver is to keep building up energy stores (lipids) using the available aa. This may be highly strategic because of the incapacity of mammals to synthesize specific aa; by maintaining low levels of aa, the female liver could keep gauging the nutritional status. In addition, a liver able to use up all aa available could generate the lipids to complete ovulation in case of short-time starvation. In case of a prolonged starvation, the lack of aa would be a very strong signal for the blockade of all reproductive functions, while the lipid stored would keep the mother alive. It is not surprising that such a hepatic mechanism could have been favorably selected in the past 120 million of years since mammals first appeared on earth. Likely this determined female and male hepatic metabolism to diverge as males were not subjected to such an evolutionary pressure.
Lifestyle, obesity, and the control of energy homeostasis are believed to be central to the ever-growing number of chronic, non-communicable diseases. The liver with its central role in energy metabolism is a major player in driving the onset and progression of several of these disorders; thus, a full understanding of its strategic use of endogenous and exogenous energetic sources is of mounting interest. In this context, the full comprehension of liver sexual differential activities is indispensable for the generation of efficacious dietary and pharmacological interventions. Most of the studies carried out in the past have been mainly devoted to a description of the even very significant differences in the two sexes, but failed to provide a clear understanding of the biology that stands behind such differences.
We believe that the current study, by unraveling the major role of aa in differentiating male and female liver metabolism provides very important, new metabolic information to be exploited for nutritional and medical purposes and puts a novel emphasis on the importance of framing sexual dimorphisms in a broader biological context, with the reproductive function acting as the main element that, during evolution, induced the physiological differences in male and female organisms.
Limitations of the Study
The full comprehension of liver sexual differential activities is indispensable for the generation of efficacious dietary and pharmacological interventions. Most of the studies carried out in the past have been mainly devoted to a description of the even very significant differences in the two sexes, but failed to provide a clear understanding of the biology that stands behind such differences.
A potential limitation of our study is that it was carried out in mice, and further studies should be done in the future to demonstrate that such sex-specific mechanisms are present in humans too. However, considering the degree of evolutionary conservation of the mechanisms of reciprocal control between energy metabolism and reproduction we believe that the current study, by unraveling the major role of aa in differentiating male and female liver metabolism, provides very important, new metabolic information to be exploited for nutritional and medical purposes.
STAR★Methods
Key Resources Table
| REAGENT or RESOURCE | SOURCE | IDENTIFIER |
|---|---|---|
| Bacterial and Virus Strains | ||
| E. coli: One Shot Stbl3 Chemically Competent | Thermo Fisher | C737303 |
| Chemicals, Peptides, and Recombinant Proteins | ||
| Anastrazole | Sigma | A2736 |
| Estradiol-benzoate | Sigma | E1600000 |
| Beetle Luciferin, Potassium Salt | Promega | E160E |
| TRIzol Reagent | Invitrogen | 15596026 |
| Random Primers | Promega | C118A |
| M-MLV RT and 5X Buffer | Promega | M531A |
| Universal PCR Master Mix No AmpErase UNG | ThermoFisher/Life Technologies | 4324018 |
| PshAI restriction enzyme | NEB | R0593 |
| BglI restriction enzyme | NEB | R0143 |
| G 418 disulfate salt | Sigma Aldrich | A1720 |
| Critical Commercial Assays | ||
| RNeasy mini kit | Qiagen | 74104 |
| RNA 6000 Nano chip Bioanalyzer | Agilent Technologies | 5067-1511 |
| DNA 1000 Kit | Agilent Technologies | 5067-1504 |
| Agencourt AMPure XP Beads | Beckman Coulter | A63881 |
| TruSeq RNA Sample Prep v2- Set A | Illumina | RS-122-2001 |
| SuperScript II Reverse Transcriptase | ThermoFisher/Life Technologies | 18064-014 |
| Q33120 QUANT-IT DSDNA ASSAY KIT | ThermoFisher/Life Technologies | Q33120 |
| Pierce Coomassie (Bradford) Protein Assay Kit | ThermoFisher | 23200 |
| Free Fatty Acid Quantification Colorimetric/Fluorometric kit | Biovision | K612 |
| Triglyceride Quantification Colorimetric/Fluorometric Kit | Biovision | K622 |
| Total Cholesterol and Cholesteryl Ester Colorimetric/Fluorometric Assay Kit | Biovision | K603 |
| Deposited Data | ||
| Mouse reference genome, GRCm38 | Genome Reference Consortium | https://www.ncbi.nlm.nih.gov/grc/mouse |
| Gencode Mouse reference gene annotation, M11 | Gencode | http://www.gencodegenes.org/mouse_releases/11.html |
| Raw data | This paper | BioProject ID: PRJNA395963 |
| Experimental Models: Cell Lines | ||
| Mouse: C57BL/6 ESCs | ATCC | ATCC SCR-1002 |
| Experimental Models: Organisms/Strains | ||
| Mouse: ERE-Luc | Ciana et al., 2001 | N/A |
| Mouse: control (ERα floxed) and LERKO | Della Torre et al., 2011 | N/A |
| WT mouse: C57BL/6 | Charles River | JAX C57BL/6J |
| WT mouse: CD-1 | Charles River | CD-1 IGS Mouse |
| Transgenic Mouse: C57BL/6-Tg(CAG-Flpe)2Arte | TACONIC | 7089 |
| Transgenic Mouse: B6.C-Tg(CMV-cre)1Cgn/J | The Jackson Laboratory | JAX: 006054 |
| Transgenic Mouse: ArKO | This paper | N/A |
| Oligonucleotides | ||
| Primers for Cyp19a1 | ThermoFisher/Life Technologies | Mm00484048_m1 |
| Primers for Esr1 | ThermoFisher/Life Technologies | Mm00433147_m1 |
| Primers for Ar | ThermoFisher/Life Technologies | Mm00442688_m1 |
| Primers for 36b4: Forward, GGCGAC CTGGAAGTCCAACT; Reverse, CCATCA GCACCACAGCCTTC |
This paper | N/A |
| Primers for ArKO mouse generation: E-fwd, GCTCTGGTCAGTTCTCCACAGAGGC; N-rew, GCGGCCGGAGAACCTGCGTGCAATC; L-fwd, CGATAAGTGGACTTTTATTCCAGAC; L-rew, GTGACTCACATATAGACTCCAGAAG |
This paper | N/A |
| Recombinant DNA | ||
| Plasmid: pTargeting-loxP-exIICyp19a1-loxP | This paper | N/A |
| radiolabelled probe: NEO | This paper | N/A |
| radiolabelled probe: 3′ EXT | This paper | N/A |
| Software and Algorithms | ||
| Fastqc | http://www.bioinformatics.babraham.ac.uk/projects/fastqc/ | http://www.bioinformatics.babraham.ac.uk/projects/fastqc/ |
| STAR | Dobin et al., 2013 | https://github.com/alexdobin/STAR |
| Samtools | Li et al., 2009 | https://sourceforge.net/projects/samtools/ |
| RNAseqQC | DeLuca et al., 2012 | http://archive.broadinstitute.org/cancer/cga/rna-seqc |
| DESeq2 | Love et al., 2014 | https://bioconductor.org/packages/release/bioc/html/DESeq2.html |
| Bioinformatics & Evolutionary Genomics | http://bioinformatics.psb.ugent.be/webtools/Venn | http://bioinformatics.psb.ugent.be/webtools/Venn/ |
| Shinyheatmap | Khomtchouk et al., 2017 | http://shinyheatmap.com/ |
| ClueGO | Bindea et al., 2009 | http://apps.cytoscape.org/apps/cluego |
| G:Profiler | Reimand et al., 2016 | http://biit.cs.ut.ee/gprofiler/ |
| MultiQuant software (version 3.0.2) | AB Sciex | https://sciex.com/products/software/multiquant-software |
| Metaboanalyst 3.0 | Xia and Wishart, 2016 | http://www.metaboanalyst.ca/ |
| GraphPad Prism 5.0 | GraphPad Software | https://www.graphpad.com/scientific-software/prism/ |
Contact for Reagent and Resource Sharing
Further information and requests for resources and reagents should be directed to and will be fulfilled by the Lead Contact, Adriana Maggi (adriana.maggi@unimi.it).
Experimental Model and Subject Details
Animals
Control (ERα floxed), LERKO (Della Torre et al., 2011) and heterozygous ERE-Luc reporter (Ciana et al., 2001) mice were fed with D12450B diet (Research Diets). Room temperature was maintained at 22°C–25°C and the light/dark cycle was 12 hr (lights on at 7:00 a.m.).
Unless otherwise stated, the mice were 8 months of age. Vaginal smears were performed at 9:00 a.m. To avoid any possible confounding effect due to the circadian rhythm or feeding status, the mice were euthanized in the early afternoon after 6 hr of fasting (Della Torre et al., 2011).
ArKO mice were grown in D. Metzger animal facilities and tissues were collected as specified above.
For all the animal studies, both male and female mice were used.
All animal experimentation was performed in accordance with the ARRIVE guidelines and the European guidelines for animal care and the use of experimental animals, approved by the Italian Ministry of Research and University, and controlled by a departmental panel of experts.
Method Details
Generation of ArKO Mice
The ArKO (aromatase KO) transgenic mouse was generated by homologous recombination in mouse C57BL/6 ESCs following standard procedure. Considering that the ATG translation start site of Cyp19a1 gene is located in coding exon II, the targeting vector consists of reconstructed exon II of Cyp19a1 flanked by loxP sites, including 5′ region of 4.2 kb and 3′ region of 3.2 Kb to do the homologous recombination. The targeting vector contains also the neomycin sequence flanked by FRT sites to allow the antibiotic selection after the ESC electroporation. The presence of targeted insertion and absence of random integration in the ESC resistant clones were identified using PCR analysis and later confirmed by Southern blotting. The PCR primers used were:
E-fwd GCTCTGGTCAGTTCTCCACAGAGGC;
N-rev GCGGCCGGAGAACCTGCGTGCAATC.
In this case the PCR product size of 4.7 Kb confirmed the presence of targeted integration.
L-fwd CGATAAGTGGACTTTTATTCCAGAC
L-rev GTGACTCACATATAGACTCCAGAAG
In this case the presence of transgene was confirmed by the PCR product size of 0.24 Kb, the absence of transgene by the PCR product size of 0.19 Kb (WT).
Once identified the ESC clones positive for the targeted insertion, southern blotting confirms them. The genomic DNA extracted by ES-positive clones was digested with PshAI restriction enzyme and the blot was incubated with NEO and 3′EXT radiolabelled probes (WT probe NEO: null; WT probe 3′EXT: 10.9 Kb; TG probe NEO: 13 Kb; TG probe 3′EXT: 13 Kb).
Then the genomic DNA extracted by ESC positive clones was digested with BglI restriction enzyme and the blot was incubated with NEO and 5′EXT radiolabeled probes (WT probe NEO: null; WT probe 5′EXT: 16 Kb; TG probe NEO: 11.5 Kb; TG probe 5′EXT: 6.2 Kb).
One positive ESC clone was injected into C57BL/6 blastocyst which are transferred to pseudo-pregnant CD-1 females. We obtained chimeric male mice (with 80%–90% of chimerism) that were mated to wild-type (WT) C57BL/6 female mice to produce F1 ArKO mice. The F1 ArKO mice were mated with Flp deleter transgenic mice (TACONIC) to remove ubiquitously the Neo cassette producing the F2 ArKO mice. Then the ArKO F2 mice were mated with a cre-transgenic mouse strain for the ubiquitous deletion of loxP-flanked gene segments to remove the ATG translation start site of Cyp19a1 gene producing the knockout of aromatase.
We confirmed the Cyp19a1 ablation by analyzing the expression of the aromatase gene by RTPCR in all the tissues received by D. Metzger.
RNA-Sequencing Sample and Library Processing
RNA from liver of control (ERα floxed) and LERKO mice was isolated with TRIzol (Invitrogen) and purified using the RNeasy minikit protocol (Qiagen), according to the manufacturer’s instructions.
RNA Quality Control was performed with the RNA 6000 Nano Kit (Agilent) on Agilent Bioanalyzer (Agilent). The RNA Integrity Number (RIN) was determined for every sample and all samples were considered suitable for processing if RIN > 7.5. RNA concentration was spectrophotometrically estimated using Nanoquant Infinite M200 instrument (Tecan). Sequencing libraries were prepared using the TruSeq RNA Sample Prep V2 (Illumina) with an input of 800 ng of total RNA. We validated and quantified final libraries with the DNA1000 kit on Agilent Bioanalyzer. Pooled libraries were sequenced on Illumina NextSeq, producing 2X75 bp paired end reads.
Transcriptomics Data Analysis
Raw sequencing reads were processed for quality check using FASTQC (v0.11.5) (http://www.bioinformatics.babraham.ac.uk/projects/fastqc/). Pre-alignment data processing, including trimming and adapter removal, was not performed as it not necessary due to the high quality of data. Raw paired end reads (BioProject ID:PRJNA395963) were then mapped to the mouse reference genome (GRCm38 primary assembly – gencode source) using STAR aligner (v2.5.2a) (Dobin et al., 2013) tuned accordingly to obtain only uniquely mapped fragments. Gencode release M11 gene transfer file (GTF) was used as reference gene annotation file for alignment. Aligned data were manipulated using Samtools (Li et al., 2009) and several post-alignment quality control metrics were collected using RNA-SeQC (DeLuca et al., 2012). In particular, we evaluated coverage across gene body, transcriptome profile efficiency (percentage of reads mapping to exons), samples correlation matrices and number of detected genes in order to identify possible contaminations, mapping failures, and obvious outliers. We quantified gene expression by using the quantmode GeneCounts option in STAR. The counts produced coincide with those produced by htseq-count (Anders et al., 2015) with default parameters. Samples counts were merged into a single genes counts matrix (24 samples, 48709 genes – BioProject ID:PRJNA395963), which was used as input for differential expression analysis. The statistical analysis was performed by using DESeq2 package (Love et al., 2014), testing (Wald Test) group vs group accordingly to experimental design. Unless otherwise stated, a threshold of 0.05 was applied to False Discovery Rate (FDR) adjusted p values in order to select the differentially expressed genes (DEGs) to use in downstream analysis. Exploration data analysis (clustering and principal component analysis - PCA) was performed using build in functions in DESeq2 package.
Venn diagram showing the number of DEGs in mouse liver was made with Bioinformatics & Evolutionary Genomics software (http://bioinformatics.psb.ugent.be/webtools/Venn/). Heatmap of DEGs was made with Shinyheatmap software by uploading the quadruplicate mean values (Khomtchouk et al., 2017). Cluster analysis of functional networks significantly enriched in the liver was performed by using the Cytoscape plug-in ClueGO (Bindea et al., 2009) with the following parameters: ontology: GO, biological process: all (update 23.02.2017); enrichment/depletion: two-sided hyper geometric test; GO tree level: 7−8; p value: <0.05; p value correction: Bonferroni; GO term restriction: 4 genes minimum, 4% genes; kappa score: 0.4; initial group size: 2; group merge: 50%; leading group term: highest significance. Gene ontology (GO) analysis on DEG lists was performed using the g:Profiler software (Reimand et al., 2016).
Metabolomic Analyses
For metabolomic analyses, liver, muscle, white adipose tissue, testis, and ovary were homogenized with a tissue lyser. Briefly, tissues were lysed in 250 μL of methanol/acetonitrile 1:1 (v/v) with D-Glucose-13C6 1 ng/μL (internal standard, Sigma Aldrich, 389374) and centrifuged at 4°C. Supernatant was saved for subsequent analysis. Amino acid quantification was performed through previous derivatization. Samples were incubated with PITC solution for 20 min at RT, dried and resuspended in 5 mM ammonium acetate in MeOH/H2O 1:1 (v/v).
Metabolomic data were performed on an API-4000 triple quadrupole mass spectrometer (AB SCIEX) coupled with a HPLC system (Agilent) and CTC PAL HTS autosampler (PAL System). The identity of all metabolites was confirmed using pure standards. Quantification of different metabolites was performed with a liquid chromatography/tandem mass spectrometry (LC-MS/MS) method using a C18 column (Biocrates) for amino acids and cyano-phase LUNA column (50 mm x 4.6 mm, 5 μm; Phenomenex). aa were analyzed through a 10 min run in positive while other metabolites were run in negative ion mode in a 5 min run. 20 of multiple reaction monitoring (MRM) transition in positive ion mode (aa) and 30 MRM transition in negative ion mode (all other metabolites) were used, respectively. The mobile phases for positive ion mode analysis (aa) were phase A: 0.2% formic acid in water and phase B: 0.2% formic acid in acetonitrile. The gradient was T0 100% A, T5.5 min 5% A, T7 min 100% A with a flow rate of 500 μL/min. The mobile phase for negative ion mode analysis (all other metabolites) was phase A: 5 mM ammonium acetate pH 7.00 in MeOH. The gradient was 100% A for all the analysis with a flow rate of 500 μL/min. MultiQuant software (version 3.0.2) was used for data analysis and peak review of chromatograms. Quantitative evaluation of all metabolites was performed based on calibration curves with pure standards, then data were normalized on micrograms of proteins. Metabolomic data analysis was performed by using Metaboanalyst 3.0 software (http://www.metaboanalyst.ca/).
Liver and Plasma Lipid Content
The free fatty acids (FFA), triglyceride (TG), and cholesterol (CH) levels were measured with appropriate kits according to the manufacturer’s protocols (Biovision).
Pharmacological Treatments
Aromatase inhibition: vehicle or 1 mg/Kg/day Arimidex (Anastrazole, Sigma) were administered s.c. to the mothers starting from pregnancy day 15 (PD15) until pup delivery. Pups were treated with vehicle or Arimidex 1 mg/Kg/day s.c. at the post-natal day 1 (P1) and then sacrificed after 3 hr.
Estrogen-induced masculinization: pups were treated with vehicle or 50 mg/Kg/day estradiol-benzoate (Sigma) s.c. at the postnatal day 2, 5, and 8 (P2, P5 and P8) and then sacrificed at 8 months of age.
Luciferase Enzymatic Activity
Luciferase assay was carried out as previously described (Maggi and Rando, 2009). Briefly, freshly dissected tissues were immediately frozen and stored at −80°C for the biochemical assay. Tissues (20–100 mg) were homogenized by TissueLyser using 300 μL of the phosphate lysis buffer (100 mM KPO4 pH 7.8, 1 mM dithiothreitol, 4 mM EGTA, 4 mM EDTA, and 0.7 mM PMSF) and stainless steel beads in 1.2 mL polyethylene microtubes containing the tissue fragments or the cells.
Protein concentrations in the supernatants were measured using the Bradford assay using solutions and protocols commercially available. The homogenates were frozen on dry ice and thawed in water, then are centrifuged (4900 g for 30 min at 4°C). Supernatant were collected and diluted to a protein concentration of 1 mg/mL. 20 μL of the supernatant is transferred to a white opaque 96-well plate for luminescence quantification by luminometer (Glomax, Promega). Typically, luminescence is measured in an integration time of 10 s, after automatically injecting 100 μL of luciferase assay reagent (10 mM luciferin, 1 M dithiothreitol, 200 mM ATP dissolved in 100 mM phosphate buffer, pH 7.0). Light measurements were recorded by the luminometer software. Luminescence data, normalized over protein content of each sample, were finally expressed as relative light units (RLU) per μg of protein.
Real-Time PCR Gene Expression Analysis
Total liver RNA extraction was isolated with TRIzol Reagent (Invitrogen) and purified using the RNeasy minikit protocol (Qiagen), according to the manufacturer’s instructions. For the preparation of cDNA, 1 μg RNA was denatured at 75°C for 5 min in the presence of 1.5 μg of random primers (Promega) in 15 μL final volume. Deoxynucleotide triphosphate (GE Healthcare) and Moloney murine leukemia virus reverse transcriptase (M-MLV RT) (Promega) were added at 0.5 mm and 8 U/μL final concentration, respectively, in a final volume of 25 μL. The RT reaction was performed at 37°C for 1 hr; the enzyme was inactivated at 75°C for 5 min. Control reactions without addition of the RT enzyme were performed for each sample.
For the real-time PCR experiments, the reaction mix for each sample was made up of 2 μL of pre-diluted cDNA, 5 μL of TaqMan 2× Universal PCR Master Mix No AmpErase UNG (ThermoFisher/Life Technologies), 0.5 μL of 20x primers/probes mix, and 2.5 μL of H2O. The primers used for the rtPCR reactions were as follows: Cyp19a1 (Mm00484048_m1), Esr1 (Mm00433147_m1), and Ar (Mm00442688_m1) (all from ThermoFischer/Life Technologies). The 36b4 primer was been used as reference gene assay (forward: 5′-GGCGACCTGGAAGTCCAACT-3′ and reverse: 5′-CCATCAGCACCACAGCCTTC-3′). The reaction was carried out according to the manufacturer’s protocol using QuantStudio 3 Real-Time PCR System with the following thermal profile: 2 min at 50°C; 10 min 95°C; 40 cycles (15 s at 95°C, 1 min at 60°C for Cyp19a1, Esr1 and Ar; 15 s at 95°C, 1 min at 59°C for 36b4), and data were analyzed using the 2−ΔΔCt method (Livak and Schmittgen, 2001).
Quantification and Statistical Analysis
Statistical analyses were performed by Student’s t test for the comparison of two different experimental groups, or two-way ANOVA followed by Bonferroni post hoc test for multiple testing comparisons. All statistical analyses were performed using GraphPad Prism 5.0 (GraphPad Software). All data are expressed as mean ± SEM. A p value less than 0.05 was considered statistically significant. The statistical parameters can be found in the figure legends.
Data and Software Availability
Raw RNA-seq data have been deposited to Bioproject; the accession number for the raw data is PRJNA395963.
Acknowledgments
We are grateful to V. Benedusi, R. Maggi, and E. Vegeto for helpful discussion during the preparation of the study; to N. Rizzi for her contribution in the preparation of the methodological section; and to G. Rando for the initial study on the embryonic expression of luciferase in the ERE-Luc mice. This work was supported by a grant from the European Community (ERC-Advanced Grant 322977, Ways) and by the Seventh Framework Programme (FP7/2007–2013) under grant agreement no. 278 850 (INMiND).
Author Contributions
S.D.T. conceived the project and performed most of the in vivo studies, RNA-seq data analysis, metabolomic data analysis, and biochemical assays. S.D.T. wrote and revised the manuscript. N.M. and D.C. conceived the metabolomic analysis. N.M. and S.P. performed the metabolomic analysis. F.L. and C.M. performed the Arimidex experiment. M.B. performed RNA-seq and preliminary bioinformatics analyses. L.O. performed the study of luciferase activity with ERE-Luc mice. D.M. performed the study with ArKO mice. A.M. conceived the project, wrote the paper, and supervised the entire project.
Declaration of Interests
The authors do not have any conflicts of interest.
Published: June 14, 2018
Footnotes
Supplemental Information includes seven figures and one table and can be found with this article online at https://doi.org/10.1016/j.cmet.2018.05.021.
Supplemental Information
References
- Anders S., Pyl P.T., Huber W. HTSeq - a python framework to work with high-throughput sequencing data. Bioinformatics. 2015;31:166–169. doi: 10.1093/bioinformatics/btu638. [DOI] [PMC free article] [PubMed] [Google Scholar]
- Arnold A.P., Cassis L.A., Eghbali M., Reue K., Sandberg K. Sex hormones and sex chromosomes cause sex differences in the development of cardiovascular diseases. Arterioscler. Thromb. Vasc. Biol. 2017;37:746–756. doi: 10.1161/ATVBAHA.116.307301. [DOI] [PMC free article] [PubMed] [Google Scholar]
- Arnold A.P., Gorski R.A. Gonadal steroid induction of structural sex differences in the central nervous system. Annu. Rev. Neurosci. 1984;7:413–442. doi: 10.1146/annurev.ne.07.030184.002213. [DOI] [PubMed] [Google Scholar]
- Ayonrinde O.T., Olynyk J.K., Beilin L.J., Mori T.A., Pennell C.E., de Klerk N., Oddy W.H., Shipman P., Adams L.A. Gender-specific differences in adipose distribution and adipocytokines influence adolescent nonalcoholic fatty liver disease. Hepatology. 2011;53:800–809. doi: 10.1002/hep.24097. [DOI] [PubMed] [Google Scholar]
- Bindea G., Mlecnik B., Hackl H., Charoentong P., Tosolini M., Kirilovsky A., Fridman W.H., Pages F., Trajanoski Z., Galon J. ClueGO: a Cytoscape plug-in to decipher functionally grouped gene ontology and pathway annotation networks. Bioinformatics. 2009;25:1091–1093. doi: 10.1093/bioinformatics/btp101. [DOI] [PMC free article] [PubMed] [Google Scholar]
- Borday C., Merlet J., Racine C., Habert R. Expression and localization of aromatase during fetal mouse testis development. Basic Clin. Androl. 2013;23:12. doi: 10.1186/2051-4190-23-12. [DOI] [PMC free article] [PubMed] [Google Scholar]
- Butte N.F. Carbohydrate and lipid metabolism in pregnancy: normal compared with gestational diabetes mellitus. Am. J. Clin. Nutr. 2000;71:1256S–1261S. doi: 10.1093/ajcn/71.5.1256s. [DOI] [PubMed] [Google Scholar]
- Ciana P., Di Luccio G., Belcredito S., Pollio G., Vegeto E., Tatangelo L., Tiveron C., Maggi A. Engineering of a mouse for the in vivo profiling of estrogen receptor activity. Mol. Endocrinol. 2001;15:1104–1113. doi: 10.1210/mend.15.7.0658. [DOI] [PubMed] [Google Scholar]
- Clarkson J., Herbison A.E. Hypothalamic control of the male neonatal testosterone surge. Philos. Trans. R. Soc. Lond. B Biol. Sci. 2016;371:20150115. doi: 10.1098/rstb.2015.0115. [DOI] [PMC free article] [PubMed] [Google Scholar]
- Corbier P., Edwards D.A., Roffi J. The neonatal testosterone surge: a comparative study. Arch. Int. Physiol. Biochim. Biophys. 1992;100:127–131. doi: 10.3109/13813459209035274. [DOI] [PubMed] [Google Scholar]
- Della Torre S., Benedusi V., Fontana R., Maggi A. Energy metabolism and fertility: a balance preserved for female health. Nat. Rev. Endocrinol. 2014;10:13–23. doi: 10.1038/nrendo.2013.203. [DOI] [PubMed] [Google Scholar]
- Della Torre S., Maggi A. Sex differences: a resultant of an evolutionary pressure? Cell Metab. 2017;25:499–505. doi: 10.1016/j.cmet.2017.01.006. [DOI] [PubMed] [Google Scholar]
- Della Torre S., Mitro N., Fontana R., Gomaraschi M., Favari E., Recordati C., Lolli F., Quagliarini F., Meda C., Ohlsson C. An essential role for liver ERalpha in coupling hepatic metabolism to the reproductive cycle. Cell Rep. 2016;15:360–371. doi: 10.1016/j.celrep.2016.03.019. [DOI] [PMC free article] [PubMed] [Google Scholar]
- Della Torre S., Rando G., Meda C., Stell A., Chambon P., Krust A., Ibarra C., Magni P., Ciana P., Maggi A. Amino acid-dependent activation of liver estrogen receptor alpha integrates metabolic and reproductive functions via IGF-1. Cell Metab. 2011;13:205–214. doi: 10.1016/j.cmet.2011.01.002. [DOI] [PubMed] [Google Scholar]
- DeLuca D.S., Levin J.Z., Sivachenko A., Fennell T., Nazaire M.D., Williams C., Reich M., Winckler W., Getz G. RNA-SeQC: RNA-seq metrics for quality control and process optimization. Bioinformatics. 2012;28:1530–1532. doi: 10.1093/bioinformatics/bts196. [DOI] [PMC free article] [PubMed] [Google Scholar]
- Djouadi F., Weinheimer C.J., Saffitz J.E., Pitchford C., Bastin J., Gonzalez F.J., Kelly D.P. A gender-related defect in lipid metabolism and glucose homeostasis in peroxisome proliferator- activated receptor alpha-deficient mice. J. Clin. Invest. 1998;102:1083–1091. doi: 10.1172/JCI3949. [DOI] [PMC free article] [PubMed] [Google Scholar]
- Dobin A., Davis C.A., Schlesinger F., Drenkow J., Zaleski C., Jha S., Batut P., Chaisson M., Gingeras T.R. STAR: ultrafast universal RNA-seq aligner. Bioinformatics. 2013;29:15–21. doi: 10.1093/bioinformatics/bts635. [DOI] [PMC free article] [PubMed] [Google Scholar]
- Gorski R.A., Wagner J.W. Gonadal activity and sexual differentiation of the hypothalamus. Endocrinology. 1965;76:226–239. doi: 10.1210/endo-76-2-226. [DOI] [PubMed] [Google Scholar]
- Hagve T.A., Christophersen B.O. Sex differences in the metabolism of essential fatty acids studied in isolated rat liver cells. Biochim. Biophys. Acta. 1986;875:655–658. doi: 10.1016/0005-2760(86)90089-5. [DOI] [PubMed] [Google Scholar]
- Horton T.J., Pagliassotti M.J., Hobbs K., Hill J.O. Fuel metabolism in men and women during and after long-duration exercise. J. Appl. Physiol. (1985) 1998;85:1823–1832. doi: 10.1152/jappl.1998.85.5.1823. [DOI] [PubMed] [Google Scholar]
- Ivey P.A., Gaesser G.A. Postexercise muscle and liver glycogen metabolism in male and female rats. J. Appl. Physiol. (1985) 1987;62:1250–1254. doi: 10.1152/jappl.1987.62.3.1250. [DOI] [PubMed] [Google Scholar]
- Kautzky-Willer A., Harreiter J., Pacini G. Sex and gender differences in risk, pathophysiology and complications of type 2 diabetes mellitus. Endocr. Rev. 2016;37:278–316. doi: 10.1210/er.2015-1137. [DOI] [PMC free article] [PubMed] [Google Scholar]
- Khomtchouk B.B., Hennessy J.R., Wahlestedt C. shinyheatmap: ultra fast low memory heatmap web interface for big data genomics. PLoS One. 2017;12:e0176334. doi: 10.1371/journal.pone.0176334. [DOI] [PMC free article] [PubMed] [Google Scholar]
- Konkle A.T., McCarthy M.M. Developmental time course of estradiol, testosterone, and dihydrotestosterone levels in discrete regions of male and female rat brain. Endocrinology. 2011;152:223–235. doi: 10.1210/en.2010-0607. [DOI] [PMC free article] [PubMed] [Google Scholar]
- Kushlan M.C., Gollan J.L., Ma W.L., Ockner R.K. Sex differences in hepatic uptake of long chain fatty acids in single-pass perfused rat liver. J. Lipid Res. 1981;22:431–436. [PubMed] [Google Scholar]
- Li H., Handsaker B., Wysoker A., Fennell T., Ruan J., Homer N., Marth G., Abecasis G., Durbin R. The sequence alignment/map format and SAMtools. Bioinformatics. 2009;25:2078–2079. doi: 10.1093/bioinformatics/btp352. [DOI] [PMC free article] [PubMed] [Google Scholar]
- Livak K.J., Schmittgen T.D. Analysis of relative gene expression data using real-time quantitative PCR and the 2(−ΔΔCt) method. Methods. 2001;25:402–408. doi: 10.1006/meth.2001.1262. [DOI] [PubMed] [Google Scholar]
- Lorbek G., Perse M., Horvat S., Bjorkhem I., Rozman D. Sex differences in the hepatic cholesterol sensing mechanisms in mice. Molecules. 2013;18:11067–11085. doi: 10.3390/molecules180911067. [DOI] [PMC free article] [PubMed] [Google Scholar]
- Love M.I., Huber W., Anders S. Moderated estimation of fold change and dispersion for RNA-seq data with DESeq2. Genome Biol. 2014;15:550. doi: 10.1186/s13059-014-0550-8. [DOI] [PMC free article] [PubMed] [Google Scholar]
- Maggi A., Rando G. Reporter mice for the study of intracellular receptor activity. Methods Mol. Biol. 2009;590:307–316. doi: 10.1007/978-1-60327-378-7_20. [DOI] [PMC free article] [PubMed] [Google Scholar]
- Mauvais-Jarvis F. Sex differences in metabolic homeostasis, diabetes, and obesity. Biol. Sex Differ. 2015;6:14. doi: 10.1186/s13293-015-0033-y. [DOI] [PMC free article] [PubMed] [Google Scholar]
- Mauvais-Jarvis F., Arnold A.P., Reue K. A guide for the design of pre-clinical studies on sex differences in metabolism. Cell Metab. 2017;25:1216–1230. doi: 10.1016/j.cmet.2017.04.033. [DOI] [PMC free article] [PubMed] [Google Scholar]
- Meex R.C.R., Watt M.J. Hepatokines: linking nonalcoholic fatty liver disease and insulin resistance. Nat. Rev. Endocrinol. 2017;13:509–520. doi: 10.1038/nrendo.2017.56. [DOI] [PubMed] [Google Scholar]
- Miller W.L., Bose H.S. Early steps in steroidogenesis: intracellular cholesterol trafficking. J. Lipid Res. 2011;52:2111–2135. doi: 10.1194/jlr.R016675. [DOI] [PMC free article] [PubMed] [Google Scholar]
- Mode A., Gustafsson J.A. Sex and the liver - a journey through five decades. Drug Metab. Rev. 2006;38:197–207. doi: 10.1080/03602530600570057. [DOI] [PubMed] [Google Scholar]
- O'Rahilly S. GDF15 - from biomarker to allostatic hormone. Cell Metab. 2017;26:807–808. doi: 10.1016/j.cmet.2017.10.017. [DOI] [PubMed] [Google Scholar]
- O'Sullivan A.J. Does oestrogen allow women to store fat more efficiently? A biological advantage for fertility and gestation. Obes. Rev. 2009;10:168–177. doi: 10.1111/j.1467-789X.2008.00539.x. [DOI] [PubMed] [Google Scholar]
- O'Sullivan A.J., Martin A., Brown M.A. Efficient fat storage in premenopausal women and in early pregnancy: a role for estrogen. J. Clin. Endocrinol. Metab. 2001;86:4951–4956. doi: 10.1210/jcem.86.10.7941. [DOI] [PubMed] [Google Scholar]
- Plourde P.V., Dyroff M., Dowsett M., Demers L., Yates R., Webster A. ARIMIDEX: a new oral, once-a-day aromatase inhibitor. J. Steroid Biochem. Mol. Biol. 1995;53:175–179. doi: 10.1016/0960-0760(95)00045-2. [DOI] [PubMed] [Google Scholar]
- Price T.B., Sanders K. Muscle and liver glycogen utilization during prolonged lift and carry exercise: male and female responses. Physiol. Rep. 2017;5 doi: 10.14814/phy2.13113. [DOI] [PMC free article] [PubMed] [Google Scholar]
- Regitz-Zagrosek V., Kararigas G. Mechanistic pathways of sex differences in cardiovascular disease. Physiol. Rev. 2017;97:1–37. doi: 10.1152/physrev.00021.2015. [DOI] [PubMed] [Google Scholar]
- Reimand J., Arak T., Adler P., Kolberg L., Reisberg S., Peterson H., Vilo J. g:Profiler - a web server for functional interpretation of gene lists (2016 update) Nucleic Acids Res. 2016;44:W83–W89. doi: 10.1093/nar/gkw199. [DOI] [PMC free article] [PubMed] [Google Scholar]
- Runchey S.S., Boyko E.J., Ioannou G.N., Utzschneider K.M. Relationship between serum circulating insulin-like growth factor-1 and liver fat in the United States. J. Gastroenterol. Hepatol. 2014;29:589–596. doi: 10.1111/jgh.12437. [DOI] [PMC free article] [PubMed] [Google Scholar]
- Spence J.D., Pilote L. Importance of sex and gender in atherosclerosis and cardiovascular disease. Atherosclerosis. 2015;241:208–210. doi: 10.1016/j.atherosclerosis.2015.04.806. [DOI] [PubMed] [Google Scholar]
- Tarnopolsky M.A., Ruby B.C. Sex differences in carbohydrate metabolism. Curr. Opin. Clin. Nutr. Metab. Care. 2001;4:521–526. doi: 10.1097/00075197-200111000-00010. [DOI] [PubMed] [Google Scholar]
- Uranga A.P., Levine J., Jensen M. Isotope tracer measures of meal fatty acid metabolism: reproducibility and effects of the menstrual cycle. Am. J. Physiol. Endocrinol. Metab. 2005;288:E547–E555. doi: 10.1152/ajpendo.00340.2004. [DOI] [PubMed] [Google Scholar]
- Villa A., Della Torre S., Stell A., Cook J., Brown M., Maggi A. Tetradian oscillation of estrogen receptor alpha is necessary to prevent liver lipid deposition. Proc. Natl. Acad. Sci. USA. 2012;109:11806–11811. doi: 10.1073/pnas.1205797109. [DOI] [PMC free article] [PubMed] [Google Scholar]
- Xia J., Wishart D.S. Using metaboanalyst 3.0 for comprehensive metabolomics data analysis. Curr. Protoc. Bioinformatics. 2016;55:14.10.1–14.10.91. doi: 10.1002/cpbi.11. [DOI] [PubMed] [Google Scholar]
Associated Data
This section collects any data citations, data availability statements, or supplementary materials included in this article.