Abstract
Hypermutagenic PCR has been used to simulate pseudogene evolution of the Escherichia coli R67 dihydrofolate reductase gene. Each time the most divergent clone was used as template for another round of hypermutagenesis. After six rounds, with an average mutation rate of 0.05 per base per round, up to a 46% nucleic acid sequence variation was achieved. For a few clones the protein information content could be annihilated. As the intermediates were cloned and sequenced, it was possible to establish the real lineage and compute the true number of mutations. Not surprisingly the true number of forward and back mutations as well as variable sites exceeded those based on comparing any single intermediate to the initial sequence. However, the true number of forward and backward mutations, as well as the number of variable sites, increased linearly with sequence divergence from the original sequence, suggesting an empirical means to correct for branch lengths.
Pseudogene evolution and genome degradation are both descriptions of the same thing: accumulation of mutations under near neutral conditions after an initial inactivating mutation. For vertebrate pseudogenes, the mutation matrix reflects a trend to AT (1); although it is influenced by the general nature of the isochore within which they find themselves (2). For the degradation of the Mycobacterium leprae genome, the general bias of GC → AT substitutions is in opposition to the general maintenance of high GC codon usage (3). The same is true for the Rickettsia prowazekii genome, which has a much lower GC content: The GC content of pseudogenes is generally between those of coding (≈30%) and noncoding (≈24%) regions (4). As pseudogenes are evolving under essentially neutral conditions, they may be useful for establishing phylogenies (5, 6). However, by accumulating mutations rapidly the description of their evolution is more subject to the problems of site saturation and back mutations.
There are numerous techniques allowing the hypermutagenesis of DNA sequences. They invariably rely on DNA polymerization in the presence of highly biased dNTP pools (7, 8) and or the use of dNTP analogs such as 8-oxoguanosine triphosphate (9). Depending on the method, up to 32% of target bases can be substituted (10). The simplest and most robust methods are PCR-based and involve the use of biased dNTP concentrations and a trace of manganese, which increases polymerization after mismatches, notably transversions (7, 8, 11, 12). The overall mutation frequency is tunable, depends on the magnitude of the dNTP pool bias, and may approach 0.1 per base per reaction (8, 12). At lower mutation frequencies, functional genes with up to 6% amino acid substitutions may be identified in a single round (13). At the higher end of the spectrum, the mutational load is so heavy that all variants have lost function (12).
With such a high mutation rate, it becomes possible to make huge jumps through sequence space. By iterating hypermutagenic PCR, it may be possible to substitute a large fraction of bases. Albeit in vitro mutagenesis, this may, to a first approximation, simulate evolution of noncoding DNA or pseudogene sequences. With such a high mutation rate, the frequencies of multiple and back mutations will almost certainly be nonnegligible. If the intermediates are cloned and sequenced, it is possible to establish a precise lineage and hence compare the true number of forward and backward mutations with respect to the observed number inferred from comparing just the initial and final sequences. This is not the case in the natural setting where intermediates are invariably lacking. Precise lineages have been established previously but the degree of sequence variation was very small meaning that the problem of mutations at multiple sites was hardly an issue (14).
Here a lineage of based on the dihydrofolate reductase (DHFR) gene encoded by the Escherichia coli plasmid R67 has been established after six rounds of hypermutagenesis.
Materials and Methods
The primers used for amplification of the R67 DHFR gene have already been described (12, 13). PCRs were carried out in 10 mM Tris⋅HCl (pH 8.3), 50 mM KCl, 2.5 mM MgCl2, 100 pmol of each primer, and 5 units Taq polymerase (Roche). Biased dNTP concentrations are described in Table 1. Reactions were carried out in the presence of 0.5 mM MnCl2, a transition metal known to induce errors during DNA synthesis (7, 11, 15). Input DNA was ≈1 ng of whole plasmid per 100 μl of reaction. Cycling parameters were: 50× (95°C, 30 s, 60°C 30 s, 72°C 10 min). Long elongation times were used to favor extension after mismatches. MnCl2 and dNTPs were from Sigma and Amersham Pharmacia. PCR products were cloned via SacI and BamHI restriction sites in M13mp18RF. Individual colonies were picked and grown as described (12). Recombinants were sequenced by using an Applied Biosystems 373A machine.
Table 1.
dNTP pool biases and mean mutation frequencies
| Round | dNTP/μM
|
Clones sequenced | No. mut.* | Ts/Tv† | N→A, T‡ | N→G, C§ | Mutation frequency¶ | |||
|---|---|---|---|---|---|---|---|---|---|---|
| C | T | A | G | |||||||
| 1 | 30 | 1,000 | 30 | 1,000 | 34 | 755 | 521/234 | 256 | 499 | 10−1 |
| 2 | 30 | 2,000 | 30 | 300 | 29 | 358 | 299/59 | 162 | 196 | 5.3 10−2 |
| 3 | 30 | 1,000 | 30 | 1,000 | 29 | 337 | 227/109 | 232 | 105 | 5 10−2 |
| 4 | 30 | 1,000 | 30 | 1,000 | 10 | 44 | 52/22 | 29 | 15 | 1.8 10−2 |
| 5 | 30 | 2,000 | 30 | 600 | 23 | 158 | 130/28 | 99 | 59 | 2.9 10−2 |
| 6 | 3 | 1,000 | 50 | 50 | 14 | 220 | 162/59 | 217 | 3 | 6.8 10−2 |
Total number of mutations noted compared to input sequence.
Ts/Tv, number of transitions/transversions.
Number of substitutions from non-A->A and non-T->T combined.
Number of substitutions from non-G->G and non-C->C combined.
Average mutation frequency is the number of mutations in a set of n clones divided by n × length of target clone (i.e. 231 bp).
Sequences were aligned by using the program clustalw (16). The tree was derived by neighbor-joining analysis applied to pairwise sequence distances calculated by using the Kimura two-parameter method to generate unrooted trees (17). The final output was generated with treeview (18).
Results and Discussion
Cycling Through Sequence Space.
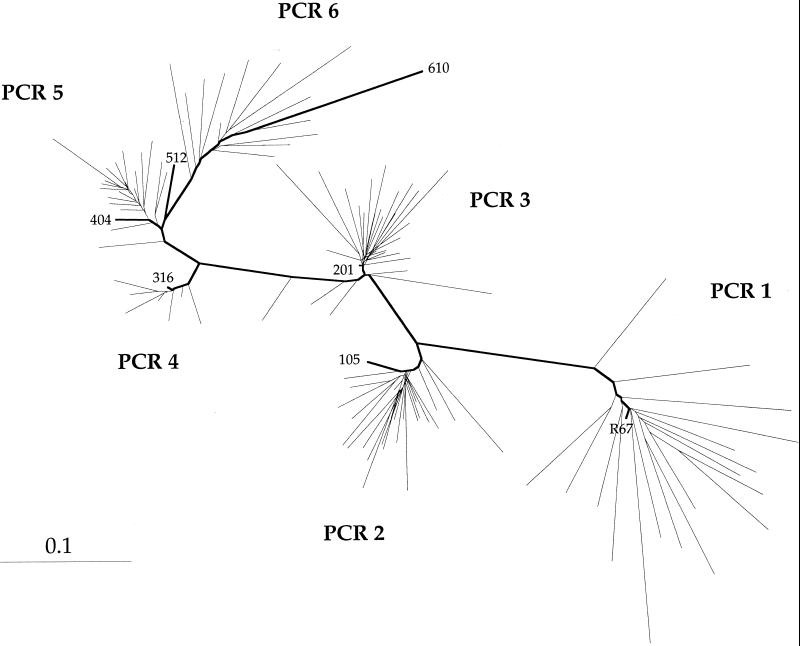
Six cycles of PCR were performed. In each case the products were cloned into M13. Cloning was necessary for the cycling of uncloned products, resulting in preferential amplification of primer-dimers and fragments with large deletions. Between 10 and 34 clones were sequenced per reaction. The substrate for the subsequent cycle of hypermutagenic PCR was always the most mutated clone. In this way a lineage with known intermediates could be established. The average mutation frequency per reaction and other statistics are given in Table 1. As can be seen, biased dNTP concentrations were not held constant throughout in an attempt to prevent enrichment in G + C as well as to test the robustness of the results to changing mutation matrices. The base composition of the most substituted sequence (610) did not differ too greatly from that of the original R67 sequence [T 52/42, −21%; C 60/71, +18%; G 65/73, +12%, and A 54/45, −17% (initial/final base count, percentage change)]. A neighbor-joining tree of the entire collection of 124 sequences is shown in Fig. 1 and illustrates the extent of mutation achieved in six rounds of hypermutagenesis. The most divergent clone was 610, which differed from the R67 sequence at 106 (46%) bases. In general, each new round of hypermutagenesis gave rise to a starburst indicative of the immensity of sequence space. There was evidence of back mutations because the lineage from R67 to 610 was not linear. This is not surprising as the double dNTP pool biases (dTTP>dCTP and dGTP>dATP) generally used produced GC/AT and AT/GC transitions.
Figure 1.
Phylogenetic tree of R67 pseudogenes. Nucleotide sequence distances were determined with dnadist of the phylip package, version 3.5; calculated distance was then used by neighbor to generate unrooted trees. These computed distances were used for the construction of pogenetic trees by using neighbor. The final output was generated with treeview. Sequences were rooted on R67 sequence. Branch lengths are proportional to the number of base substitutions separating related sequences. The shortest path length from R67 to sequence 610 via all five intermediates (105, 201, 316, 404, and 512) is shown in bold.
Determining the True Number of Mutations.
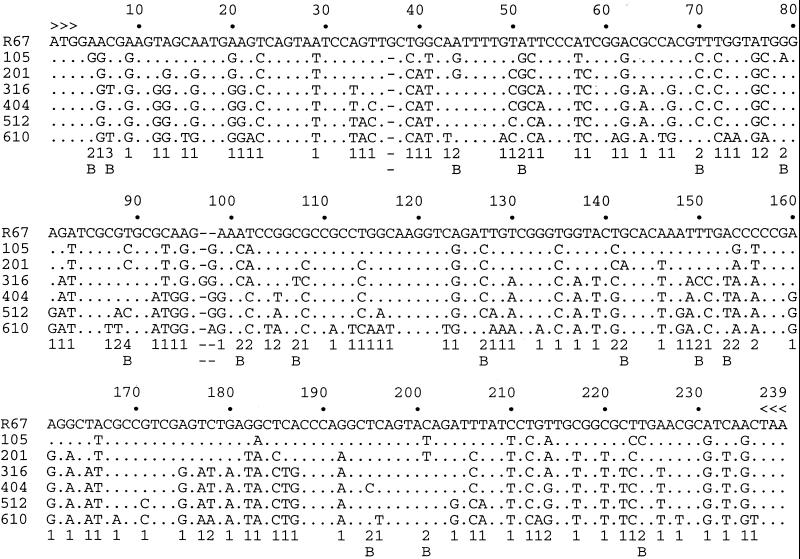
The nucleotide sequences of the R67 to 610 lineage, along with the five intermediates, clones 105, 201, 316, 404, and 512, are shown in Fig. 2. The vast majority of mutations were point substitutions: there being only four single base frameshifts, two deletions and two insertions. Of the 121 (or 53% of a total of 231) truly variable sites, 96 were substituted just once. Of the 23 sites bearing two substitutions, 14 involved a forward followed by a back mutation, whereas nine involved two forward mutations. Given that two forward mutations must involve at least one transversion and that transitions always outnumber transversions (Table 1), it is not surprising that sites bearing forward/backward substitutions were more numerous than those bearing two forward mutations. Positions 7 and 89 are worth noting. Both involve series of pyrimidine transitions (C → T → C → T and T → C → T → C → T, respectively). Position 89 in sequence 610 would have been considered an invariant site had not all of the intermediates been available.
Figure 2.
R67 pseudogenes used for iterative hypermutagenesis. Only differences with respect to the R67 reference sequence are shown. Dashes (-) represents gaps introduced to align the sequences. The arrowheads denote the extremities of the PCR primers. Variable sites are indicated by the number of substitutions (1–4). Sites harboring back mutations are emphasized by the letter B. Sites 7 and 89 reveal series of pyrimidine transitions.
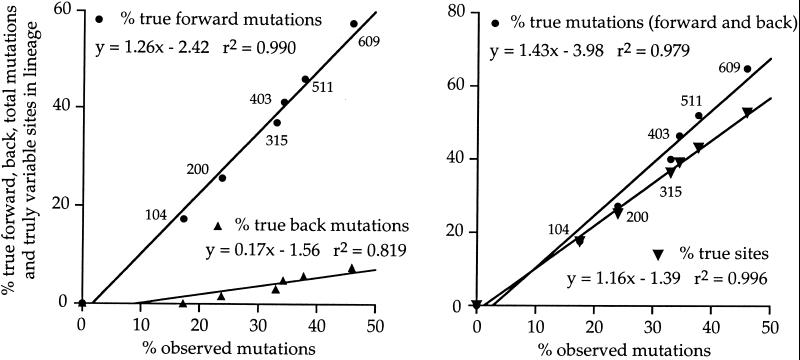
Overall there was a total of 149 true point mutations (132 forward mutations and 17 back mutations) in the lineage to clone 610 even though there were only 106 differences between R67 and 610. In other words, without knowing the lineage the number of mutations was considerably underestimated. Equally, the true number of variable sites was 121 as opposed to 106. Similar statistics were calculated for all of the intermediates and are shown graphically in Fig. 3. The fraction of true forward and backward mutations, their sum and fraction of true number of sites carrying substitutions increased linearly with the number of mutations deduced from comparing any one sequence to the R67 reference, even out to 46% nucleic acid sequence divergence. The gradients show that the true number mutations in the lineage were generally 43% greater than could be surmised from comparing two sequences. This number can be decomposed into a ≈26% excess of forward and ≈17% back mutations. Obviously back mutations explain why there were more variable sites in the lineage that deduced from comparing the original and final sequences.
Figure 3.
The relationship between the true and observed numbers of mutations and variable sites in a lineage. For each intermediate, the percentage of observed nucleotide substitutions with respect to R67 is given on the abscissa. On the ordinate are the true percentages of forward, back, and total mutations in the lineage to the intermediate sequence as well as the true percentage of variable sites. Whether it be any of these variables, there was a linear relationship with those numbers computed by simply comparing any intermediate sequence to the R67 reference—i.e., by ignoring the lineage.
If it is considered that all sites are equally probable of accepting mutations, that the sites are independent, and that the probability of all mutations are the same, then the expected distribution would be N(1 mutation) = 78, N(2) = 25, N(3) = 5.4, N(4) = 0.8, and N(≥5) = 1.6 (for a total of 109.2 sites and 149 point mutations). The observed distribution was N(1) = 96, N(2) = 23, N(3) = 1, and N(4) = 1 (for a total of 121 sites and 149 point mutations). Given the simplifying assumptions inherent in calculating the expected frequencies, e.g., transitions and transversions were not distinguished, the distributions are similar suggesting that, to a first approximation, the accumulation of mutations throughout the lineage was near random.
Given the known lineage, it has been possible to define the true number of mutations and variable sites in a lineage. In both cases they exceed the number derived from comparing a pair of sequences. In the case of variable sites the difference is explained by back mutations, their frequency being approximately one-half of the excess of forward mutations. What was unexpected was the linear relationship between the proportions of true mutations, whether they be forward or back, and variable sites with respect to the observed proportion calculated not knowing all of the intermediates. This suggests a simple empirical means to correcting branch lengths. Although the generality of the observation remains to be explored, it may be anticipated that another lineage using a completely different gene sequence as starting point would yield a linear relationship between the true and observed number of mutations. This follows from the robustness of the finding to differences in the dNTP pool biases and the variable transition/transversion ratios. The crucial unknown would be whether the gradient was of comparable magnitude. Because the base composition of the target R67 sequence is fairly balanced (22.5% T, 26% C, 28% G, and 23.4% A), it might be anticipated that a PCR-based method might produce a comparable result provided the initial base composition of the gene was not too asymmetric. Whether such a situation pertains to the evolution of a functional lineage remains to be determined.
As an aside, it was possible to compute the values for synonymous (ds) and nonsynonymous (dn) substitutions, normalized to the number of ds and dn sites and see whether, in the absence of any selection, ds/dn ≈ 1 as anticipated from theory. For all of the intermediates in Fig. 2, with respect to R67, the mean ds/dn ratio was 0.79 (range 0.64–0.93). Without knowing the experimental details these ds/dn values, all <1, would be interpreted as evidence of positive selection. Yet this is not possible. It would seem that depending on the mutation matrix ds/dn ratios <1 are possible in a random setting. It would seem that very low or large values of ds/dn are necessary before concluding prima facie evidence of selection.
Annihilation of Information Content.
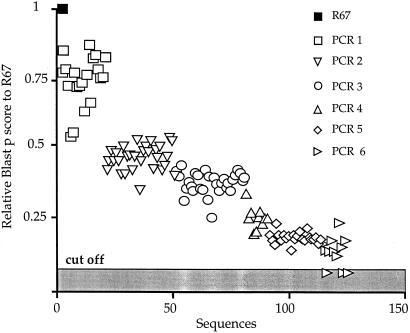
Turning to protein sequences, albeit defective, each was used in a blast search of the databases (19). The blast protein scores for the clones were ordered and are shown in Fig. 4. Those for three clones from the sixth hypermutagenic PCR were below the cut off. In other words, the protein sequence had been substituted beyond recognition. Hypermutagenesis is so powerful that, within a handful of rounds, it is possible to annihilate the information content of a gene to the point that some sequences in protein form could not be identified in a blast protein search. Of course, a few more rounds could have been performed so pushing the lineage further, perhaps to the point where even vestiges of nucleic acid identity would be lost.
Figure 4.
Annihilation of the information by scoring to R67. Variants from hypermutagenic PCR blast protein highest score to the database with R67 DHFR vs. the number of sequences.
Formally the simulation can only be qualitative for the mutation matrices used were not constant, result from the use of dNTP pool biases and manganese as cofactor, reflect the inherent biases of Taq polymerase, and have not been subjected to proofreading or mismatch repair. However, strong dNTP pool biases are able to provoke retroviral G → A hypermutation in vivo (20) as well as numerous GC/AT transitions in chromosomal genes ex vivo (21). Furthermore the proportion of indels, 3 for 121 observed mutations in the final sequence was comparable to the statistics for mutation in nuclear mitochondrial pseudogenes, or numts (≈1/40–1/100) (22, 23).
These observations simulate pseudogene evolution or, for that matter, any noncoding DNA sequence that is not under strong selection. The mutation matrix can be manipulated by altering the dNTP pool biases. For example, a single dTTP/dCTP bias could simulate the degradation evident in the M. leprae or R. prowazekii genomes where pseudogenes are less GC rich than the functional genes (3, 5) or even mammalian pseudogenes in general (1). As the fixation rate of neutral mutations equals the product of the mutation rate and the number of rounds of replication, correcting empirically for back and multiple mutations allows more precise estimation of the mean number of generations in a lineage. If the R67 pseudogene simulation is at all appropriate, the number of generations would be underestimated by something of the order of 50%.
Acknowledgments
We thank Etienne Larsabal for statistical analyses. This work was supported by grants from Institut Pasteur and l'Agence Nationale pour la Recherche sur le SIDA.
Abbreviations
- DHFR
dihydrofolate reductase
- ds
synonymous
- dn
nonsynonymous
Footnotes
This paper was submitted directly (Track II) to the PNAS office.
References
- 1.Gojobori T, Li W-H, Graur D. J Mol Evol. 1982;18:360–369. doi: 10.1007/BF01733904. [DOI] [PubMed] [Google Scholar]
- 2.Francino M P, Ochman H. Nature (London) 1999;400:30–31. doi: 10.1038/21804. [DOI] [PubMed] [Google Scholar]
- 3.Cole S T, Eiglmeier K, Parkhill J, James K D, Thomson N R, Wheeler P R, Honore N, Garnier T, Churcher C, Harris D, et al. Nature (London) 2001;409:1007–1011. doi: 10.1038/35059006. [DOI] [PubMed] [Google Scholar]
- 4.Andersson S G, Zomorodipour A, Andersson J O, Sicheritz-Ponten T, Alsmark U C, Podowski R M, Naslund A K, Eriksson A S, Winkler H H, Kurland C G. Nature (London) 1998;396:109–110. doi: 10.1038/24094. [DOI] [PubMed] [Google Scholar]
- 5.Andersson J O, Andersson S G. Mol Biol Evol. 1999;16:1178–1191. doi: 10.1093/oxfordjournals.molbev.a026208. [DOI] [PubMed] [Google Scholar]
- 6.Bensasson D, Zhang D, Hartl D L, Hewitt G M. Trends Ecol Evol. 2001;16:314–321. doi: 10.1016/s0169-5347(01)02151-6. [DOI] [PubMed] [Google Scholar]
- 7.Leung D, Chen E, Goeddel D. Technique (Philadelphia) 1989;1:11–15. [Google Scholar]
- 8.Fromant M, Blanquet S, Plateau P. Anal Biochem. 1995;224:347–353. doi: 10.1006/abio.1995.1050. [DOI] [PubMed] [Google Scholar]
- 9.Zaccolo M, Williams D M, Brown D M, Gherardi E. J Mol Biol. 1996;255:589–603. doi: 10.1006/jmbi.1996.0049. [DOI] [PubMed] [Google Scholar]
- 10.Martinez M A, Vartanian J P, Wain-Hobson S. Proc Natl Acad Sci USA. 1994;91:11787–11791. doi: 10.1073/pnas.91.25.11787. [DOI] [PMC free article] [PubMed] [Google Scholar]
- 11.Beckman R A, Mildvan A S, Loeb L A. Biochemistry. 1985;24:5810–5817. doi: 10.1021/bi00342a019. [DOI] [PubMed] [Google Scholar]
- 12.Vartanian J P, Henry M, Wain-Hobson S. Nucleic Acids Res. 1996;24:2627–2631. doi: 10.1093/nar/24.14.2627. [DOI] [PMC free article] [PubMed] [Google Scholar]
- 13.Martinez M A, Pezo V, Marlière P, Wain-Hobson S. EMBO J. 1996;15:1203–1210. [PMC free article] [PubMed] [Google Scholar]
- 14.Hillis D M, Bull J J, White M E, Badgett M R, Molineux I J. Science. 1992;255:589–592. doi: 10.1126/science.1736360. [DOI] [PubMed] [Google Scholar]
- 15.Goodman M F, Keener S, Guidotti S, Branscomb E W. J Biol Chem. 1983;258:3469–3475. [PubMed] [Google Scholar]
- 16.Thompson J, Higgins D, Gibson T. Nucleic Acids Res. 1994;22:4673–4680. doi: 10.1093/nar/22.22.4673. [DOI] [PMC free article] [PubMed] [Google Scholar]
- 17.Felsenstein J. Cladistics. 1989;5:164–166. [Google Scholar]
- 18.Page R D M. Comput Appl Biosci. 1996;12:357–358. doi: 10.1093/bioinformatics/12.4.357. [DOI] [PubMed] [Google Scholar]
- 19.Altschul S F, Madden T L, Schaffer A A, Zhang J, Zhang Z, Miller W, Lipman D J. Nucleic Acids Res. 1997;25:3389–3402. doi: 10.1093/nar/25.17.3389. [DOI] [PMC free article] [PubMed] [Google Scholar]
- 20.Vartanian J P, Plikat U, Maheux R, Guillemot L, Meyerhans A, Wain-Hobson S. J Mol Biol. 1997;270:139–151. doi: 10.1006/jmbi.1997.1104. [DOI] [PubMed] [Google Scholar]
- 21.Meuth M. Exp Cell Res. 1989;181:305–316. doi: 10.1016/0014-4827(89)90090-6. [DOI] [PubMed] [Google Scholar]
- 22.Ophir R, Graur D. Gene. 1997;205:191–202. doi: 10.1016/s0378-1119(97)00398-3. [DOI] [PubMed] [Google Scholar]
- 23.Mighell A J, Smith N R, Robinson P A, Markham A F. FEBS Lett. 2000;468:109–114. doi: 10.1016/s0014-5793(00)01199-6. [DOI] [PubMed] [Google Scholar]


