

Abstract
We have compared the efficacy of continuous ultraviolet (UV‐C) (254 nm) and pulsed UV light in reducing the viability of Salmonella Enteritidis, Listeria monocytogenes, Staphylococcus aureus, enterohemorrhagic Escherichia coli, Pseudomonas spp., Brochothrix thermospacta, Carnobacterium divergens, and extended‐spectrum β‐lactamase producing E. coli inoculated on chicken fillet surface. Fluences from 0.05 to 3.0 J/cm2 (10 mW/cm2, from 5 to 300 s) used for UV‐C light resulted in average reductions from 1.1 to 2.8 log cfu/cm2. For pulsed UV light, fluences from 1.25 to 18.0 J/cm2 gave average reductions from 0.9 to 3.0 log cfu/cm2. A small change in the odor characterized as sunburnt and increased concentration of volatile compounds associated with burnt odor posed restrictions on the upper limit of UV treatment, however no sensory changes were observed after cooking the meat. Treatments under modified atmosphere conditions using a UV permeable top film gave similar or slightly lower bacterial reductions.
Practical applications
Ultraviolet (UV) light may be used for decontaminating the surface of food products and reduce viability of pathogenic and spoilage bacteria. Exposure of raw chicken fillet surface to various doses of continuous UV‐C or pulsed UV light proposed in the present work represent alternatives for microbiological improvement of this product. Chicken fillets can be treated in intact packages covered with UV permeable top film, thus avoiding recontamination of the meat. UV‐C light treatment is a low cost strategy with low maintenance, whereas pulsed UV light involves more elaborate equipment, but treatment times are short and less space is required. Both methods can be helpful for producers to manage the safety and quality of chicken fillets.
1. INTRODUCTION
The desired long shelf life in today's food industry has led to increasing demands in the development of methods for improving microbial safety and quality. According to the Food and Agriculture Organization of the United Nations (FAO), the average annual consumption of chicken meat pro capita worldwide increased from 10.2 kg in 1999 to 13.8 kg in 2015 (FAO, 2015). The global meat consumption is projected to rise more than 4% per person over the next 10 years, and for poultry it is predicted to rise more than 10% (Organisation for Economic Co‐operation and Development/Food and Agriculture Organization of the United Nations, 2016). As live poultry animals contain microorganisms on their skin, feathers, and in their digestive tract, contamination of the carcasses during slaughtering procedures cannot be completely avoided when live animals are converted to meat for consumption.
Food contamination is a major global burden because of foodborne illnesses that can result from it. Poultry may be the vector of Salmonella spp., Campylobacter spp., Staphylococcus aureus, Listeria monocytogenes, Shiga toxin‐producing Escherichia coli, and other pathogens (Capita, Alonso‐Calleja, Garcia‐Fernandez, & Moreno, 2002; Hafez, 1999; Zhao et al., 2001). The first two mentioned are the most common causes of human foodborne bacterial diseases linked to poultry (European Food Safety Authority [EFSA], 2015; Hafez, 2005). According to the Community Summary Reports of the EFSA and the European Centre for Disease Prevention and Control, 2008, campylobacteriosis and salmonellosis accounted for 214,779 and 82,694, respectively, confirmed human cases in the EU (EFSA, 2015). The number of confirmed listeriosis cases in humans was 1,763, where a high fatality rate of 15.6% was reported among the cases. Antibiotic‐resistant bacteria, such as the extended‐spectrum beta‐lactamase (ESBL)‐producing E. coli, have become a growing public health threat (Briongos‐Figuero et al., 2012; Lu et al., 2012; Picozzi et al., 2013; Pitout, 2010). The ESBL‐producing strains are feared as they produce the enzyme beta‐lactamase that has the ability to break down commonly used antibiotics like penicillins and cephalosporins, and render them ineffective for treatment. In 2014, the World Health Organization (WHO) warned that the antibiotic resistance crisis is becoming dire, with diseases that have been curable for decades becoming increasingly difficult to treat (Michael, Dominey‐Howes, & Labbate, 2014; WHO, 2014). The presence of ESBL genes has been clearly documented in Enterobacteriaceae isolated from food‐production animals, and especially from chickens (Machado, Coque, Canton, Sousa, & Peixe, 2008; Overdevest et al., 2011; Smet et al., 2008). Occurrence of cephalosporin‐resistant E. coli on poultry in Norway ranged from 8 to 43% (Mo et al., 2014).
Food rendered unfit for human consumption because of product spoilage results in significant economic losses when products must be removed from the market. The accumulation of metabolic by‐products or the action of extracellular enzymes produced by spoilage bacteria multiplying on these foods, leads to deterioration like discoloration, texture change, and formation of off‐flavors, off‐odors, and slime. The meat acquires an offensive odor when the bacterial flora reaches about 107 cfu/cm2 of the surface, and when reaching 108 cfu/cm2, the surface becomes slimy (Borch, Kant‐Muermans, & Blixt, 1996; Holck, Pettersen, Moen, & Sorheim, 2014; Molin, 2000). The natural microflora on chicken fillets has been identified (Holck et al., 2014), and common spoilage microorganisms when stored aerobically at 4°C are Pseudomonas spp., Brochothrix spp., and Enterobacteriaceae. A widely used strategy for increasing shelf life of poultry meat is modified atmosphere packaging (MAP) (Holck et al., 2014; van Velzen & Linnemann, 2008). Storage with high CO2 (70% CO2, 30% N2) can lead to lactic acid bacteria like carnobacteria dominating the flora (Holck et al., 2014; Vihavainen et al., 2007). Although some strains of carnobacteria show little influence on the sensory properties of a product, others can spoil the product (Laursen et al., 2005; Leisner, Laursen, Prevost, Drider, & Dalgaard, 2007).
Various physical and chemical methods to reduce microbes on poultry products have been studied, such as water spraying, air chilling, ultrasound, irradiation, trisodium phosphate, and lactic acid (Capita et al., 2002; Loretz, Stephan, & Zweifel, 2010). Potential disadvantages using these methods are sensory changes, deterioration of product appearance and quality, and safety concerns. In recent years, there has been a growing interest in using ultraviolet (UV) light for decontamination of poultry. UV light is widely known for its germicidal effect by damaging nucleic acids (Kowalkski, 2009). The high energy associated with short‐wavelength UV energy (UV‐C), primarily at 254 nm, is absorbed by cellular RNA and DNA. This energy absorption initiates a reaction between adjacent pyrimidine bases to form dimer lesions, which in turn inhibit replication and transcription in cells (Harm, 1980; Weber, 2005).
As a means for controlling surface microorganisms on food products, regulations in conjugation with using conventional continuous UV‐C light (henceforth referred to as UV‐C light) in the United States are given by the U.S. Food and Drug Administration (FDA) (FDA, 2010). UV‐C light can be employed in Europe, however, in Germany the use is limited to water, fruit and vegetable products, and stored hard cheeses (Anonymous, 2000). Decontamination of raw boneless, skinless chicken, or broiler breast fillets by the use of UV‐C light has been reported to reduce bacterial counts of various pathogens by 0.6 to 1.7 log depending on the conditions used (Chun, Kim, Lee, Yu, & Song, 2010; Haughton et al., 2011b; Isohanni & Lyhs, 2009; Sommers, Scullen, & Sheen, 2016). High intensity pulsed UV light has been approved by the FDA up to 12 J/cm2 (FDA, 2010). The UV energy spectrum of pulsed UV light consists of a continual broadband spectrum from deep UV to infrared light, especially rich in UV range below 400 nm, which is germicidal. In addition to creating dimer lesions, pulsed UV light has been proposed to cause cell damage and cell death by inducing damage of the cell membrane and to cause rupture of the bacteria by thermal stress (Krishnamurthy, Tewari, Irudayaraj, & Demirci, 2010; Takeshita et al., 2003; Wekhof, 2000). The use of this technology for food decontamination has previously been reviewed (Demirci & Panico, 2008; Gomez‐Lopez, Ragaert, Debevere, & Devlieghere, 2007). Pathogen reduction on boneless skinless chicken breast has been reported to vary from 1.2 to 2.4 log depending on the conditions used (Keklik, Demirci, & Puri, 2010; Paskeviciute, Buchovec, & Luksiene, 2011). Several investigations have demonstrated the effectiveness of UV light on microbial reduction in vitro, and a wide range of bacterial species were reduced by 5–7 log when treated on petri dishes under different conditions (Farrell, Garvey, Cormican, Laffey, & Rowan, 2010; Gomez‐Lopez, Devlieghere, Bonduelle, & Debevere, 2005; Paskeviciute et al., 2011; Rowan et al., 1999).
The objective of our investigation was to study and compare the efficacy of UV‐C and pulsed UV light against pathogens and bacteria often found as natural contaminants on fresh chicken meat, of which several of the species have not previously been investigated for UV light treatment on food. To our knowledge, studies on UV light exposure of intact packages of MAP‐chicken fillet for bacterial reduction have not been reported, thus we aimed at undertaking this issue using a UV permeable top film. We also aimed at determining whether the UV light treatments had adverse effects on the sensory quality of chicken fillets.
2. MATERIALS AND METHODS
2.1. Bacterial strains, media, and growth conditions
The bacterial strains used in this work are listed in Table 1. The strains were maintained at −80°C in their respective media supplemented with 20% glycerol (vol/vol). Rifampicin resistant (RifR) derivatives were prepared for all isolates by growing strains in liquid media containing 200 µg/ml rifampicin as described by Heir et al. (2010), except for the ESBL‐producing E. coli strains already resistant to several types of antibiotics. Growth experiments using a Bioscreen C instrument (Labsystems) where the Optical Density (OD) at 600 nm was monitored, showed no significant difference in growth between the original strains and their RifR mutants in their respective media and growth conditions. The different bacterial strains of each species were cultured separately. Carnobacterium divergens was grown in cystein‐deMan Rogosa Sharpe broth (cMRS, Oxoid) with 200 µg/ml rifampicin (Sigma‐Aldrich; 48 hr incubation, 30°C), ESBL‐producing E. coli in Brain Heart Infusion broth (BHI; Oxoid) with 50 µg/ml ampicillin (Sigma‐Aldrich; 16 hr incubation, 37°C), and tryptic soy broth (TSB, Oxoid) with 200 µg/ml rifampicin was used for Pseudomonas spp. (16 hr incubation, 30°C), Brochothrix thermospacta (48 hr incubation, 30°C), Salmonella Enteritidis, L. monocytogenes, S. aureus, and EHEC (16 hr incubation, 37°C). Before decontamination experiments, bacterial cultures of each of the different strains of the same species were mixed in equal amounts, for example, bacterial cultures of each of the four strains of L. monocytogenes were mixed 1:1:1:1. An exception was E. coli, for which the ESBL‐producing E. coli strains and the EHEC strains were separated from each other.
Table 1.
Strains used in this study
| Bacterial species | Strain name a | Reference/source/strain/other |
|---|---|---|
| Pseudomonas spp. | MF6041 | Chicken fillet |
| MF6042 | Chicken fillet | |
| MF6043 | Chicken fillet | |
| MF6044 | Chicken fillet | |
| B. thermospacta | MF6045 | Chicken |
| MF6047 | Chicken | |
| MF6049 | ATCC11509 b | |
| C. divergens | MF3036 | DSM20623 c |
| MF6031 | Chicken fillet | |
| MF6032 | Chicken fillet | |
| MF6034 | Chicken fillet | |
| MF6038 | Chicken fillet | |
| ESBL‐producing E. coli | MF5658 | Chicken d |
| MF5660 | Chicken d | |
| MF5664 | Chicken d | |
| MF5670 | Broiler d | |
| MF5674 | Broiler d | |
| S. Enteritidis | MF3817 | 1049‐1‐99 d |
| MF3818 | Poultry, 61–358‐1 e | |
| MF3824 | ATCC13076 b | |
| L. monocytogenes | MF3508 | 2230/92 (Nesbakken, 1995) |
| MF3509 | 167 (Blom et al., 1997) | |
| MF3510 | 187 (Blom et al., 1997) | |
| MF3571 | EGD‐e (Glaser et al., 2001) | |
| S. aureus | MF2123 | ATCC25923 b |
| MF2124 | ATCC12600 b | |
| MF2125 | ATCC6538 b | |
| Enterohemorrhagic E. coli (EHEC) | MF3572 | O103, fermented sausage, linked to outbreak in Norway 2006 (Schimmer et al., 2008) f |
| MF3574 | ATCC43895 b , O157:H7 | |
| MF3576 | O111:H‐, semi‐dry fermented sausage, outbreak Australia 1995 (Paton et al., 1996) g | |
| MF5554 | O145 (McLeod et al., 2016) |
aAntibiotic resistant strains. All strains were grown in their respective medium with 200 µg/ml rifampicin, except ESBL‐producing E. coli grown in medium with 50 µg/ml ampicillin.
bATCC, American Type Culture Collection, Manassas, VA, USA.
cDSM, Deutsche Sammlung von Microorganismen und Zellkulturen, Braunschweig, Germany.
dKindly received from the Norwegian Veterinary Institute, Oslo, Norway.
eKindly received from the Technical University of Denmark, the National Veterinary Institute, Denmark.
fKindly received from the Norwegian School of Veterinary Science, Oslo, Norway.
gKindly received from Statens Serum Institut, Copenhagen, Denmark.
2.2. UV illumination experiments of chicken and agar surface inoculated with bacterial cells
Fresh skinless chicken breast fillets were purchased from local Norwegian supermarkets. The meat was cut into pieces of 10 cm2, and one side of the chicken was inoculated by spreading 15 µL suspension of a multi strain mix of one species (described above) to obtain bacterial levels of 105–107 cfu/cm2. The inoculated chicken samples were left at room temperature to dry for 1 hr prior to UV light treatment. To assess the indigenous background flora of the chicken, uninoculated samples were also analyzed. For in vitro illumination experiments, serial 10‐fold dilutions of each multi strain mix were made and plated onto the respective agar media (described below). In the UV‐C light experiments, samples were treated in a custom made aluminum chamber (1.0 × 0.5 × 0.6) m3 equipped with two UV‐C lamps (UV‐C Kompaktleuchte, 2x95 W, BÄRO GmbH, Leichlingen, Germany) in the ceiling. The UV‐C light was emitted essentially at 253.7 nm, measured using a UVX Radiometer (Ultra‐Violet Products, Ltd., Cambridge, UK) equipped with a UV‐C sensor (model UVX‐25, Ultra‐Violet Products). Both sample distance (6 cm) from the lamps and duration of the exposures were chosen with aim to be relevant for industrial production lines. Exposures were thus at 10 mW/cm2, which is close to a maximum when using commercial lamps, for 5, 10, 30, 60, or 300 s, giving fluences of 0.05, 0.1, 0.3, 0.6, 3.0 J/cm2, respectively. For the pulsed UV light experiments, a semiautomated intense pulsed UV system instrument XeMaticA‐SA1L (SteriBeam Systems GmbH, Kehl‐Kork am Rhein, Germany) was used. Samples were placed in the instrument chamber at a 6.5 cm distance from the xenon lamp (19 cm), which was water cooled, had an aluminum reflector (10 cm × 20 cm), and the spectral distribution was 200–1,100 nm, with up to 45% of the energy being in the UV‐region (maximal emission at 260 nm). The fluences were set according to the manufacturers specifications, and were adjusted to 1.25 J/cm2 (low) or 3.6 J/cm2 (high). The lowest level of exposure would result in limited bacterial reductions, and fluences up to and above the limit value of 12 J/cm2, which is the maximum permitted dose by FDA (FDA, 2010), were tested. Samples were exposed either once to the low pulse, or one, three, or five times to the high pulse (3.6, 10.8, or 18.0 J/cm2, respectively). Three parallels of both treated samples and untreated controls were produced for each experiment, and the experiments were repeated three times on different days.
For ESBL‐producing E. coli and C. divergens, UV light treatments were also performed under modified atmosphere conditions as follows: Chicken sample with inoculated bacteria placed in a tray was packaged using a Polimoon 511VG tray sealing machine (RPC Promens AS, Kristiansand, Norway) and UV permeable top film with 65 µm thickness and an ethylene vinyl alcohol (EVOH) barrier layer (Opalen 65, Bemis, Oshkosh, WI). A gas mixture of 60% CO2 and 40% N2 (AGA, Oslo, Norway) was used for the packages. The film had an oxygen transmission rate (OTR) of 5 ml/m2/24 hr/atm at 23°C/50% RH, and the trays of dimension 208 × 146 × 32 mm had a barrier layer of high density polyethylene (HDPE; RPC Promens 528) with an OTR of 3.5 ml/m2/24 hr/atm at 23°C/50% RH. Intact packages (MAP‐chicken) were exposed to UV light doses similar to the chicken samples treated in air (unpackaged chicken), allowing for comparison of bacterial reduction between the two. Three parallels of both treated samples and untreated controls were produced for each experiment. The experiments were repeated three times on different days.
Temperatures were measured using a Raynger MX infrared thermometer (Raytek Corporation, Santa Cruz, CA). Samples were subjected to microbial and physiochemical analyses as described below. The experiments with pathogens were performed in a Biosafety level 3 pilot plant.
2.3. Microbial analyses
Chicken samples were added 90 ml of peptone water and the samples were homogenized for 1 min in a stomacher (AES Smasher, AES Chemunex, Bruz, France). Serial 10‐fold dilutions from each sample were prepared. Quantification of C. divergens (cfu/cm2) was performed using a Whitley Automatic Spiral Plater (Don Whitley Scientific, Ltd., West Yorkshire, UK) on cMRS agar (Oxoid) with 200 µg/ml rifampicin (48 hr incubation, 30°C), ESBL‐producing E. coli on BHI (Oxoid) with 50 µg/ml ampicillin (16 hr incubation, 37°C), and tryptic soy agar (TSA, Oxoid) with 200 µg/ml rifampicin was used for Pseudomonas spp. (16 hr incubation, 30°C), B. thermospacta (48 hr incubation, 30°C), S. Enteritidis, L. monocytogenes, S. aureus, and EHEC (16 hr incubation, 37°C). The number of colonies were determined using an automatic plate reader, and the detection limit was 20 cfu/cm2. Since rifampicin resistant strains were used, the indigenous background flora on the chicken was negligible.
2.4. Packaging film analyses
The UV permeable top film Opalen 65 was evaluated for its ability to transmit UV light by measuring UV light at 254 nm (described above). The extended O2 barrier properties of the top film was evaluated by using empty packages with 100% N2 that were initially exposed to four different UV‐C and pulsed UV light treatments up to 10.8 J/cm2 in addition to an untreated control, with five packages per treatment. The packages were analyzed for concentrations of residual oxygen at packaging and after 21 days of storage with a Dansensor Checkmate 3 (Dansensor, Ringsted, Denmark). The top films of the trays used for oxygen analysis were also evaluated for structural damages by UV light by scanning electron microscopy, where the samples were mounted on an aluminum stub using double‐sided tape coated with carbon, before being coated with gold/palladium using a SC7640 auto/manual high resolution sputter coater (Quorum Technologies, Ashford, UK). An EVO‐50‐EP environmental scanning electron microscope (Zeiss, Cambridge, UK) was used to study the samples at a magnification of 8000×.
2.5. Preparation of chicken samples for sensory analyses
Refrigerated fresh skinless chicken breast fillets obtained from a local producer were mixed to achieve an equal number of cfu per cm2 on the surface. One set of chicken samples were exposed to UV light in air (unpackaged chicken), and were thereafter packaged in modified atmosphere, while a parallel set of chicken samples were exposed to UV light under modified atmosphere (MAP‐chicken), as described above. None of these chicken samples were inoculated with bacterial culture, and both sample sets were then stored at 4°C for 6 days before being used for the sensory analyses described below. The color stability of the chicken fillets were evaluated by visual inspection of the chicken before and after UV light exposure, and after storage.
2.6. Sensory evaluations
Descriptive sensory profiling was conducted by a trained sensory panel of 10 assessors at Nofima AS, Norway, according to Generic Descriptive Analysis (Lawless & Heymann, 2010). All panelists were selected and trained in accordance with ISO 8586:2012 (International Organisation for Standardisation, 2007). The following chicken samples treated in air and under modified atmosphere were prepared: untreated control, chicken exposed to UV‐C at fluence 0.1 J/cm2 (10 s at 10 mW/cm2), chicken exposed to UV‐C at fluence 0.6 J/cm2 (60 s at 10 mW/cm2), chicken exposed to pulsed UV light at low intensity at fluence 1.25 J/cm2 and chicken exposed to pulsed UV light three times at high intensity giving a fluence of 10.8 J/cm2. Based on a pretrial performed by the panelists, a consensus list of attributes for the profiling was developed: Smell of raw chicken (sour odor, sunburnt odor, burnt odor, metallic odor, sulfur odor, off‐odor, cloying odor, and rancid odor) and odor/taste/flavor of cooked chicken (sunburnt odor, burnt odor, sour flavor, burned flavor, metallic flavor, off‐flavor, cloying flavor, and rancid flavor). Both raw and cooked chicken fillet samples were evaluated. For the raw samples, the panelists were given 1/6 raw chicken fillet served at room temperature on white plastic cups coded by random three‐digit numbers. The cooked samples were heated (100°C, 100% steam, 30 min) in an Electrolux Air‐o‐steam oven (Combi LW 6 GN 1/1 Gas) to a core temperature of 78°C ± 3°C. After heating, the samples rested for 5 min before each panelist were served one‐fourth cooked chicken fillet in a white porcelain bowl with lid marked with a random three‐digit number, that had been preheated at 65°C. Samples were kept at 65°C for the evaluation. The panelists had unsalted crackers and lukewarm water for rinsing the palate between samples. The coded samples were evaluated in duplicate and served randomized according to sample, panelist, and replicate. Each panelist recorded their results at individual speed using an unstructured line scale with labeled endpoints ranging from no intensity (1), to high intensity (9), using the EyeQuestion Software (Logic8 BV, Elst, The Netherlands) for direct recording of data.
Changes in the quality or sensory properties of raw chicken as a result of UV light exposure were also assessed by a smaller consumer test. Twenty randomly chosen test persons were asked if they would want to use the chicken samples for dinner. In addition, they assessed the quality of the chicken on a scale ranging from very bad (1), to very good (9).
2.7. Dynamic headspace gas chromatography mass spectrometry
The same set of raw chicken samples used in the pretrail sensory evaluation was subjected to dynamic headspace gas chromatography mass spectrometry (GC/MS) analysis. Based on variation found both in the sensory results and the GC/MS results of the pretrial, chicken samples that showed the greatest variation were further selected for analysis of volatile organic compounds. These included: untreated control, chicken exposed to UV‐C light at fluence 0.60 J/cm2 (60 s at 10 mW/cm2) and pulsed UV light three times at high intensity giving a fluence of 10.8 J/cm2 treated in air, and pulsed UV light at low intensity at fluence 1.25 J/cm2 treated under modified atmosphere. A gas chromatography analysis was carried out on chicken samples as previously described (Olsen, Vogt, Veberg, Ekeberg, & Nilsson, 2005). Fifteen gram aliquots of homogenized sample (the samples were analyzed in duplicate) were distributed evenly in 250 ml Erlenmeyer flasks. The samples were heated to 70°C in a water bath and purged with 100 ml/min nitrogen through a Drechsel‐head for 30 min. Volatile compounds were adsorbed on Tenax GR (mesh size 60/80). Water was removed from the tubes by nitrogen flushing (50 ml/min) for 5 min in the opposite direction of sampling. Trapped compounds were desorbed at 250°C for 5 min in a Perkin Elmer Automatic Thermal Desorption System ATD400 and transferred to an Agilent 6890 GC System with an Agilent 5973 Mass selective detector, which is a quadrupole, operated in electron impact (EI) mode at 70 eV. The scan range was from 33 to 300 amu. The compounds were separated on a DB‐WAXetr column from J&W Scientific/Agilent (0.25 mm i.d., 0.5 lm film, 30 m). Helium (99.9999%) was used as carrier gas. The temperature program started at 30°C for 10 min, increased 1°C/min to 40°C, 3°C/min to 70°C, 6.5°C/min to 160°C, and 20°C/min to 230°C with a final hold time of 4 min. Integration of peaks and tentative identification of compounds were performed with HP Chemstation (G1701CA version C.00.00, Agilent Technologies, Santa Clara, CA, USA), Wiley 130 KMass Spectral and NIST98 Mass Spectral. Comparison of retention times and mass spectra of the sample peaks with those of pure standards confirmed identities of several of the components. Heptanoic acid ethyl ester was used as internal standard. System performance was checked with blanks and standard samples before, during and after the sample series, and the selected major compounds (80–100%) on a peak area basis were included in the data analysis.
2.8. Statistical analysis
Bacterial reductions log cfu/cm2 between control and UV light treated samples were calculated. Analysis of variance (ANOVA) and Tukey's multiple comparison test were used to determine statistically significant effects on the reduction by the treatments (R 3.3.2; R Core Team [2016]) using a significance level of .05. For sensory evaluation, the same analyses were performed on the descriptive sensory data from the trained panel to identify sensory attributes that discriminated between samples.
2.9. Weibull models
For each species, a two‐parameter Weibull distribution was fitted to the observed log reductions to produce predictive models of the effects of UV exposure. The chosen Weibull model is defined as:
where N 0 and N denote the number of bacteria per square cm before and after UV exposure, respectively, f is the UV dose (fluence), α is the scale parameter (describes how sharply the curve drops in the beginning), and β is the shape parameter (describes the shape of the curve). Common models were produced based on log reduction data for all the bacterial species.
3. RESULTS
3.1. Bacterial reductions on skinless chicken fillets
We investigated the effect of UV‐C and pulsed UV light against microbial flora associated with fresh, skinless chicken fillets. An overview of the experimental set‐up is shown in Figure 1. Resulting bacterial log reductions cfu/cm2 of the food pathogens S. Enteritidis, L. monocytogenes, S. aureus and EHEC, and chicken spoilage bacteria Pseudomonas spp., B. thermospacta, C. divergens, and ESBL‐producing E. coli applied to chicken meat surface are shown in Figures 2 and 3 and Supporting Information Table S1.
Figure 1.
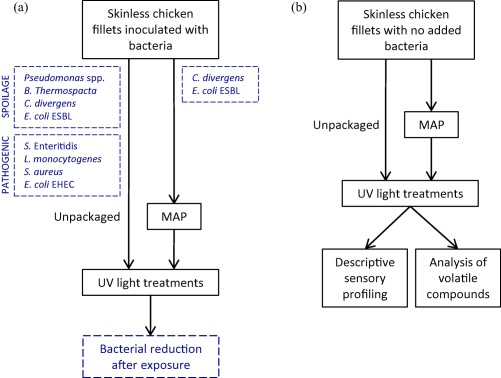
Flowchart illustrating the experimental set‐up. Reduction of bacteria on skinless chicken fillets using UV light treatments (a), and sensory analyses of chicken fillets treated with UV light (b). Chicken fillets inoculated with pathogens and bacteria often found as natural contaminants on fresh chicken meat were exposed to different UV light treatments in air, representing unpackaged chicken, and for two selected species on modified atmosphere packaged (MAP)‐chicken. The bacterial species are listed in Table 1. Sensory analyses of chicken fillets with no added bacteria were conducted after UV light treatments of both unpackaged chicken and MAP‐chicken
Figure 2.
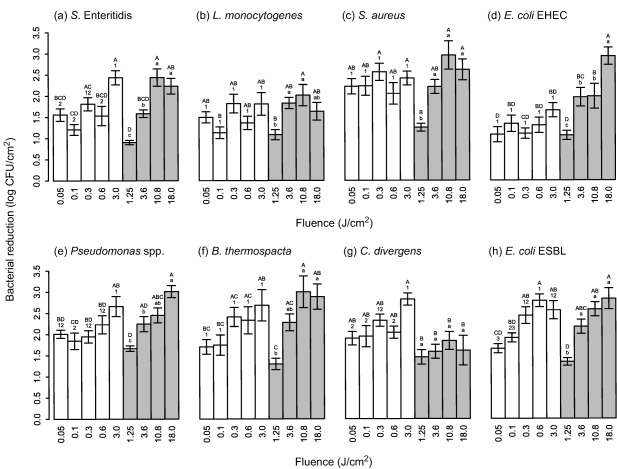
Reductions of (a) S. Enteritidis, (b) L. monocytogenes, (c) S. aureus, (d) enterohemorrhagic E. coli (EHEC), (e) Pseudomonas spp., (f) B. thermospacta, (g) C. divergens, and (h) ESBL‐producing E. coli on chicken fillet meat after continuous UV‐C (white bars) and pulsed UV light (grey bars) exposures at different fluences (J/cm2). The chicken samples were treated in air, representing unpackaged chicken. Three separate ANOVA were performed for each species, represented by upper case letters (comparing UV‐C and pulsed UV light treatments), numbers (comparing UV‐C light treatments) and lower case letters (comparing pulsed UV light treatments). Samples containing the same letter/number were not considered different
Figure 3.
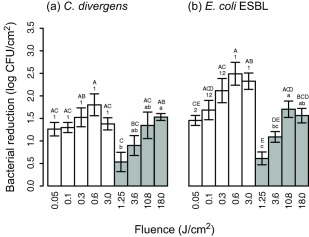
Reductions of (a) C. divergens and (b) ESBL‐producing E. coli on MAP‐chicken exposed to continuous UV‐C (white bars) and pulsed UV light (grey bars) at different fluences (J/cm2). A gas mixture of 60% CO2 and 40% N2 and a UV permeable top film was used for the packages. Three separate ANOVA were performed for each species, represented by upper case letters (comparing UV‐C and pulsed UV light treatments), numbers (comparing UV‐C light treatments) and lower case letters (comparing pulsed UV light treatments). Samples containing the same letter/number were not considered different
UV‐C light exposure with fluences from 0.05 to 3.0 J/cm2 (10 mW/cm2, from 5 to 300 s) in air, gave the largest reduction of 2.8 log for C. divergens after the highest fluence treatment, while only 1.7 log reduction was obtained for EHEC. The lowest fluence level gave up to 2.2 log reduction for S. aureus, and EHEC was reduced the least with 1.1 log. By comparing UV‐C light results using ANOVA within each species, some of the shorter treatments were considered statistically different from the treatments of longer duration for S. Enteritidis (Figure 2a, range 1.6–2.4 log), Pseudomonas spp. (2e, 2.0–2.7 log), C. divergens (2g, 1.9–2.8 log), and ESBL‐producing E. coli (2h, 1.7–2.8 log), while none of the treatments were statistically different from each other for L. monocytogenes (2b, 1.5–1.8 log), S. aureus (2c, 2.2–2.6 log), EHEC (2d, 1.1–1.7 log), and B. thermospacta (2f, 1.7–2.7 log).
Sensitivities against pulsed UV light, where fluences from 1.25 to 18.0 J/cm2 were used, seemed to be more similar between the different species than for UV‐C light. Reductions after pulsed UV light exposure in air at the highest fluences (10.8 and 18.0 J/cm2) ranged from 1.6 log for L. monocytogenes and C. divergens to 3.0 log for S. aureus, Pseudomonas spp. and B. thermospacta. For the low fluence exposure of 1.25 J/cm2, reductions ranged from 0.9 log for S. Enteritidis to 1.7 log for Pseudomonas spp. ANOVA on the pulsed UV light results within each species defined the treatment at low fluence statistically different from some or all of the higher intensity treatments, thus increased reduction was obtained by increasing the UV dose. The range of reduction was 0.9–2.4 log for S. Enteritidis (Figure 2a), 1.1–2.0 log for L. monocytogenes (2b), 1.3–3.0 log for S. aureus (2c), 1.1–2.9 log for EHEC (2d), 1.7–3.0 log for Pseudomonas spp. (2e), 1.3–3.0 log for B. thermospacta (2f), and 1.3–2.8 log for ESBL‐producing E. coli (2h). C. divergens deviated from this pattern, for which none of the treatments were considered statistically different from each other and reductions ranged from 1.5 to 1.8 log (Figure 2g).
In the in vitro illumination experiments of petri dishes, the UV light treatments inactivated all the bacterial species by 5–7 log, except from L. monocytogenes that was able to withstand the low fluence 1.25 J/cm2 treatment with pulsed UV light better than the other species, showing approximately 4 log reduction (not shown).
Bacterial reductions after exposure with UV‐C and pulsed UV light against C. divergens and ESBL‐producing E. coli on MAP‐chicken, are shown in Figure 3 and Supporting Information Table S1. Samples were stored under an anaerobic atmosphere with 60% CO2 and 40% N2, and the UV permeable top film allowed for UV light exposure of intact packages. C. divergens reduction after UV‐C light treatments ranged from 1.3 to 1.8 log, and after pulsed UV light treatments from 0.5 to 1.5 log. The UV‐C light treatments at the lowest fluences (0.05, 0.1, 0.3 J/cm2) resulted in approximately 0.7 log lower reduction on MAP‐chicken compared with unpackaged chicken, and 1.4 log lower reduction was seen for the highest fluence treatment (3.0 J/cm2). ANOVA on the UV‐C light results confirmed the observed differences statistically (results not shown). After pulsed UV light exposure, reductions were similar for MAP‐chicken and unpackaged chicken samples for the highest fluences (10.8 and 18.0 J/cm2), while for fluences of 1.25 and 3.6 J/cm2, 0.9 and 0.7 log lower reductions, respectively, were seen on MAP‐chicken, which were confirmed statistically by ANOVA (not shown). Reduction of ESBL‐producing E. coli after UV‐C light treatments ranged from 1.5 to 2.5 log, and after pulsed UV light treatments from 0.6 to 1.7 log. ANOVA on the UV‐C light results confirmed statistically that reductions on MAP‐chicken and unpackaged chicken samples were similar (not shown). For pulsed UV light, lower reductions were seen for the MAP‐chicken samples regardless of UV dose, 0.7, 1.1, 0.9, and 1.3 log lower reductions for fluences of 1.25, 3.6, 10.8, and 18.0 J/cm2, respectively, confirmed statistically by ANOVA (not shown).
The applied UV light up to 10.8 J/cm2 did not impair the oxygen barrier properties and structural integrity of the UV permeable top film, and the O2 concentrations of the trays increased from approximately 0.12 ± 0.03% at packaging to 0.69 ± 0.02% after 21 days, and were similar for the different UV light treatments and the untreated control. Scanning electron microscopy analysis showed no structural damages to the UV treated films (not shown). The ability of the film to transmit UV light was measured as 80.5% at 254 nm, which was compensated for by increasing the UV doses accordingly in the illumination experiments.
3.2. Weibull models describing bacterial reduction
Weibull models created to predict the log reduction patterns for the different bacterial species are shown in Figure 4 and parameters for the models are listed in Table 2. RMSE values indicating the goodness of fit, were the lowest for S. aureus exposed to UV‐C light (0.20) and the highest for Pseudomonas spp. exposed to pulsed UV light (0.55). Determination coefficient (R 2) values ranged from 0.41 to 0.80 for UV‐C light and from 0.47 to 0.89 for pulsed UV light. Since R 2 indicates the proportion of variation in log reduction explained by the fitted Weibull model, a value approaching 1 would signify perfect predictability. Since all of the ß (shape parameter) values were less than 1, the Weibull fits of the reduction data were concave upward. The highest ß values were obtained for EHEC and S. Enteritidis (0.32 and 0.31, respectively) for pulsed UV light. The α (scale parameter) values were very small, implying concentrated distribution, as seen by how sharp the curve drops in the beginning. There was a noticeable difference between the two UV methods, where higher α values were obtained for UV‐C light than for pulsed UV light, with C. divergens as an exception. Common models based on log reduction values for all the species gave a good fit for the majority of the species, but for L. monocytogenes exposed to both UV‐C and pulsed UV light, reduction was overestimated. The same was seen for EHEC exposed to UV‐C light and C. divergens exposed to pulsed UV light.
Figure 4.
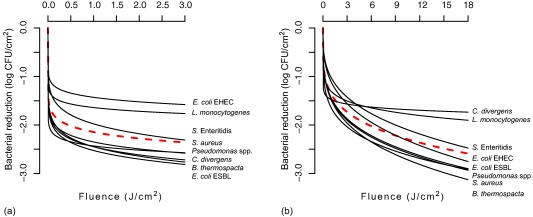
Weibull models for bacterial log reduction as a function of UV exposure. Models for each species (black continuous line) and common models (red dotted line) are shown for bacterial reduction on unpackaged chicken fillet meat after (a) continuous UV‐C and (b) pulsed UV light exposures at different fluences (J/cm2)
Table 2.
Parameters for Weibull models predicting bacterial reduction on chicken fillet meat after continuous UV‐C and pulsed UV light exposures, and goodness‐of‐fit parameters of the models
| Bacterial species | α | β | RMSE | R 2 | |
|---|---|---|---|---|---|
| Continuous UV‐C light | E. coli EHEC | 2.03E‐06 | 0.09 | 0.31 | .75 |
| L. monocytogenes | 2.02E‐09 | 0.07 | 0.47 | .41 | |
| S. Enteritidis | 2.35E‐05 | 0.14 | 0.41 | .64 | |
| S. aureus | 2.22E‐15 | 0.05 | 0.20 | .76 | |
| Pseudomonas spp. | 2.86E‐09 | 0.09 | 0.39 | .68 | |
| C. divergens | 1.45E‐08 | 0.10 | 0.37 | .74 | |
| B. thermospacta | 1.66E‐07 | 0.11 | 0.31 | .80 | |
| E. coli ESBL | 1.65E‐08 | 0.10 | 0.38 | .74 | |
| All | 9.89E‐09 | 0.09 | 0.53 | .25 | |
| Pulsed UV light | C. divergens | 3.79E‐10 | 0.06 | 0.29 | .86 |
| L. monocytogenes | 2.27E‐04 | 0.13 | 0.37 | .63 | |
| S. Enteritidis | 6.32E‐02 | 0.31 | 0.42 | .79 | |
| E. coli EHEC | 5.29E‐02 | 0.32 | 0.41 | .79 | |
| E. coli ESBL | 7.58E‐03 | 0.24 | 0.28 | .89 | |
| Pseudomonas spp. | 1.31E‐03 | 0.20 | 0.55 | .71 | |
| S. aureus | 6.61E‐03 | 0.24 | 0.47 | .47 | |
| B. thermospacta | 9.21E‐03 | 0.26 | 0.37 | .82 | |
| All | 6.23E‐03 | 0.22 | 0.54 | .46 |
3.3. Sensory evaluation of UV light treated chicken
Changes in quality or sensory properties of chicken fillets as a result of UV light treatments were assessed by 10 trained assessors. Their evaluation results are shown in Figure 5, where raw chicken samples were evaluated for odor and cooked chicken samples for odor/taste/flavor. A statistically significant difference between the samples was only registered for the odor characterized as sunburnt (p < .001), which is associated with that of sunburnt human skin. Most notably, treatment with the highest dose of pulsed UV light (10.8 J/cm2) in air gave the highest intensity of the sunburnt odor (sensory intensity value score of 3.4). After cooking, this effect of the UV light treatment could not be detected. From the consumer test, UV light exposed raw chicken fillet samples assessed by 20 random consumers could not be differentiated from untreated control samples (data not shown). By visual inspection, the color stability was not affected by the treatments at the doses used (data not shown).
Figure 5.
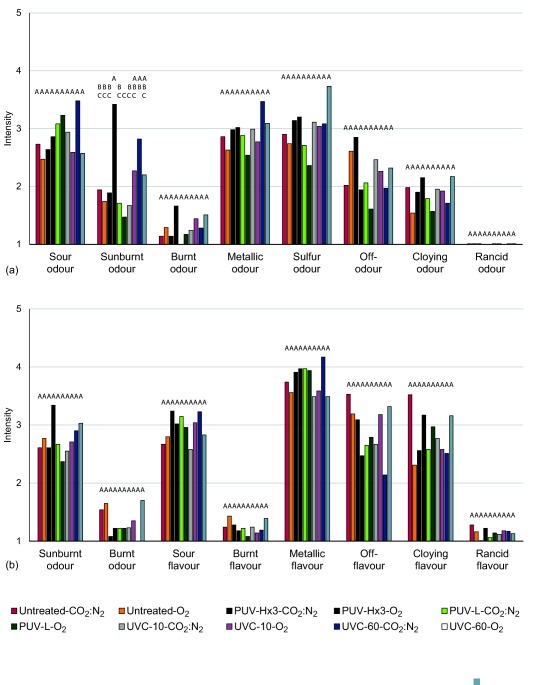
Sensory analysis of (a) raw chicken fillet samples and (b) cooked chicken fillet samples. Chicken samples were exposed to continuous UV‐C light at 10 mW/cm2 for 10 s (UVC‐10) and 60 s (UVC‐60), giving fluences of 0.1 J/cm2 and 0.60 J/cm2, respectively, and pulsed UV light to a low pulse with fluence of 1.25 J/cm2 (PUV‐L) and three times to a high pulse giving a fluence of 10.8 J/cm2 (PUV‐Hx3), both in air (O2) and anaerobic (CO2 : N2) atmospheres, representing unpackaged chicken and MAP‐chicken, respectively. The intensities of different odors of raw samples and odor/taste/flavor of cooked samples were registered, 1 = no intensity and 9 = high intensity. The letters above the columns indicate grouping according to ANOVA and Tukey multiple comparison test. Samples with the same letter are considered being equal for the specific property
Denaturation of proteins in chicken has been considered to be initiated at temperatures higher than 56°C (Murphy, Marks, & Marcy, 1998). Only minor elevation of the temperature was observed, 2.5–4.0°C and 4.0–6.5°C for UV‐C light treatments at fluences 0.6 J/cm2 and 3.0 J/cm2, respectively, and 0.5–2.5°C and 2.5–3.5°C for pulsed UV light treatments at fluences 10.8 and 18.0 J/cm2, respectively. The rise in surface temperature was only temporary since the surface was rapidly cooled by the low temperature of the interior of the chicken fillet.
3.4. Volatile organic compounds
Nearly 100 different volatile organic compounds were detected by dynamic headspace/GC‐MS in the raw chicken samples that were analyzed, of which approximately 70 compounds could be identified. The major compounds were ketones (C2–C5, C7), alcohols (C2–C8), acids (C2–C7), fatty and nonfatty aldehydes (C2–C9), hydrocarbons (C5–C7), and sulfides. Only a few compounds were observed to increase in concentration as a result of exposure to UV light. This included dimethyltrisulfide, pentane, heptane, propanoic acid, 2‐pentanone, 1‐pentanol, and hexanal (Figure 6). Linear correlation with the odor scores were calculated, and gave correlations with the sunburnt odor scores as follows: dimethyltrisulfide r = .70 (p < .01), 2‐pentanone r = .95 (p < .0025), 1‐pentanol r = .91 (p < .005), pentane (r = .92, p < .005), heptane (r = .81, p < .01), propanoic acid (r = .98, p < .001), and hexanal (r = .81, p < .01). The sample in which all the compounds increased the most, was chicken exposed to pulsed UV light at fluence 10.8 J/cm2 treated in air.
Figure 6.
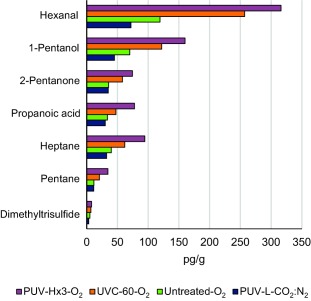
Volatile organic compounds from chicken which showed an increase in concentration (pg/g) as a result of exposure to UV light. The samples included were chicken exposed to pulsed UV light at low intensity at fluence 1.25 J/cm2 (PUV‐L) treated under anaerobic (CO2:N2) atmosphere (MAP‐chicken), an untreated control (Untreated), chicken exposed to UV‐C light at 10 mW/cm2 for 60 s (UVC‐60) giving a fluence of 0.60 J/cm2 and pulsed UV light three times at high intensity (PUV‐Hx3) giving a fluence of 10.8 J/cm2 treated in air (O2). The precision of replicate measurements were within 15%
4. DISCUSSION
4.1. Effect of UV treatment on inoculated bacteria
There are large differences between the conventional continuous UV‐C light and pulsed UV light with respect to wavelengths, intensities, and exposure times. In this work, we have compared the efficacy of continuous UV‐C light and pulsed UV light in reducing bacteria on chicken fillet. We used multi strain mixtures of the same species and bacterial cells that were in the same state during the different treatments. In earlier studies, single strains were often used which may not show reductions representative for the species. Differences in reduction within species have been reported, and state of the cells can influence the sensitivity to UV light (Farrell et al., 2010; Haughton et al., 2011b). To avoid possible changes in sensory perception, it is desirable to maximize bacterial reduction without treating the surface of a product more than necessary. Treatment levels employed for both UV methods were practical and relevant within industrial production, from weak exposures resulting in limited bacterial reduction, up to levels exceeding the maximum permitted dose by the FDA for pulsed UV light (FDA, 2010). The fluences are not directly comparable between the two methods, since the different wavelengths in the UV spectrum have different germicidal effectiveness (Bintsis, Litopoulou‐Tzanetaki, & Robinson, 2000). For UV‐C exposure at 0.05 J/cm2, the germicidal effect was comparable to a fluence of 1.25 J/cm2 for the pulsed UV light. UV‐C light showed a higher germicidal effect when the same fluence was employed for the two methods, which can be explained by most of the energy being emitted at 254 nm, where the germicidal effect is close to the maximum (Bintsis et al., 2000).
In the range tested, a limited dose‐response effect was observed, likely caused by shading effects of the irregular surface structure of the chicken fillet. The increase in reduction with increasing dose was though more apparent for the pulsed UV light. Any substance between the light source and the bacterium that absorbs light will impair the decontamination process (Gomez‐Lopez et al., 2007). Even when a surface appears smooth to the naked eye, it may harbor crevices and cracks where bacteria are shielded against direct exposure, and bacteria may also be covered by protein or other organic matrices. Moreover, the average size of a bacterium is approximately 1 µm × 2 µm, and although its spreading was carried out carefully, it is practically impossible to avoid some overlapping. A shielding effect for colonies of L. monocytogenes growing on petri dishes where the upper cells of a colony appeared to protect the lower cells has previously been described (Gomez‐Lopez et al., 2005). At high fluence rates, the light should be able to penetrate deeper, but still, the efficiency of using UV light for decontamination of foods is lower than when tested on smooth surfaces. Reductions of 5–7 log achieved on agar in petri dishes was in accordance with previous reports (Farrell et al., 2010; Gomez‐Lopez et al., 2005; Paskeviciute et al., 2011; Rowan et al., 1999), and the observed higher resistance of L. monocytogenes to pulsed UV light, reduced only 4 log after treatment at low fluence of 1.25 J/cm2, has also been reported previously (Gomez‐Lopez et al., 2005; Lasagabaster & de Maranon, 2012). In general, the reductions of inoculated bacteria on chicken fillet surface observed in this study correlated well with previous findings, both for UV‐C (Chun et al., 2010; Haughton et al., 2011a; Isohanni & Lyhs, 2009; Sommers et al., 2016) and for pulsed UV light (Keklik et al., 2010; Paskeviciute et al., 2011), including for C. divergens, Pseudomonas spp., and B. thermospacta, for which previous reports on UV light inactivation on food surfaces does not exist or are scarce. EHEC seemed to resist the UV‐C light treatments better than ESBL‐producing E. coli, and better than the other species tested as well.
The Weibull distribution is suitable for the analysis of bacterial reduction (Chen, 2007; Keklik, Demirci, Puri, & Heinemann, 2012; Martin et al., 2007; Ugarte‐Romero, Feng, Martin, Cadwallader, & Robinson, 2006; van Boekel, 2002), and was previously demonstrated to be more successful than models such as the log‐linear model and first‐order kinetic model (Chen, 2007; Keklik, Demirci, et al., 2012; Martin et al., 2007). The model seemed to be a useful tool to describe the reduction patterns and give clues to how pathogens and spoilage bacteria on chicken fillet surfaces are likely to respond to UV light treatments. The Weibull fits of the reduction data were concave upward, indicating that exposed cells were destroyed and that the more resistant cells or those shaded from exposure were left undamaged.
To our knowledge, studies on UV light treatment of intact packages of MAP‐chicken fillet for reducing bacteria on the chicken surface have previously not been reported. UV light reduction of bacteria on various packaging materials have, however, been studied (Haughton et al., 2011b), and vacuum‐packaged chicken breast inoculated with Salmonella Typhimurium treated with pulsed UV light were shown to give about 2 log reduction, but with double the exposure time (30 s) in comparison with unpackaged samples (15 s) (Keklik et al., 2010). The additional bacterial reduction obtained on ready packaged chicken fillet product would increase shelf life and safety. Treatment after packaging should be simple to implement at industrial packaging lines without reductions in production efficiency.
4.2. Sensory quality of the chicken fillets
Meat exposed to UV light can develop off‐flavors caused by the absorption of ozone and oxides of nitrogen, or because of photochemical effects on the lipid fractions of the meat (Bintsis et al., 2000). Lipid oxidative rancidity is regarded as the most important nonmicrobial factor responsible for meat deterioration, resulting in adverse changes in appearance, texture, odor, and flavor (Frankel, 1998). An increase in fatty aldehydes due to lipid oxidation during irradiation of poultry meat has been documented (Du, Ahn, Nam, & Sell, 2000, 2001; Du, Hur, Nam, Ismail, & Ahn, 2001; Kim, Nam, & Ahn, 2002). The major fatty aldehyde hexanal is a typical volatile secondary lipid oxidation product (Beltran, Pla, Yuste, & Mor‐Mur, 2003; Jayasena, Ahn, Nam, & Jo, 2013; Shi & Ho, 1994). Although we observed an increase in the concentration of hexanal, particularly for unpackaged chicken exposed to UV light, no significant effect was found on the corresponding rancid‐related sensory attributes in the professional sensory evaluation. This suggests that lipid oxidation does not have a negative impact on the perceived odor and flavor of the chicken meat at the applied UV doses. The higher intensity of the sunburnt odor for chicken exposed to the most intense dose of pulsed UV light, does, however, seem to pose restrictions on the upper limit of treatment of unpackaged chicken. The sensory intensity value was though only 3.4, which is considered relatively low, and for lower doses relevant in industrial application, the odor should not be a problem. Detected changes in concentrations of volatile compounds correlated well with the sensory observations. Increased levels were seen in unpackaged chicken after UV light exposure. Hydrocarbons may be generated during irradiation of poultry meat (Du, Ahn, et al., 2000, 2001; Du, Hur, et al., 2001; Kim et al., 2002), where increased concentrations of propanol and butanol have been documented (Du et al., 2000, 2001; Du, Hur, et al., 2001). In accordance, we detected increased levels of pentane, heptane and 1‐pentanol. Sulfur compounds with low odor thresholds are important to odor associated with irradiation (Angelini, Merritt, Mendelsohn, & King, 1975; Batzer & Doty, 1955; Patterson & Stevenson, 1995). Dimethyltrisulfide, although only detected in small amounts in unpackaged chicken after UV light exposure, was reported by Patterson and Stevenson (Patterson & Stevenson, 1995) to be the most potent off‐odor compound in irradiated raw chicken. Other compounds that showed an increase and which character could be associated with sunburnt/irradiated odor and flavor, were 2‐pentanone (roasted sweet), and 1‐pentanol (roasted meat) (Brewer, 2009). Together these three compounds likely contribute to the sensory perceived sunburnt odor. Irradiation of poultry meat is though based on irradiation by electrons using an accelerator, representing far higher dose in terms of energy exposure per area compared to our applied UV doses, thus the results may not be directly comparable. Paskeviciute et al. (2011) investigated chemical changes in pulsed UV light treated chicken breasts, and reported that the intensity of lipid peroxidation in control and treated chicken samples differed in 0.16 mg malondialdehyde per kilogram of chicken meat. However, taste panelists did not observe any changes in organoleptic properties of treated raw chicken, chicken broth or cooked chicken meat in comparison with control. Although treated raw chicken samples could not be differentiated from an untreated control sample by the 20 random chosen consumers in the present study, more extensive consumer studies could aid in determining whether such UV light treatments are acceptable.
The color of raw or cooked poultry meat is by origin pale with a low content of the muscle pigment myoglobin. Furthermore, the color of raw meat is dependent on the oxidation state of myoglobin (Mugler & Cunningham, 1972; United States Department of Agriculture, 2013). Chicken breasts exposed to high doses of UV light was previously reported to turn darker, show more redness and a slight increasing amount of yellow coloration (Park & Ha, 2015). The color of the chicken fillets was not affected by the treatments at the doses used in our experiments, as in agreement with other reports (Chun et al., 2010; Haughton et al., 2011a). Together these results indicate that sensory and quality changes are small or negligible both after UV‐C and pulsed UV light treatments.
4.3. Advantages and disadvantages of continuous UV‐C and pulsed UV treatments
Both UV‐C and pulsed UV light treatments provide effective tools for reduction of microorganisms. They are rapid and efficient nonchemical, nonionizing, and nonthermal surface decontamination treatments and can be used in continuous processing. The methods have been shown as effective technologies for decontamination of stainless steel conveyors and surfaces in the production environment (Haughton et al., 2011b; Sommers, Sites, & Musgrove, 2010). They can be used on foods and synergistically with other treatments (Mukhopadhyay & Ramaswamy, 2012). The methods require little energy use, are easy to implement and require no increase in work load. UV light is safe to apply, but some precautions have to be taken to avoid exposure of workers to light and to evacuate any ozone generated by the shorter UV wavelengths (Gomez‐Lopez et al., 2007). The effect of both UV‐C and pulsed UV light is impaired in opaque matter, where bacteria are shielded from direct exposure such as by food surface topography, organic matter, or by other bacteria. The UV light treatments of this study did not alter the properties of the EVOH film used, as was also the case with polyethylene, polypropylene and polyvinyldichloride films (Tarek, Rasco, & Sablani, 2015). The top film used transmitted approximately 80% of the UV light, while in previous studies, films with polypropylene and polyethylene barrier layers transmitted 75% (Keklik, Demirci, & Puri, 2009) and 72% (Keklik et al., 2010), respectively, of pulsed UV light at 1.27 J/cm2. By using a packaging film with a high UV transmission, the chicken fillets could be packaged before the UV light treatment, thereby avoiding the risk of recontamination. Both methods would be beneficial for large scale industrial UV decontamination operations. UV‐C light treatment is a low cost strategy with low maintenance (Keklik, Krishnamurthy, & Demirci, 2012). The treatment time is somewhat longer in comparison with pulsed UV light treatment, and therefore the equipment may require more space if installed over for example a conveyor belt. Pulsed UV light provides rapid decontamination, but involves equipment that is more elaborate. The xenon flash lamps used for pulsed UV light are also more environment friendly than the mercury‐vapor lamps typically used in UV‐C light treatment (Gomez‐Lopez et al., 2007).
5. CONCLUSION
Despite good hygiene practices during production of fresh meat, contamination of carcasses with pathogens and spoilage bacteria cannot be completely prevented. There is pressure on the food industry for nutritious, fresh and healthy food products, to maximize the shelf life of the products, and for reducing costs and waste. Antimicrobial interventions that effectively reduce the bacterial load are feasible in slaughter and product processing. They should be safe, economic, and easy to handle. Also, interventions should not change the organoleptic quality of the food and should be widely accepted by consumers. The exposure of raw chicken fillet surface to various doses of UV‐C or pulsed UV light proposed in this work represents useful alternatives for reducing the viability of pathogenic and spoilage bacteria on this product.
CONFLICT OF INTEREST
The authors declare that there is no conflict of interest regarding publication of this paper.
Supporting information
Additional Supporting Information may be found online in the supporting information tab for this article.
Supporting Information
ACKNOWLEDGMENTS
We thank the trained sensory panel at Nofima for carrying out the sensory evaluation, Signe Marie Drømtorp, Aud Espedal, Vibeke Høst, Elin‐Merete Nicolaisen and Birgitte Vikrem for excellent technical assistance. We are grateful to Bemis, Valkeakoski, Finland, for the supply of packaging film. The work was funded by grants to the projects 221663 and 262306 financed by The Research Council of Norway and the Foundation for Research Levy on Agricultural Products, respectively.
McLeod A, Hovde Liland K, Haugen J‐E, Sørheim O, Myhrer KS, Holck AL. Chicken fillets subjected to UV‐C and pulsed UV light: Reduction of pathogenic and spoilage bacteria, and changes in sensory quality. J Food Saf. 2018;38:e12421. 10.1111/jfs.12421
Funding information The Research Council of Norway, Grant/Award Number: 221663; Foundation for Research Levy on Agricultural Products, Grant/Award Number: 262306
The copyright line for this article was changed on 30 July 2018 after original online publication.
REFERENCES
- Angelini, P. , Merritt, C. , Mendelsohn, J. M. , & King, F. J. (1975). Effect of irradiation on volatile constituents of stored haddock flesh. Journal of Food Science, 40(1), 197–199. 10.1111/j.1365-2621.1975.tb03770.x [DOI] [Google Scholar]
- Anonymous . (2000). Lebensmittelbestrahlungsverordnung vom 14. Dezember 2000 (BGBl. I S. 1730), die zuletzt durch Artikel 62 der Verordnung vom 31. August 2015 (BGBl. I S. 1474) geändert worden ist. Germany. [Google Scholar]
- Batzer, O. F. , & Doty, D. M. (1955). Nature of undesirable odors formed by gamma irradiation of beef. Journal of Agricultural and Food Chemistry, 3(1), 64–67. 10.1021/Jf60047a009 [DOI] [Google Scholar]
- Beltran, E. , Pla, R. , Yuste, J. , & Mor‐Mur, M. (2003). Lipid oxidation of pressurized and cooked chicken: Role of sodium chloride and mechanical processing on TBARS and hexanal values. Meat Science, 64(1), 19–25. 10.1016/S0309-1740(02)00132-8 [DOI] [PubMed] [Google Scholar]
- Bintsis, T. , Litopoulou‐Tzanetaki, E. , & Robinson, R. K. (2000). Existing and potential applications of ultraviolet light in the food industry ‐ A critical review. Journal of the Science of Food and Agriculture, 80, 637–645. [DOI] [PubMed] [Google Scholar]
- Blom, H. , Nerbrink, E. , Dainty, R. , Hagtvedt, T. , Borch, E. , Nissen, H. , & Nesbakken, T. (1997). Addition of 2.5% lactate and 0.25% acetate controls growth of Listeria monocytogenes in vacuum‐packed, sensory‐acceptable servelat sausage and cooked ham stored at 4 degrees C. International Journal of Food Microbiology, 38(1), 71–76. 10.1016/S0168-1605(97)00088-3 [DOI] [PubMed] [Google Scholar]
- Borch, E. , Kant‐Muermans, M. L. , & Blixt, Y. (1996). Bacterial spoilage of meat and cured meat products. International Journal of Food Microbiology, 33(1), 103–120. [DOI] [PubMed] [Google Scholar]
- Brewer, M. S. (2009). Irradiation effects on meat flavor: A review. Meat Science, 81(1), 1–14. 10.1016/j.meatsci.2008.07.011 [DOI] [PubMed] [Google Scholar]
- Briongos‐Figuero, L. S. , Gomez‐Traveso, T. , Bachiller‐Luque, P. , Dominguez‐Gil Gonzalez, M. , Gomez‐Nieto, A. , Palacios‐Martin, T. , … Perez‐Castrillon, J. L. (2012). Epidemiology, risk factors and comorbidity for urinary tract infections caused by extended‐spectrum beta‐lactamase (ESBL)‐producing enterobacteria. International Journal of Clinical Practice, 66, 891–896. 10.1111/j.1742-1241.2012.02991.x [DOI] [PubMed] [Google Scholar]
- Capita, R. , Alonso‐Calleja, C. , Garcia‐Fernandez, M. C. , & Moreno, B. (2002). Review: Trisodium phosphate (TSP) treatment for decontamination of poultry. Food Science and Technology International, 8(1), 11–24. 10.1106/108201302023118 [DOI] [Google Scholar]
- Chen, H. Q. (2007). Temperature‐assisted pressure inactivation of Listeria monocytogenes in Turkey breast meat. International Journal of Food Microbiology, 117(1), 55–60. 10.1016/j.ijfoodmicro.2007.02.025 [DOI] [PubMed] [Google Scholar]
- Chun, H. H. , Kim, J. Y. , Lee, B. D. , Yu, D. J. , & Song, K. B. (2010). Effect of UV‐C irradiation on the inactivation of inoculated pathogens and quality of chicken breasts during storage. Food Control, 21, 276–280. 10.1016/j.foodcont.2009.06.006 [DOI] [Google Scholar]
- Demirci, A. , & Panico, L. (2008). Pulsed ultraviolet light. Food Science and Technology International, 14, 443–446. 10.1177/1082013208098816 [DOI] [Google Scholar]
- Du, M. , Ahn, D. U. , Nam, K. C. , & Sell, J. L. (2000). Influence of dietary conjugated linoleic acid on volatile profiles, color and lipid oxidation of irradiated raw chicken meat. Meat Science, 56, 387–395. 10.1016/S0309-1740(00)00067-X [DOI] [PubMed] [Google Scholar]
- Du, M. , Ahn, D. U. , Nam, K. C. , & Sell, J. L. (2001). Volatile profiles and lipid oxidation of irradiated cooked chicken meat from laying hens fed diets containing conjugated linoleic acid. Poultry Science, 80, 235–241. [DOI] [PubMed] [Google Scholar]
- Du, M. , Hur, S. J. , Nam, K. C. , Ismail, H. , & Ahn, D. U. (2001). Volatiles, color, and lipid oxidation of broiler breast fillets irradiated before and after cooking. Poultry Science, 80, 1748–1753. [DOI] [PubMed] [Google Scholar]
- European Food Safety Authority . (2015). The European Union summary report on trends and sources of zoonoses, zoonotic agents and food‐borne outbreaks in 2013. EFSA Journal, 13(1), 3991. [DOI] [PMC free article] [PubMed] [Google Scholar]
- Farrell, H. P. , Garvey, M. , Cormican, M. , Laffey, J. G. , & Rowan, N. J. (2010). Investigation of critical inter‐related factors affecting the efficacy of pulsed light for inactivating clinically relevant bacterial pathogens. Journal of Applied Microbiology, 108, 1494–1508. 10.1111/j.1365-2672.2009.04545.x [DOI] [PubMed] [Google Scholar]
- Food and Agriculture Organization of the United Nations . (2015). World agriculture: Towards 2015/2030. An FAO perspective. Economic and Social Development Department. Retrieved from http://www.fao.org/docrep/005/y4252e/y4252e05b.htm
- Frankel, E. N. (1998). Lipid oxidation. Dundee, Scotland: The Oily Press, Ltd. [Google Scholar]
- Glaser, P. , Frangeul, L. , Buchrieser, C. , Rusniok, C. , Amend, A. , Baquero, F. , … Cossart, P. (2001). Comparative genomics of Listeria species. Science (New York, NY), 294, 849–852. 10.1126/science.1063447 [DOI] [PubMed] [Google Scholar]
- Gomez‐Lopez, V. M. , Devlieghere, F. , Bonduelle, V. , & Debevere, J. (2005). Factors affecting the inactivation of micro‐organisms by intense light pulses. Journal of Applied Microbiology, 99, 460–470. 10.1111/j.1365-2672.2005.02641.x [DOI] [PubMed] [Google Scholar]
- Gomez‐Lopez, V. M. , Ragaert, P. , Debevere, J. , & Devlieghere, F. (2007). Pulsed light for food decontamination: A review. Trends in Food Science & Technology, 18, 464–473. 10.1016/j.tifs.2007.03.010 [DOI] [Google Scholar]
- Hafez, H. M. (1999). Poultry meat and food safety: Pre‐ and post‐harvest approaches to reduce foodborne pathogens. World's Poultry Science Journal, 55, 269–280. 10.1079/Wps19990020 [DOI] [Google Scholar]
- Hafez, H. M. (2005). Governmental regulations and concept behind eradication and control of some important poultry diseases. World's Poultry Science Journal, 61, 569–581. 10.1079/Wps200571 [DOI] [Google Scholar]
- Harm, W. (1980). Biological effects of ultraviolet radiation. New York: Cambridge University Press. [Google Scholar]
- Haughton, P. N. , Lyng, J. G. , Cronin, D. A. , Morgan, D. J. , Fanning, S. , & Whyte, P. (2011a). Efficacy of UV light treatment for the microbiological decontamination of chicken, associated packaging, and contact surfaces. Journal of Food Protection, 74, 565–572. 10.4315/0362-028X.JFP-10-356 [DOI] [PubMed] [Google Scholar]
- Haughton, P. N. , Lyng, J. G. , Morgan, D. J. , Cronin, D. A. , Fanning, S. , & Whyte, P. (2011b). Efficacy of high‐intensity pulsed light for the microbiological decontamination of chicken, associated packaging, and contact surfaces. Foodborne Pathogens and Disease, 8(1), 109–117. 10.1089/fpd.2010.0640 [DOI] [PubMed] [Google Scholar]
- Heir, E. , Holck, A. L. , Omer, M. K. , Alvseike, O. , Hoy, M. , Mage, I. , & Axelsson, L. (2010). Reduction of verotoxigenic Escherichia coli by process and recipe optimisation in dry‐fermented sausages. International Journal of Food Microbiology, 141, 195–202. 10.1016/j.ijfoodmicro.2010.05.017 [DOI] [PubMed] [Google Scholar]
- Holck, A. L. , Pettersen, M. K. , Moen, M. H. , & Sorheim, O. (2014). Prolonged shelf life and reduced drip loss of chicken filets by the use of carbon dioxide emitters and modified atmosphere packaging. Journal of Food Protection, 77, 1133–1141. 10.4315/0362-028X.JFP-13-428 [DOI] [PubMed] [Google Scholar]
- International Organisation for Standardisation . (2007). International Standard 8589. Sensory analysis ‐ Methodology ‐ Sensory analysis ‐ General guidance for the design of rooms (Ref. No. ISO 8589:2007E). Genève, Switzerland. [Google Scholar]
- Isohanni, P. M. , & Lyhs, U. (2009). Use of ultraviolet irradiation to reduce Campylobacter jejuni on broiler meat. Poultry Science, 88, 661–668. 10.3382/ps.2008-00259 [DOI] [PubMed] [Google Scholar]
- Jayasena, D. D. , Ahn, D. U. , Nam, K. C. , & Jo, C. (2013). Flavour chemistry of chicken meat: A review. Asian‐Australasian Journal of Animal Sciences, 26, 732–742. 10.5713/ajas.2012.12619 [DOI] [PMC free article] [PubMed] [Google Scholar]
- Keklik, N. M. , Demirci, A. , & Puri, V. M. (2009). Inactivation of Listeria monocytogenes on unpackaged and vacuum‐packaged chicken frankfurters using pulsed UV‐light. Journal of Food Science, 74, M431–M439. 10.1111/j.1750-3841.2009.01319.x [DOI] [PubMed] [Google Scholar]
- Keklik, N. M. , Demirci, A. , & Puri, V. M. (2010). Decontamination of unpackaged and vacuum‐packaged boneless chicken breast with pulsed ultraviolet light. Poultry Science, 89, 570–581. 10.3382/ps.2008-00476 [DOI] [PubMed] [Google Scholar]
- Keklik, N. M. , Demirci, A. , Puri, V. M. , & Heinemann, P. H. (2012). Modeling the inactivation of Salmonella Typhimurium, Listeria monocytogenes, and Salmonella Enteritidis on poultry products exposed to pulsed UV light. Journal of Food Protection, 75, 281–288. 10.4315/0362-028X.JFP-11-298 [DOI] [PubMed] [Google Scholar]
- Keklik, N. M. , Krishnamurthy, K. , & Demirci, A. (2012). Microbial decontamination of food by ultraviolet (UV) and pulsed UV light In Demirci A. & Ngadi M. O. (Eds.), Microbial decontamination in the food industry: Novel methods and applications (pp. 344–369). Cambridge, UK: Woodhead Publishing Limited. [Google Scholar]
- Kim, Y. H. , Nam, K. C. , & Ahn, D. U. (2002). Volatile profiles, lipid oxidation and sensory characteristics of irradiated meat from different animal species. Meat Science, 61, 257–265. 10.1016/S0309-1740(01)00191-7 [DOI] [PubMed] [Google Scholar]
- Kowalkski, W. (2009). Ultraviolet germicidal irradiation handbook. New York: Springer. [Google Scholar]
- Krishnamurthy, K. , Tewari, J. C. , Irudayaraj, J. , & Demirci, A. (2010). Microscopic and spectroscopic evaluation of inactivation of Staphylococcus aureus by pulsed UV light and infrared heating. Food and Bioprocess Technology, 3(1), 93–104. 10.1007/s11947-008-0084-8 [DOI] [Google Scholar]
- Lasagabaster, A. , & de Maranon, I. M. (2012). Sensitivity to pulsed light technology of several spoilage and pathogenic bacteria isolated from fish products. Journal of Food Protection, 75, 2039–2044. 10.4315/0362-028X.JFP-12-071 [DOI] [PubMed] [Google Scholar]
- Laursen, B. G. , Bay, L. , Cleenwerck, I. , Vancanneyt, M. , Swings, J. , Dalgaard, P. , & Leisner, J. J. (2005). Carnobacterium divergens and Carnobacterium maltaromaticum as spoilers or protective cultures in meat and seafood: Phenotypic and genotypic characterization. Systematic and Applied Microbiology, 28, 151–164. 10.1016/j.syapm.2004.12.001 [DOI] [PubMed] [Google Scholar]
- Lawless, H. , & Heymann, H. (2010). Sensory evaluation of food: Principles and practices (2nd ed.). New York: Springer. [Google Scholar]
- Leisner, J. J. , Laursen, B. G. , Prevost, H. , Drider, D. , & Dalgaard, P. (2007). Carnobacterium: Positive and negative effects in the environment and in foods. FEMS Microbiology Reviews, 31, 592–613. 10.1111/j.1574-6976.2007.00080.x [DOI] [PMC free article] [PubMed] [Google Scholar]
- Loretz, M. , Stephan, R. , & Zweifel, C. (2010). Antimicrobial activity of decontamination treatments for poultry carcasses: A literature survey. Food Control, 21, 791–804. 10.1016/j.foodcont.2009.11.007 [DOI] [Google Scholar]
- Lu, P. L. , Liu, Y. C. , Toh, H. S. , Lee, Y. L. , Liu, Y. M. , Ho, C. M. , … Hsueh, P. R. (2012). Epidemiology and antimicrobial susceptibility profiles of Gram‐negative bacteria causing urinary tract infections in the Asia‐Pacific region: 2009–2010 results from the Study for Monitoring Antimicrobial Resistance Trends (SMART). International Journal of Antimicrobial Agents, 40, 37–43. 10.1016/S0924-8579(12)70008-0 [DOI] [PubMed] [Google Scholar]
- Machado, E. , Coque, T. M. , Canton, R. , Sousa, J. C. , & Peixe, L. (2008). Antibiotic resistance integrons and extended‐spectrum β‐lactamases among Enterobacteriaceae isolates recovered from chickens and swine in Portugal. Journal of Antimicrobial Chemotherapy, 62, 296–302. 10.1093/jac/dkn179 [DOI] [PubMed] [Google Scholar]
- Martin, M. F. S. , Sepulveda, D. R. , Altunakar, B. , Gongora‐Nieto, M. M. , Swanson, B. G. , & Barbosa‐Canovas, G. V. (2007). Evaluation of selected mathematical models to predict the inactivation of Listeria innocua by pulsed electric fields. LTW Food Science and Technology, 40, 1271–1279. 10.1016/j.lwt.2006.08.011 [DOI] [Google Scholar]
- McLeod, A. , Mage, I. , Heir, E. , Axelsson, L. , & Holck, A. L. (2016). Effect of relevant environmental stresses on survival of enterohemorrhagic Escherichia coli in dry‐fermented sausage. International Journal of Food Microbiology, 229, 15–23. 10.1016/j.ijfoodmicro.2016.04.005 [DOI] [PubMed] [Google Scholar]
- Michael, C. A. , Dominey‐Howes, D. , & Labbate, M. (2014). The antimicrobial resistance crisis: Causes, consequences, and management. Frontiers in Public Health, 2, 145 10.3389/fpubh.2014.00145 [DOI] [PMC free article] [PubMed] [Google Scholar]
- Mo, S. S. , Norstrom, M. , Slettemeas, J. S. , Lovland, A. , Urdahl, A. M. , & Sunde, M. (2014). Emergence of AmpC‐producing Escherichia coli in the broiler production chain in a country with a low antimicrobial usage profile. Veterinary Microbiology, 171, 315–320. 10.1016/j.vetmic.2014.02.002 [DOI] [PubMed] [Google Scholar]
- Molin, G. (2000). Modified atmospheres In Lund B. M., Baird‐Parker T. C., & Gould G. W. (Eds.), The microbial safety and quality of food (Vol. 1, pp. 214–234). Gaithersburg, MD: Aspen Publishers. [Google Scholar]
- Mugler, D. J. , & Cunningham, F. E. (1972). Factors affecting poultry meat color ‐ review. World's Poultry Science Journal, 28, 400–406. 10.1079/Wps19720017 [DOI] [Google Scholar]
- Mukhopadhyay, S. , & Ramaswamy, R. (2012). Application of emerging technologies to control Salmonella in foods: A review. Food Research International, 45, 666–677. 10.1016/j.foodres.2011.05.016 [DOI] [Google Scholar]
- Murphy, R. Y. , Marks, B. P. , & Marcy, J. A. (1998). Apparent specific heat of chicken breast patties and their constituent proteins by differential scanning calorimetry. Journal of Food Science, 63(1), 88–91. 10.1111/j.1365-2621.1998.tb15682.x [DOI] [Google Scholar]
- Nesbakken, T. (1995). Listeria monocytogenes in the food chain ‐ A foodborne infection problem common to the Nordic countries. Tema Nord 635. Copenhagen, Denmark: Nordic Council of Ministers. [Google Scholar]
- Olsen, E. , Vogt, G. , Veberg, A. , Ekeberg, D. , & Nilsson, A. (2005). Analysis of early lipid oxidation in smoked, comminuted pork or poultry sausages with spices. Journal of Agricultural and Food Chemistry, 53, 7448–7457. 10.1021/jf050886w [DOI] [PubMed] [Google Scholar]
- Organisation for Economic Co‐operation and Development/Food and Agriculture Organization of the United Nations . (2016). OECD‐FAO agricultural outlook 2016–2025. Paris, France: OECD Publishing; Retrieved from 10.1787/agr_outlook-2016-en [DOI] [Google Scholar]
- Overdevest, I. , Willemsen, I. , Rijnsburger, M. , Eustace, A. , Xu, L. , Hawkey, P. , … Kluytmans, J. (2011). Extended‐spectrum beta‐lactamase genes of Escherichia coli in chicken meat and humans, the Netherlands. Emerging Infectious Diseases, 17, 1216–1222. 10.3201/eid1707.110209 [DOI] [PMC free article] [PubMed] [Google Scholar]
- Park, S. Y. , & Ha, S. D. (2015). Ultraviolet‐C radiation on the fresh chicken breast: Inactivation of major foodborne viruses and changes in physicochemical and sensory qualities of product. Food and Bioprocess Technology, 8, 895–906. 10.1007/s11947-014-1452-1 [DOI] [Google Scholar]
- Paskeviciute, E. , Buchovec, I. , & Luksiene, Z. (2011). High‐power pulsed light for decontamination of chicken from food pathogens: A study on antimicrobial efficiency and organoleptic properties. Journal of Food Safety, 31(1), 61–68. 10.1111/j.1745-4565.2010.00267.x [DOI] [Google Scholar]
- Paton, A. W. , Ratcliff, R. M. , Doyle, R. M. , Seymour‐Murray, J. , Davos, D. , Lanser, J. A. , & Paton, J. C. (1996). Molecular microbiological investigation of an outbreak of hemolytic‐uremic syndrome caused by dry fermented sausage contaminated with Shiga‐like toxin‐producing Escherichia coli . Journal of Clinical Microbiology, 34, 1622–1627. [DOI] [PMC free article] [PubMed] [Google Scholar]
- Patterson, R. L. , & Stevenson, M. H. (1995). Irradiation‐induced off‐odour in chicken and its possible control. British Poultry Science, 36, 425–441. 10.1080/00071669508417789 [DOI] [PubMed] [Google Scholar]
- Picozzi, S. , Ricci, C. , Gaeta, M. , Macchi, A. , Dinang, E. , Paola, G. , … Carmignani, L. (2013). Do we really know the prevalence of multi‐drug resistant Escherichia coli in the territorial and nosocomial population?. Urology Annals, 5(1), 25–29. 10.4103/0974-7796.106962 [DOI] [PMC free article] [PubMed] [Google Scholar]
- Pitout, J. D. D. (2010). Infections with extended‐spectrum beta‐lactamase‐producing Enterobacteriaceae changing epidemiology and drug treatment choices. Drugs, 70, 313–333. [DOI] [PubMed] [Google Scholar]
- R_Core_Team . (2016). R: A language and environment for statistical computing. Vienna, Austria: R Foundation for Statistical Computing. [Google Scholar]
- Rowan, N. J. , MacGregor, S. J. , Anderson, J. G. , Fouracre, R. A. , McIlvaney, L. , & Farish, O. (1999). Pulsed‐light inactivation of food‐related microorganisms. Applied and Environmental Microbiology, 65, 1312–1315. [DOI] [PMC free article] [PubMed] [Google Scholar]
- Schimmer, B. , Nygard, K. , Eriksen, H. M. , Lassen, J. , Lindstedt, B. A. , Brandal, L. T. , … Aavitsland, P. (2008). Outbreak of haemolytic uraemic syndrome in Norway caused by stx 2‐positive Escherichia coli O103:H25 traced to cured mutton sausages. BMC Infectious Diseases, 8, 41. 10.1186/1471-2334-8-41 [DOI] [PMC free article] [PubMed] [Google Scholar]
- Shi, H. , & Ho, C. T. (1994). The flavour of poultry meat In Shahidi F. (Ed.), Flavor of meat and meat products (pp. 52–70). London: Blackie Academic & Professional. [Google Scholar]
- Smet, A. , Martel, A. , Persoons, D. , Dewulf, J. , Heyndrickx, M. , Catry, B. , … Butaye, P. (2008). Diversity of extended‐spectrum beta‐lactamases and class C beta‐lactamases among cloacal Escherichia coli isolates in Belgian broiler farms. Antimicrobial Agents and Chemotherapy, 52, 1238–1243. 10.1128/AAC.01285-07 [DOI] [PMC free article] [PubMed] [Google Scholar]
- Sommers, C. H. , Scullen, O. J. , & Sheen, S. (2016). Inactivation of uropathogenic Escherichia coli in ground chicken meat using high pressure processing and gamma radiation, and in purge and chicken meat surfaces by ultraviolet light. Frontiers in Microbiology, 7, 413. 10.3389/Fmicb.2016.00413 [DOI] [PMC free article] [PubMed] [Google Scholar]
- Sommers, C. H. , Sites, J. E. , & Musgrove, M. (2010). Ultraviolet light (254 nm) inactivation of pathogens on foods and stainless steel surfaces. Journal of Food Safety, 30, 470–479. 10.1111/j.1745-4565.2010.00220.x [DOI] [Google Scholar]
- Takeshita, K. , Shibato, J. , Sameshima, T. , Fukunaga, S. , Isobe, S. , Arihara, K. , & Itoh, M. (2003). Damage of yeast cells induced by pulsed light irradiation. International Journal of Food Microbiology, 85(1–2), 151–158. 10.1016/S0168-1605(02)00509-3 [DOI] [PubMed] [Google Scholar]
- Tarek, A. R. , Rasco, B. A. , & Sablani, S. S. (2015). Ultraviolet‐C light inactivation kinetics of E. coli on bologna beef packaged in plastic films. Food and Bioprocess Technology, 8, 1267–1280. 10.1007/s11947-015-1487-y [DOI] [Google Scholar]
- U.S. Food and Drug Administration . (2010). Irradiation in the production, processing and handling of food. Retrieved from http://www.accessdata.fda.gov/scripts/cdrh/cfdocs/cfcfr/CFRSearch.cfm?CFRPart=179&showFR=1
- Ugarte‐Romero, E. , Feng, H. , Martin, S. E. , Cadwallader, K. R. , & Robinson, S. J. (2006). Inactivation of Escherichia coli with power ultrasound in apple cider. Journal of Food Science, 71, 102–108. [Google Scholar]
- United States Department of Agriculture . (2013). Food safety information: The color of meat and poultry. Retrieved from https://www.fsis.usda.gov/wps/portal/fsis/topics/food-safety-education/get-answers/food-safety-fact-sheets/meat-preparation/the-color-of-meat-and-poultry/the-color-of-meat-and-poultry/CT_Index
- van Boekel, M. A. (2002). On the use of the Weibull model to describe thermal inactivation of microbial vegetative cells. International Journal of Food Microbiology, 74(1–2), 139–159. 10.1016/S0168-1605(01)00742-5 [DOI] [PubMed] [Google Scholar]
- van Velzen, E. U. T. , & Linnemann, A. R. (2008). Modified atmosphere packaging of fresh meats ‐ Sudden partial adaptation caused an increase in sustainability of Dutch supply chains of fresh meats. Packaging Technology and Science, 21(1), 37–46. 10.1002/pts.776 [DOI] [Google Scholar]
- Vihavainen, E. , Lundstrom, H. S. , Susiluoto, T. , Koort, J. , Paulin, L. , Auvinen, P. , & Bjorkroth, K. J. (2007). Role of broiler carcasses and processing plant air in contamination of modified‐atmosphere‐packaged broiler products with psychrotrophic lactic acid bacteria. Applied and Environmental Microbiology, 73, 1136–1145. 10.1128/Aem.01644-06 [DOI] [PMC free article] [PubMed] [Google Scholar]
- Weber, S. (2005). Light‐driven enzymatic catalysis of DNA repair: A review of recent biophysical studies on photolyase. Biochimica Et Biophysica Acta‐Bioenergetics, 1707(1), 1–23. 10.1016/j.bbabio.2004.02.010 [DOI] [PubMed] [Google Scholar]
- Wekhof, A. (2000). Disinfection with flash lamps. PDA Journal of Pharmaceutical Science and Technology, 54, 264–276. [PubMed] [Google Scholar]
- World Health Organization . (2014). Antimicrobial resistance: Global report on surveillance. Geneva, Switzerland: Retrieved from http://www.who.int/drugresistance/documents/surveillancereport/en/ [Google Scholar]
- Zhao, C. W. , Ge, B. L. , De Villena, J. , Studler, R. , Yeh, E. , Zhao, S. H. , … Meng, J. H. (2001). Prevalence of Campylobacter spp., Escherichia coli, and Salmonella serovars in retail chicken, turkey, pork, and beef from the Greater Washington, DC, area. Applied and Environmental Microbiology, 67, 5431–5436. 10.1128/Aem.67.12.5431-5436.2001 [DOI] [PMC free article] [PubMed] [Google Scholar]
Associated Data
This section collects any data citations, data availability statements, or supplementary materials included in this article.
Supplementary Materials
Additional Supporting Information may be found online in the supporting information tab for this article.
Supporting Information