Abstract
Purpose
This study was a systematic evaluation across different and prominent diffusion MRI models to better understand the ways in which scalar metrics are influenced by experimental factors, including experimental design (diffusion‐weighted imaging [DWI] sampling) and noise.
Methods
Four diffusion MRI models—diffusion tensor imaging (DTI), diffusion kurtosis imaging (DKI), mean apparent propagator MRI (MAP‐MRI), and neurite orientation dispersion and density imaging (NODDI)—were evaluated by comparing maps and histogram values of the scalar metrics generated using DWI datasets obtained in fixed mouse brain with different noise levels and DWI sampling complexity. Additionally, models were fit with different input parameters or constraints to examine the consequences of model fitting procedures.
Results
Experimental factors affected all models and metrics to varying degrees. Model complexity influenced sensitivity to DWI sampling and noise, especially for metrics reporting non‐Gaussian information. DKI metrics were highly susceptible to noise and experimental design. The influence of fixed parameter selection for the NODDI model was found to be considerable, as was the impact of initial tensor fitting in the MAP‐MRI model.
Conclusion
Across DTI, DKI, MAP‐MRI, and NODDI, a wide range of dependence on experimental factors was observed that elucidate principles and practical implications for advanced diffusion MRI. Magn Reson Med 78:1767–1780, 2017. © 2017 The Authors Magnetic Resonance in Medicine published by Wiley Periodicals, Inc. on behalf of International Society for Magnetic Resonance in Medicine. This is an open access article under the terms of the Creative Commons Attribution‐NonCommercial License, which permits use, distribution and reproduction in any medium, provided the original work is properly cited and is not used for commercial purposes.
Keywords: diffusion tensor imaging, diffusion kurtosis imaging, mean apparent propagator MRI, neurite orientation dispersion and density imaging, noise floor bias, DWI sampling
INTRODUCTION
The measurement and modeling of water diffusion by MRI has spanned a rich history of advancement both by improvement of existing approaches and by theory‐driven generation of new modeling frameworks. A hallmark example is the estimation of the diffusion tensor 1, which has enabled a unique view of the brain by providing metrics that report not only diffusivity, but also anisotropy and fiber‐orientation information 2. A number of important subsequent diffusion modeling approaches have been proposed to more accurately describe the water diffusion in complex environments by accounting for non‐Gaussian diffusion displacement [e.g., diffusion kurtosis imaging (DKI) 3, 4] or modeling the distribution of orientated white matter fiber populations 5. Several modeling approaches are rooted in the q‐space framework 6, 7 and relate the measured signal by Fourier transformation to the 3D probability distribution of water displacement, known as the diffusion propagator. These techniques have been employed for the estimation of fiber orientation distributions 8 or numerical propagator estimation 9 or representing the propagator analytically 10, 11, 12, 13 and are commonly referred to as “physical” or “signal‐driven” models. The outcome scalar metrics of physical techniques report features of water diffusion not biological structure and must be carefully interpreted to make meaningful biological inferences.
A second category of diffusion models, referred to hereafter as “biophysical models,” takes a different approach and uses simplified representations of the microstructural tissue environment and a priori assumptions of how tissue structures affect water diffusivity to construct models that relate diffusion measurements to specific tissue features. Biophysical models have been developed for the description of cellular compartments 14, 15, axon diameters 16, and neurite density and orientation 17. The advantage of biophysical models to report values directly relevant to tissue properties is met by the inherent challenge of representing the full range of tissue environments with a simplified model.
Clearly, no single model can fully capture the complexity of all tissue environments; however, it is important to establish the value and limitations of each model as a guide to the selection, combination, and implementation of diffusion tools for particular objectives across brain studies. Within each class of model, methodological comparisons are commonly made to determine the relative performance of variations in the modeling paradigm or to evaluate the effect of improvements to the approach or implementation. Between‐class comparisons are most often made to evaluate the contribution of newer modeling approaches beyond standard techniques, although there is a growing interest in understanding differences across physical and biophysical frameworks 18, 19, 20 as an important avenue for characterizing the relative capabilities and limitations of each model for detection of tissue differences. However, there are notably few systematic studies across modeling categories explicitly designed to assess the dependence of these approaches on experimental factors such as diffusion sampling scheme and quality of the acquired diffusion‐weighted images (DWIs). An improved understanding of distinguishing features and practical considerations across diffusion models is a means to most effectively apply these tools in a way that optimally addresses the particular objectives of clinical and neurobiological brain studies.
In the current study, scalar metrics were compared across multiple diffusion‐based models using the same DWI datasets from ex vivo mouse brains. From large high‐quality datasets, several subsampled and noise‐manipulated diffusion MRI datasets were generated to explore the effects of DWI sampling and image quality across different and prominent diffusion MRI techniques. The four models selected for this study were intended to represent different categories of diffusion approaches: diffusion tensor imaging (DTI), the well‐established, simple, Gaussian, physical model; DKI, a commonly used physical model with moderate complexity; mean apparent propagator MRI (MAP‐MRI), a more recent physical model with high complexity that estimates the full propagator; and neurite orientation dispersion and density imaging (NODDI), an increasingly popular biophysical model with low complexity based on a priori assumptions about cellular compartments and orientation of neural processes. Maps and histogram values of the scalar metrics generated for each model over the full range of DWI datasets were used to evaluate the consequences of experimental factors 21. The goal of this study was to perform a systematic analysis of the dependence on image quality, DWI sampling range, and model parameters across distinct diffusion modeling approaches to advance the fundamental understanding of differences between these models as well as to provide insight regarding their implementation.
METHODS
Brain Specimens
Perfusion‐fixed brain tissue samples were obtained from four adult male mice (approximate age, postnatal day 140; FVB‐Tg (GadGFP) 45704 Swn/J; stock #003718; Jackson Laboratory, Bar Harbor, Maine, USA). Animals were treated according to national guidelines and institutional oversight. Brain specimens were stored in 4% paraformaldehyde solution for 48 hours and then transferred to a phosphate‐buffered saline solution for rehydration and storage. Prior to imaging, each specimen was transferred to a 10‐mm‐diameter NMR tube system (Shigemi Inc., Allison Park, Pennsylvania, USA) and immersed in fluorinert (FC‐3283; 3M, St. Paul, Minnesota, USA).
DWI Acquisition and Processing
Images were acquired using a Bruker 7T vertical bore microimaging system with Paravision 5.1 software, an Avance III interface, a microWB gradient/probe system, and a 10‐mm radiofrequency coil, and gradients were maintained at 17 °C. For DWI, 297 image volumes were acquired for each specimen using a 3D echo planar imaging pulse sequence with the following parameters: echo time = 37 ms; repetition time = 800 ms; number of excitations = 1; number of segments = 8; and isotropic voxel dimension = 100 μm.
DWI data were acquired using a multishell acquisition with six directions and three repetitions for b = 100, 200, 500, 1000, and 10,000 s/mm2, 32 directions and 1 repetition for b = 1700 and 3800 s/mm2, 56 directions and 1 repetition for b = 6700 s/mm2, and 87 directions and 1 repetition for b = 10,000 s/mm2. All DWIs were acquired using δ = 3 ms and Δ = 20 ms. A b = 0 image was not acquired, but when the analysis software required it (for DKI and NODDI), this was calculated from a separate DTI fit using low b‐value DWIs (b = 100–1700 s/mm2). A T2‐weighted structural image was also acquired using a multislice spin echo sequence with the following parameters: echo time = 30 ms; repetition time = 3000 ms; number of excitations = 1; and the same spatial parameters described for DTI. Total scan time was approximately 45 hours for each mouse brain.
Postprocessing
Processing of DWI data was performed using the TORTOISE software package 22 to correct apparent translational motion induced by frequency drift and diffusion gradients and all volumes were rigidly aligned to the T2 structural, which was rigidly aligned to a template in atlas space 23 by landmark‐based registration with Mipav software (version 5.1.0, http://mipav.cit.nih.gov). Proper reorientation of the diffusion gradient frame of reference was maintained.
Subsampled Datasets to Test Consequences of DWI Sampling
Three subsampled DWI datasets were used in this study: 1) an eight‐shell DWI set, which was the full set of acquired DWIs including b‐values from 100 to 10,000 s/mm2; a six‐shell DWI set, which was a subsampled DWI set including b‐values from 100 to 3800 s/mm2; and a five‐shell DWI set, which was a subsampled DWI set including only b‐values up to 1700 s/mm2. The selection of the sampling schemes were based on the recommended b‐values for DTI (five‐shell set), DKI (six‐shell set), and MAP‐MRI (eight‐shell set).
Noise Manipulated Datasets to Test the Consequences of Image Quality
To examine the effects of DWI signal variance and noise floor, we produced both a “signal‐transformed” version and an “noise‐added” version of the original (eight‐shell) dataset from a single brain. This approach was favored over the more rigorous approach of generating a “noise‐free” DWI dataset as a basis for noise addition, because the use of a single model to generate a noise‐free set would differentially affect the outcomes of each model in a multimodel study—although it should be noted that during preparation of this study, a novel method for model‐free denoising was developed 24 that merits future exploration.
The signal‐transformed DWI dataset was obtained according to methods described previously 25, 26 in which the noise floor is estimated, after which a b‐value–dependent subtraction from each DWI is calculated and applied such that volumes with high signal‐to‐noise ratio (SNR) are mostly unchanged but those with low SNR are adjusted to approach zero rather than the expected rectified noise floor. Importantly, this type of noise subtraction modifies the rectified noise floor but does not greatly affect the signal variance.
Two noise‐added DWI datasets were generated from the eight‐shell DWI by addition of Gaussian distributed white noise using the procedure described by Pierpaoli and Basser 27. The standard deviation values of the added noise were 20% and 50% of the signal measured in a typical gray matter region in the cortex, which is equivalent to reducing the SNR by 17% and 33%, respectively. Importantly, this procedure increases both the signal variance and the level of the noise floor.
Modeling Frameworks: General Theory, Implementation, and Metric Maps
For each of the aforementioned datasets with different DWI sampling range or manipulated noise properties, DTI, DKI, MAP‐MRI, and NODDI frameworks were applied and the relevant metric maps were generated as follows.
DTI
The diffusion tensor was fit using TORTOISE software 22 with nonlinear tensor fitting and maps were generated for the Trace of the diffusion tensor, axial diffusivity (DAX), radial diffusivity (DRAD), and fractional anisotropy (FA).
DKI
Data were fit by the DKI model using diffusion kurtosis estimator software 4 for Linux using the default modeling options of weighted and constrained linear least‐squares fitting. Median filtering was turned off to eliminate inappropriate data exclusion, and no smoothing or interpolation was used. Maps for mean kurtosis (Kmean), axial kurtosis (Kaxial), radial kurtosis (Kradial), and kurtosis fractional anisotropy (KFA) 28 were generated by the software as well as DTI metrics from both the DKI fit and a DTI‐only fitting of the data.
MAP‐MRI
The MAP‐MRI framework 12 uses the anisotropic simple harmonic oscillator (ASHO) functions to represent the DWI signal in “q‐space” and mean apparent propagator in displacement space as a Fourier pair of series expansions, with the lowest order term of the mean apparent propagator being dependent on the diffusion tensor. In this study, the MAP‐MRI computation to determine the coefficients of the ASHO series was performed using customized IDL code (version 8.4, Excelis Visual Information Solutions, Inc.). A 6th‐order expansion was selected for the eight‐shell DWI set, and a 4th‐order expansion was used for the five‐shell and six‐shell DWI sets. Previously described scalar metrics 12, 29 were generated including the return to origin probability (RTOP), return to axis probability (RTAP), return to plane probability (RTPP), non‐Gaussianity (NG), and propagator anisotropy (PA).
The eight‐shell DWI dataset was used for the initial tensor estimation step; however, additional investigation of the importance of the initial diffusion tensor estimate was performed using the five‐shell DWI dataset instead.
NODDI
The NODDI model 17, 30 for ex vivo data was fit using the NODDI toolbox (http://mig.cs.ucl.ac.uk) for MATLAB (R2013a, MathWorks, Natick, Massachusetts, USA). The software default values for ex vivo tissue were used for the fixed parameters of isotropic free diffusivity (DISO) = 2000 μm2/s and intrinsic diffusivity (DIN) = 600 μm2/s. The estimated parameters were the isotropic volume fraction (VISO), intracellular volume fraction (VIC), and intracellular restricted volume fraction (VIR). Metric maps for these parameters as well as for the orientation dispersion index (ODI) were generated and analyzed.
A secondary analysis of the consequence of the fixed parameters was performed by implementing the model as described above except with a change of the DIN parameter to values over the range 200–1200 μm2/s.
Statistical Analysis
Quantitative analysis was performed using MATLAB tools (R2014b, MathWorks). For a general depiction of the relationship between DWI signal values and fitted DTI and DKI curves, the mean signal intensity in a gray matter region of interest for each DWI was plotted on a logarithmic scale against the b‐value. Using the mean values for diffusivity and kurtosis in the same region of interest, curves were generated for the DTI and DKI signal models and plotted on the same graphs as the data points (Figs. 1b and 1c, respectively).
Figure 1.
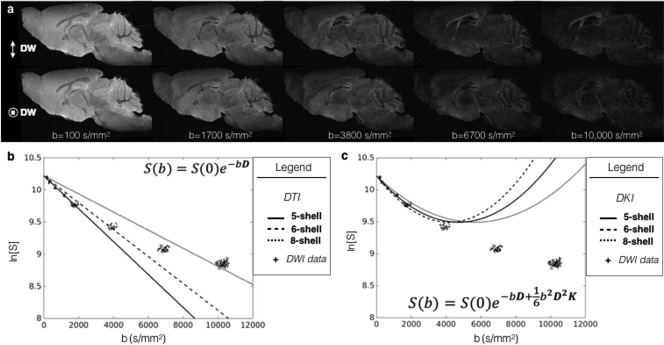
Diffusion weighting and the MRI signal for the fixed mouse brain. (a) Diffusion‐weighted images are shown for a representative sagittal slice in the fixed mouse brain across a range of b‐values (b = 100‐10,000 s/mm2) with gradient directions along the dorsal‐ventral axis (top row) and left‐right axis (bottom row). (b) To demonstrate the relationship between DWI data and the diffusion model, the mean signal value within a region of gray matter is plotted for each DWI volume against the b‐value at which the image was acquired. Theoretical curves are also plotted for the diffusion model fit with the five‐, six‐, and eight‐shell DWI sampling schemes used in this study. (c) The same DWI data as in panel b is plotted with the theoretical curves for diffusion kurtosis imaging fit with each of the DWI sampling scheme sets.
Whole Brain Histograms
To analyze the effects of DWI sampling and noise on the scalar metrics generated from each dataset, whole brain histograms were generated for each metric map using data from all brain voxels and a set number of uniform width bins between user‐defined limits (e.g., for FA, 0 and 1). Scalar metric maps shown alongside the histogram analysis were windowed based on the same limits that were used for histograms. In Figures 2, 3, 4, the histograms for each of the four brains included in this study are shown for each DWI sampling scheme, and in Figures 5, 6, 7, 8, histograms are shown from a single brain.
Figure 2.
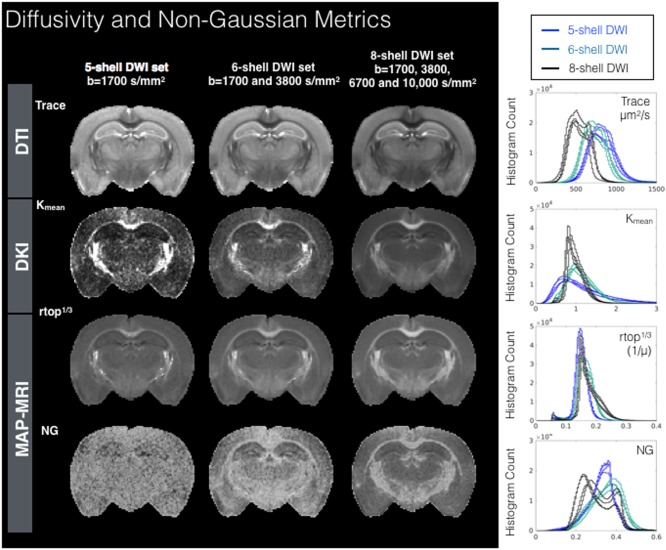
Metric maps and histograms for DTI, DKI, and MAP‐MRI models fit using diffusion weighted data from three sampling schemes having five, six, and eight shells. Maps are shown for a representative slice for each DWI sampling scheme and whole brain density histogram plots are shown (right column) for each of four mouse brain samples. Abbreviations: Kmean, mean kurtosis; NG, non‐Gaussianity; rtop, return to the origin probability.
Figure 3.
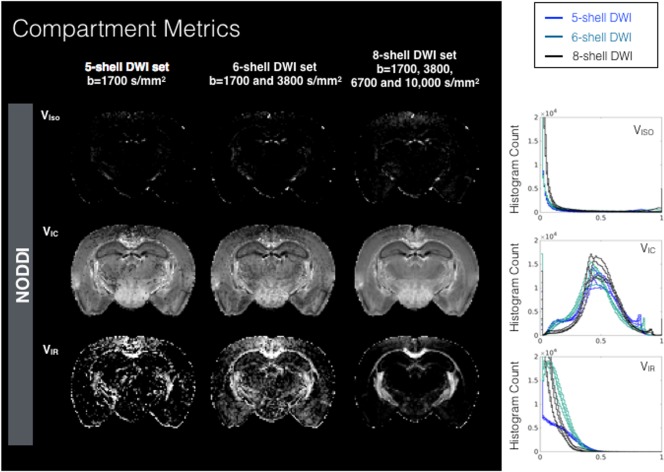
Metric maps and histograms for compartmental fractions from the NODDI model fit using DWIs from different sampling schemes having five, six, and eight shells. Maps are shown for representative slice for each DWI sampling scheme and whole brain density histogram plots (right column) for each of the four mouse brain samples are shown. Abbreviations: VIC, intracellular volume fraction; VIR, intracellular “restricted” volume fraction; VISO, isotropic volume fraction.
Figure 4.
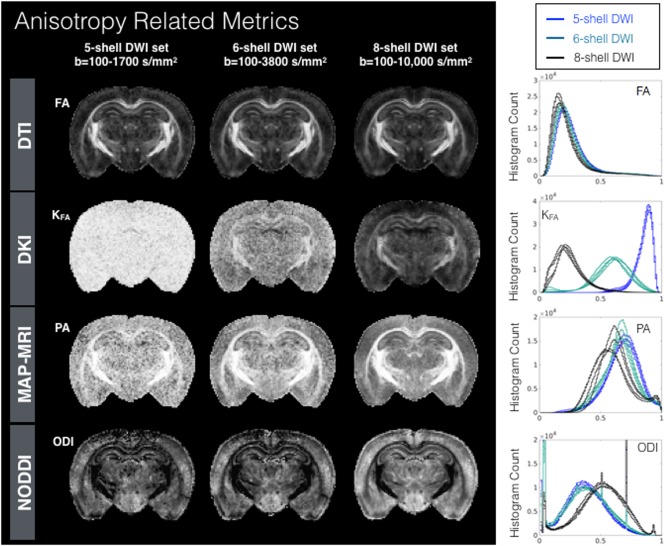
Metric maps and histograms to probe water anisotropy for DTI, DKI, MAP‐MRI, and NODDI models fit using diffusion‐weighted data from three sampling schemes having five, six, and eight shells and density histogram plots (right column) for each metric in four mouse brain samples show the distribution of metric values. PDF histograms are normalized bin counts of metric values (x‐axis) and CDF histograms are the cumulative normalized bin counts for the metric value. Abbreviations: FA, fractional anisotropy; KFA, kurtosis FA; ODI, orientation dispersion index; PA, propagator anisotropy.
Figure 5.
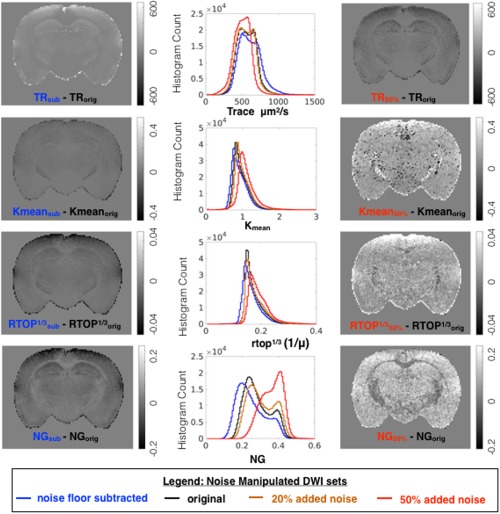
Effects of signal transformation and added noise for metric maps related to diffusivity and non‐Gaussianity. For each metric, whole brain histograms are shown for modeling of the original DWI dataset (black) and of the same dataset following noise floor subtraction (blue), addition of 20% or 50% rectified noise (orange and red, respectively). To visualize the localization of metric differences resulting from noise manipulation, difference maps are shown for the same slice.
Figure 6.
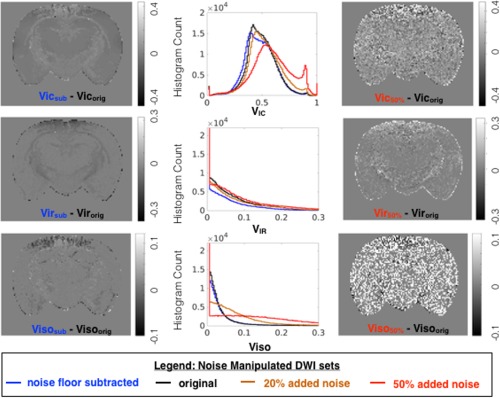
Effects of signal transformation and added noise for metric maps for compartmental fractions from the NODDI model. For each metric, whole brain histograms are shown for modeling of the original DWI dataset (black) and of the same dataset following noise floor subtraction (blue), addition of 20% or 50% rectified noise (orange and red, respectively). To visualize the localization of metric differences resulting from noise manipulation, difference maps are shown for the same slice.
Figure 7.
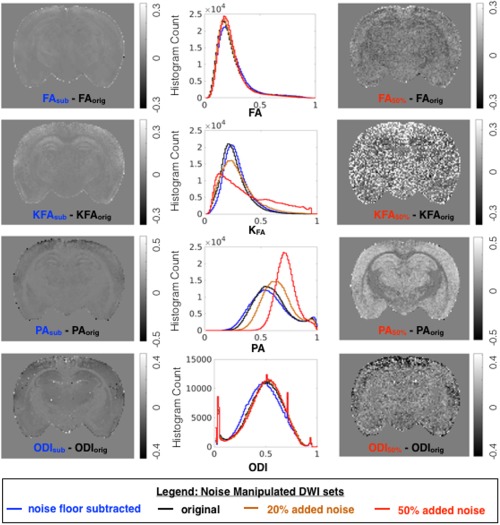
Effects of modeling DWI data after signal transformation (blue) and added noise (orange, 20%; red, 50%) were compared with modeling of the original DWI dataset (black) across anisotropy metrics from DTI, DKI, MAP‐MRI, and NODDI. Whole brain histograms report the distribution of each metric generated from datasets, and difference maps are shown to compare and localize metric value changes due to noise manipulation.
Figure 8.
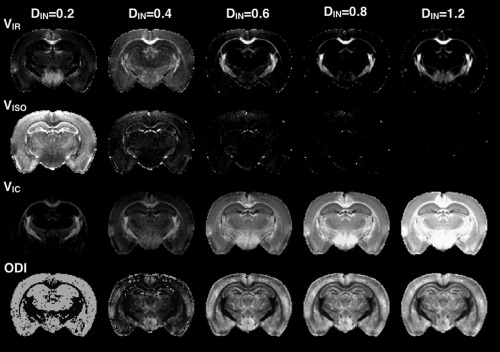
Effects of the fixed parameter Din on the NODDI metrics maps of VIR, VISO, VIC, and ODI are shown by representative slices from metric maps generated for the same DWI dataset following NODDI modeling with different values for DIN.
Difference Maps
To visualize the effects of manipulated noise properties, difference maps were generated by simple subtraction of the original metric maps from metric maps generated using subtracted or added noise datasets. To represent these maps consistently across metrics, the window levels were adjusted based on the full‐width at half‐maximum values of the original metric histogram when possible.
RESULTS
The Consequences of DWI Sampling
To provide an encompassing view of the impact of DWI sampling across the models in this study, each metric map that was generated using the five‐, six‐, and eight‐shell DWI sampling schemes is shown for the same representative slice. Alongside maps for each metric are whole brain histograms for each of the four brains comparing all DWI datasets (see Figures 2, 3, 4 and http://onlinelibrary.wiley.com/store/10.1002/mrm.26575/asset/supinfo/mrm26575-sup-0001-suppinfo.pdf?v=1&s=10b7e24546a29a00c1a34de3279b7da43df34e45). Generally, the histograms and maps for all metrics demonstrated dependence on the DWI sampling, but to a remarkably variable degree and with different attributes of dependence across metrics. Reproducibility of the histograms across samples was notably high.
Diffusivity and Compartmental Metrics
Maps and histograms for Trace, Kmean, RTOP, and NG are shown in Figure 2. Trace spans a large range of values and decreased values with increased DWI sampling range; however, the shape of the Trace histogram does not depend greatly on the DWI sampling scheme. The histograms for Kmean across different DWI schemes were markedly different from one another in shape and mode, indicating a strong dependence on sampling range. The mode of the RTOP histogram was notably stable across DWI sampling schemes; however, higher b‐value sampling corresponded to increased RTOP values for white matter voxels with a positive skew for the higher RTOP values. The NG histograms and maps showed marked differences across DWI schemes from an anatomically nonspecific and noisy map for the five‐shell DWI set to a less noisy map with higher values, especially in white matter and a bimodal distribution in the histogram for the eight‐shell DWI set. Maps and histograms for the three NODDI volume fraction maps (VISO, VIC, and VIR) are shown in Figure 3 and demonstrate variable degrees of dependence on DWI sampling scheme, with the least effect for the VIC fraction and greatest effect for the VIR fraction.
Cylindrical Metrics
Histogram values and maps for axial and radial scalar metrics are shown for the three DWI sampling schemes in http://onlinelibrary.wiley.com/store/10.1002/mrm.26575/asset/supinfo/mrm26575-sup-0001-suppinfo.pdf?v=1&s=10b7e24546a29a00c1a34de3279b7da43df34e45. DAX and DRAD had histogram features similar to those for Trace, with a relatively wide distribution of values and mode shift for greater DWI range. The histogram analysis of KAX and KRAD revealed an interesting difference in histogram profile for the five‐shell DWI set in which the KAX values had a noisy appearance in the map with a flat histogram, whereas the KRAD histogram was more normally distributed with values that were more specifically localized to different brain structures. For the six‐shell and eight‐shell DWI sets, KAX and KRAD demonstrated behavior similar to that of the Kmean profile. The RTPP, which is informative of axial water displacement, demonstrated a remarkably consistent histogram profile—whereas the RTAP, which is informative of radial water displacement, was similar in profile to the RTOP with no shift in mode, but had a shape change of positive skew in the higher RTAP values with larger b‐value sampling range.
Anisotropy Metrics
Histograms and maps of FA, KFA, PA, and ODI are shown in Figure 4. FA maps and histograms were notably similar across all DWI sampling schemes. KFA demonstrates remarkable sensitivity to the DWI sampling with high values of KFA with no remarkable spatial pattern for the five‐shell DWI set, and more spatially localized concentration of high KFA values to white matter regions for the six‐shell and eight‐shell DWI sets, but still with wide differences in the mode of the histogram profiles. The mode of PA for the five‐shell DWI set also demonstrated a high value, and the maps were fairly noisy, although the highest PA values mapped to white matter regions. Small differences in the mode were found for PA between the five‐shell and six‐shell DWI sets, with a clear shift to lower values for the eight‐shell dataset. Moreover, the eight‐shell dataset showed a bimodal distribution, with a small second peak at high values. The ODI maps and histograms were similar for the five‐shell and six‐shell DWI sets, whereas the ODI histogram was relatively shifted for the eight‐shell DWI set which in addition to a greater range of b‐values had higher angular sampling than the other two sets.
The Consequences of Noise
Noise floor bias reduction by signal transformation affected the models investigated differently (Figs. 5, 6, 7, blue lines). Trace values and also axial and radial diffusivity (http://onlinelibrary.wiley.com/store/10.1002/mrm.26575/asset/supinfo/mrm26575-sup-0001-suppinfo.pdf?v=1&s=10b7e24546a29a00c1a34de3279b7da43df34e45) were shifted to higher values with a greater effect found for the higher diffusivity range, whereas the FA histogram exhibited only a slight positive shift, but no change in shape. The mean kurtosis and RTOP exhibited a negative shift for the lower range of values, and the KFA demonstrated only a slight positive shift, similar to FA. The somewhat unexpected effects of noise floor on NG and PA were decreased NG values over the full range but a selective decrease of only the lower PA values. Furthermore, the PA and NG difference maps showed selective vulnerability of gray matter regions. Changes in NODDI metrics included a decrease in VIR that was greater for white matter, decreased VIC preferentially for low values and a slight histogram mode shift in ODI.
The effects of added rectified noise (Figs. 5, 6, 7 and http://onlinelibrary.wiley.com/store/10.1002/mrm.26575/asset/supinfo/mrm26575-sup-0001-suppinfo.pdf?v=1&s=10b7e24546a29a00c1a34de3279b7da43df34e45, orange and red lines) were generally in the opposite direction as the changes described above, but also included more dramatic changes in histogram distributions. The Trace was influenced very little by low levels of added noise, but 50% added noise resulted in decreased values and narrowing of the distribution. The FA histogram distribution was not greatly affected by added noise; however, the difference map demonstrated a speckled appearance. Added noise substantially affected DKI and MAP‐MRI metrics including increased Kmean and RTOP values and the greatest vulnerability for KFA, PA, and NG, which changed considerably in mode and shape. An interesting distinction among these was the preferential susceptibility to the effect of noise in the gray matter regions observed for PA and NG difference maps. The effects of added noise on NODDI metrics are a small change to the distribution of VIR and a much more notable change for VIC. The histogram of ODI values remained remarkably unchanged by the addition of noise to the raw data; however, the difference map for ODI showed increased variability across the brain.
The Consequences of Fixed Parameters on NODDI Metrics
Modification of the fixed parameter, DIN, in the NODDI model produced considerable systematic changes in the outcome metrics (Figs. 8 and 9). For extremely low assumed DIN (200 μm2/s), the VISO was greatly increased, whereas the other compartment fractions were decreased and ODI was inaccurate. For extremely high assumed DIN (1200 μm2/s), the most affected metric was VIC, which was increased and in many voxels estimated to be 1. The VIR and ODI were less affected by assuming high DIN, although in some regions (e.g., the hypothalamus), the VIR exhibited a curious increase that is likely related to the presence of DWI signal at high b‐values in this region, which also influenced the metrics of other models (e.g., NG, RTOP, and Kmean). The metric results from modeling with intermediate values of DIN suggest that assuming a low value for DIN is more consequential than assuming a high value. In addition, fitting of the NODDI model with DIN as a free parameter (http://onlinelibrary.wiley.com/store/10.1002/mrm.26575/asset/supinfo/mrm26575-sup-0001-suppinfo.pdf?v=1&s=10b7e24546a29a00c1a34de3279b7da43df34e45) reveals heterogeneity in this value across the brain from 0.4 to 0.8 μm2/s and anatomical contrast evident on the DIN map.
Figure 9.
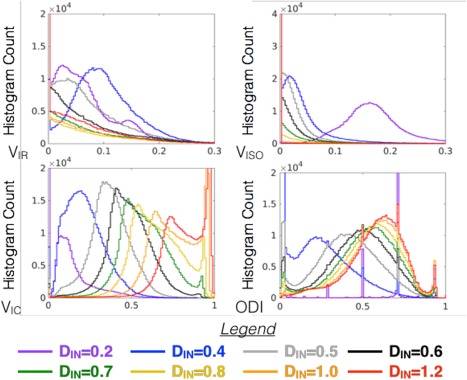
Whole brain histograms for compartmental and orientation compare the distribution of metric values generated by NODDI modeling over a range of DIN values corresponding to the maps shown in Figure 8.
The Consequences of Model Selection, Constraints, and Weighting on DKI and DTI Scalar Metrics
Investigation of DTI metrics derived from the DKI model compared with DTI‐only modeling in the DKE software are shown in http://onlinelibrary.wiley.com/store/10.1002/mrm.26575/asset/supinfo/mrm26575-sup-0001-suppinfo.pdf?v=1&s=10b7e24546a29a00c1a34de3279b7da43df34e45 and indicate that MD values are stable when derived from the DKI model, but vulnerable to systematic bias in mode (similar to Fig. 3) when derived from DTI‐only. Whereas model order and experimental factors of image quality and DWI sampling were shown in this study to greatly influence DKI scalar metrics, changing DKE software options to govern tensor fitting—specifically, constrained compared with unconstrained and weighted compared with unweighted tensor fitting options—were not found to substantially affect histograms for Kmean of KFA (data not shown).
The Consequences of Tensor Estimation on MAP‐MRI Metrics
The initial estimation of the diffusion tensor was shown to differentially affect several MAP‐MRI indices (Fig. 10). When the DT was estimated using low b‐value DWIs instead of the full set, higher RTOP values were preferentially reduced and the RTOP map showed less tissue contrast. The PA map also showed less contrast, but greater homogeneity in gray matter regions and the histogram shape was modified. NG was greatly affected by the initial DT estimation with increased values, histogram shape changes, and low contrast in the NG map.
Figure 10.
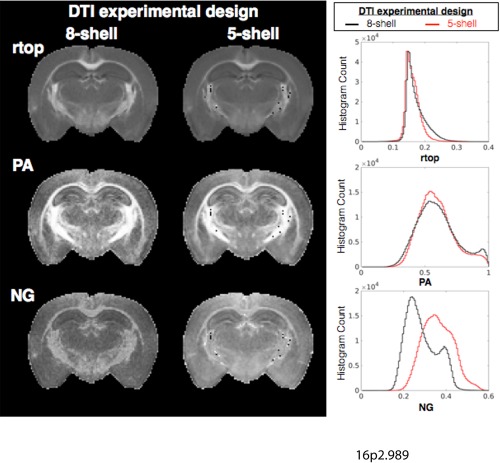
The effects of initial tensor estimation on MAP‐MRI metrics. Maps of rtop, PA, and NG are shown for the same slice after MAP modeling performed using an estimate for the diffusion tensor based on all DWIs (eight‐shell, left column) or based on only low b‐value DWIs (five‐shell, right column). Whole brain histograms are also shown to report systematic differences in MAP‐MRI metrics that are the consequence of the initial tensor fitting. Abbreviations: NG, non‐Gaussianity; PA, propagator anisotropy; rtop, return to the origin probability.
DISCUSSION
The present study is a systematic evaluation of the influence of image quality, DWI sampling, and model‐specific parameters across four different and prominent models for diffusion MRI. By comparing computed scalar metrics from different models using identical DWI datasets designed to probe the roles of experimental factors, several key observations were made about model complexity and DWI sampling, the selective effects of the noise floor and signal variance, and the consequences of model‐specific parameters.
A broad view of the maps and histogram values of scalar metrics in this study reveals a wide range of susceptibility to changes in DWI sampling and noise levels both across and within models. Notably, individual differences between brain specimens (i.e., lines of the same color in the histograms of Figs. 2, 3, 4) were far less consequential than the dependence of most metrics on imaging experimental factors, which demonstrates the challenges of interpreting observed differences in quantitative diffusion MRI metrics either across or within studies conducted with different noise sensitivities or DWI sampling schemes.
Model Complexity and DWI sampling
The potential to glean new information about biological structure from the diffusion MRI paradigm is the primary impetus for the development and application of advanced diffusion modeling. For physical models, fitting of DWI data to higher‐order models can potentially characterize water displacement in greater detail, but could also result in an ill‐conditioned problem with a larger number of estimated parameters (i.e., DTI = 6, DKI = 21, MAP = 50 for order 6). The model complexity of any approach requires collection of sufficiently many DWIs to provide enough information for fitting the signal and to avoid violating the assumptions of the model or overfitting the data. For example, using DTI to model high b‐value data that deviate considerably from monoexponential signal decay violates the model assumptions. At the same time, estimation of non‐Gaussian parameters from data with insufficient diffusion sensitization or angular sampling may result in incorrect and misleading metric values.
Sensitivity of modeling techniques and scalar metrics to the DWI sampling scheme can result from instability of a method but also from its ability to represent new information. In this study, whole brain histogram analysis was employed as a way to evaluate both the influence of DWI sampling across models and also to provide insight about detrimental and beneficial sensitivity of various scalar metrics to DWI sampling. Some histogram changes, especially the enhancement of shape features, could indicate that the model is more capable of taking advantage of the additional information sampled with larger range of diffusion sensitization; therefore, it could represent improved modeling. On the other hand, high susceptibility of metric values to DWI sampling that is not consistent with an expected improvement in sensitivity or specificity would indicate lower reliability for that metric. In this case, the comparability of data collected with different sampling strategies is intrinsically lower, and the effect of data removal because of artifacts such as those originating from subject motion are more consequential.
The primary DTI metrics observations in this study were a systematic decrease of Trace values with increased DWI sampling without considerable changes to the histogram shape, which can be expected from the combined effects at high b‐values of gray matter signal that is near the noise floor and white matter signal that is dominated by restriction effects. It is notable that DTI metrics derived from the DKI model did not exhibit this systematic bias, which is consistent with previous work 31. Surprisingly, FA showed little dependency on DWI sampling. Robustness of DTI metrics to DWI sampling could be desirable for clinical applications at the expense of potentially not being able to extract new information from higher b‐value DWI data.
Unlike DTI, higher‐order models (i.e., MAP‐MRI and DKI) showed a strong dependence on DWI sampling. The most complex physical model investigated in this study was MAP‐MRI 12, although differences were evident among the scalar metrics. The zero‐displacement probability (RTOP, RTAP, and RTPP) metrics demonstrated remarkable stability of mode across the full range of DWI sampling, indicating immunity to noise floor effects. The stability in histogram mode of the zero‐displacement metrics was accompanied by histogram shape changes for the high value range that emerged only when high b‐values were included, suggesting increased sensitivity to restriction effects present in white matter. In contrast, the NG and PA metrics were highly sensitive to the DWI sampling in a pattern that suggests they may only be useful if DWIs are collected for high diffusion weighting. This dependence on inclusion of high b‐values has also been noted for in vivo human data and has been found to be more consequential than balanced subsampling of a large DWI dataset 29.
DKI metrics were highly vulnerable to the effects of DWI sampling, demonstrating considerable shape changes for Kmean and highly sensitive histogram behavior for KFA. The dependence of DKI metrics to diffusion sampling has been emphasized in the original description of the model and beyond as an important consideration of applying this approach 3, 4. The basis for this effect is likely the expansion from the 2nd‐order DTI model, which decreases monotonically, to the 4th‐order DKI model, which is quadratic in b‐value (see Fig. 1c). Furthermore, this dependence on DWI sampling may differentially influence DKI metrics generated for different tissue types or even along different axes (e.g., comparing Krad and Kax in Fig. 3).
DWI sampling is not nearly as consequential for the biophysical NODDI model, which has low model complexity. The intracellular restricted volume fraction was perhaps the most sensitive to DWI sampling, suggesting that high b‐value DWI data contributes in a meaningful way to the modeling of restricted geometry by this model. The observation of systematically increased ODI with the inclusion of higher b‐value DWI data may suggest sensitivity to DWI sampling, although the higher angular sampling in the full DWI dataset may explain this.
Noise Floor and Signal Variance Effects
The influence of measurement noise on diffusion MRIs becomes increasingly relevant as the model requirements for stronger diffusion weighting increase. In previous studies, noise has been shown to affect DTI results as a consequence of both increased signal variance—for example, affecting the sorting of the eigenvalues in DTI or the measured diffusion anisotropy 27, 32, 33 and rectified noise floor, especially as it pertains to the estimated ellipsoid shape 34. In this study, we tested the effects of both reducing noise floor bias and adding noise. Unlike the analysis of DWI sampling in the previous section, for which changes in histogram shape and mode could imply either strength or weakness of the approach, any change in the histogram due to altered DWI noise should be considered a weakness.
A comparison of spatial variance (speckled appearance) in homogeneous tissue regions of the difference maps suggests that Trace is the most robust metric to added noise, followed by FA. DKI metrics, especially KFA, demonstrate high susceptibility to noise‐induced variance, and the other metrics including NG, VIC, and ODI show intermediate susceptibility. Difference maps of NG and PA both demonstrated dependence on tissue type with the largest magnitude differences in gray matter regions. This may be explained by the predominance of Gaussian water displacement in gray matter compared with white matter.
Noise floor effects were not evident for the metrics computed in the NODDI model, perhaps with the exception of VIC. This may be related the NODDI model accounting for noise effects as part of the model implementation 35, 36. Corrections for the effects of noise are also included as options in the DKI modeling implementation 4 as either a simplified noise floor removal process 37 or the option to smooth the DWI data, which will reduce the effects of signal variance. In fact smoothing of DWI data by a factor of 1.25 the voxel size is the default setting of the DKE implementation, but this setting should be carefully considered as the effect of smoothing raw data prior to fitting may change the accuracy of the outcome metrics.
The Influence of Model‐Specific Assumptions and Parameter Settings
Diffusion models are not only affected by experimental factors, but also by model fitting procedures. These may be inherent to the model or built into the software, but some settings or procedures require researcher input and their selection should bear considerable importance for appropriate modeling and interpretation. Biophysical models by their nature depend most heavily on model parameters and assumptions as they are defined by assumptions about tissue geometry and how measured DWI signal relates to the model. In the NODDI model, two fixed parameters relate the diffusion signal to the tissue model: isotropic diffusivity (DISO) and intrinsic free diffusivity (DIN). DISO is the diffusivity of free water, which should be well characterized, but DIN is an apparent diffusivity measure and depends on hindrance of water diffusion in the tissue environment and is heterogeneous across tissue types. This fixed parameter may be changed within the NODDI toolbox, but the default fixed values for in vivo and ex vivo DIN are 1700 μm2/s and 600 μm2/s, respectively, based on their expected values 17, 30, 36. The effect of manipulating DIN in the current study (Figs. 8 and 9) outweighed the effects of experimental factors and resulted in both systematic changes (i.e., histogram shifts) and tissue‐selective effects. When DIN was left as a free parameter, there was a distribution of fitted values between 400 and 800 μm2/s and the scalar map for DIN revealed some anatomical structure emphasizing the heterogeneity of this value across the tissues of the brain and suggesting that selection of a fixed value may influence the appropriateness of the model for all tissues (see http://onlinelibrary.wiley.com/store/10.1002/mrm.26575/asset/supinfo/mrm26575-sup-0001-suppinfo.pdf?v=1&s=10b7e24546a29a00c1a34de3279b7da43df34e45). Beyond outcomes of bias and reduced precision of this modeling approach, other reports have found that the selection of fixed parameters in a two‐compartment NODDI model may drive the solutions toward distinct and disconnected local minima 38. Although the strong dependence of the NODDI model on the selection of DIN should be expected, it is also important to emphasize its influence on compartmental and orientation metrics as a caveat for implementing this model and interpreting the resulting maps.
Physical models do not require the selection of fixed parameters, but each model has a set of assumptions, fitting constraints, or implementation settings that may affect the outcome metrics and their interpretation. For example, the estimation algorithm, weightings, and constraints can affect the fitting accuracy of DTI 39 and DKI 4. In the present study, the application of constraints and weightings for tensor fitting by the DKE software was not nearly as consequential as experimental factors such as image quality or DWI sampling. In MAP‐MRI, the range of DWI data that is used for the initial estimation of the diffusion tensor can affect the estimation of propagator metrics. The primary arguments for using only low b‐value data for initial DTI estimation are a straightforward interpretation of the NG measures that is consistent with the existing corpus of DTI literature. The primary arguments for using the entire DWI range for initial DTI estimation are lower fitting errors and a more accurate estimate of tensor orientation. Evidence for improved maps using the full DWI set for tensor estimation is shown in Figure 8 and also in the seminal paper 12, yet both approaches are meaningful in different ways that should be considered for interpretation of MAP indices.
CONCLUSIONS
As diffusion models increase in complexity and begin to include relevant biological information more directly, it becomes important to identify the new capabilities of these approaches and also to place them into context. In the present study, ex vivo specimens were used, which limit the generalization of these findings to the in vivo brain, but allow for comprehensive sampling and high quality DWIs that enable this type of investigation. By systematic evaluation of four representative and popular diffusion models in comprehensive, high‐quality DWI datasets, observations regarding the influence of image quality, DWI sampling, and model parameters revealed fundamental differences between models and practical insight about implementation of the approaches. In particular, model‐specific parameters greatly affected the NODDI metric values, although they were highly stable across DWI sampling and image quality. On the other hand, several metrics from the DTI and MAP‐MRI models were dependent on DWI sampling, and DKI metrics were highly sensitive to the effects of DWI sampling and noise. Although no single model stands apart from the others as the best tool, this investigation provides context for understanding, selecting, and effectively implementing diffusion MRI modeling approaches in neurobiological research.
Supporting information
Additional Supporting Information may be found in the online version of this article
Table S1. Values for the quantitative comparison of scalar metrics are provided including the relative error to compare the mean value of each metric obtained using six‐shell and eight‐shell sampling to the value obtained with five‐shell sampling where greater values indicate a greater histogram shift. The coefficient of variation is also given for each scalar metric obtained using different DWI sampling to describe the relative variability across datasets where greater values indicate grater variability. Only metrics for which histograms were unimodal are reported (i.e. NG, VIR, and VISO are excluded).
Fig. S2. Metric maps and histograms to probe water movement along the primary eigenvector (Dax, Kax, and rtpp) and perpendicular to it (Drad, Krad, and rtap). DTI, DKI, and MAP‐MRI models were fit using diffusion‐weighted data from three sampling schemes having 5, 6, and 8 shells and density histogram plots (right column) for each metric in 4 mouse brain samples show the distribution of metric values. Metric map abbreviations: Dax, axial diffusivity; Drad, radial diffusivity; Kax, axial kurtosis; Krad, radial kurtosis; rtap, return to the axis probability; rtpp, return to the plane probability.
Fig. S3. The effects of signal transformation and added noise are shown for metric maps for cylindrical components from the DTI, DKI, and MAP models. For each metric, whole brain histograms are shown for modeling of the original DWI dataset (black) and of the same dataset following noise floor subtraction (blue), addition of 20% or 50% rectified noise (orange and red respectively). To visualize the localization of metric differences resulting from noise manipulation, difference maps are shown for the same slice.
Fig. S4. Interstitial diffusivity (DIN) as a free parameter. The NODDI made was fit with DIN left as a free parameter and the scalar image (left) and histogram of values are shown in this figure. Notably, DIN spans a range of values and appears to demonstrate some dependence on tissue type.
Fig. S5. The effects of DWI sampling scheme on DTI metrics derived from the DKI model (MD‐DKI and FA‐DKI) or from the DTI model using the DKE implementation (MD‐DTI‐DKE and FA‐DTI‐DKE). The MD maps and histogram mode and shape are relatively stable across the full range of DWI sampling schemes when estimated from the DKI model, but demonstrate DWI sampling dependence when estimated from the DTI model alone.
ACKNOWLEDGEMENTS
We thank the Henry M. Jackson Foundation for the Advancement of Military Medicine, Inc. for administration.
REFERENCES
- 1. Basser PJ, Mattiello J, LeBihan D. MR diffusion tensor spectroscopy and imaging. Biophys J 1994;66:259–267. [DOI] [PMC free article] [PubMed] [Google Scholar]
- 2. Pierpaoli C, Jezzard P, Basser PJ, Barnett A, Di Chiro G. Diffusion tensor MR imaging of the human brain. Radiology 1996;201:637–648. [DOI] [PubMed] [Google Scholar]
- 3. Jensen JH, Helpern JA, Ramani A, Lu H, Kaczynski K. Diffusional kurtosis imaging: the quantification of non‐Gaussian water diffusion by means of magnetic resonance imaging. Magn Reson Med 2005;53:1432–1440. [DOI] [PubMed] [Google Scholar]
- 4. Tabesh A, Jensen JH, Ardekani BA, Helpern JA. Estimation of tensors and tensor‐derived measures in diffusional kurtosis imaging. Magn Reson Med 2011;65:823–836. [DOI] [PMC free article] [PubMed] [Google Scholar]
- 5. Tournier JD, Calamante F, Gadian DG, Connelly A. Direct estimation of the fiber orientation density function from diffusion‐weighted MRI data using spherical deconvolution. NeuroImage 2004;23:1176–1185. [DOI] [PubMed] [Google Scholar]
- 6. Callaghan PT, Eccles CD, Xia Y. NMR microscopy of dynamic displacements: k‐space and q‐space imaging. J Phys E 1988;21:820. [Google Scholar]
- 7. Callaghan PT, MacGowan D, Packer KJ. High‐resolution q‐space imaging in porous structures. High‐resolution q‐space imaging in porous structures. J Magn Reson Imaging 1990;90:177–182. [Google Scholar]
- 8. Tuch DS. Q‐ball imaging. Magn Reson Med 2004;52:1358–1372. [DOI] [PubMed] [Google Scholar]
- 9. Wedeen VJ, Hagmann P, Tseng W‐YIY, Reese TG, Weisskoff RM. Mapping complex tissue architecture with diffusion spectrum magnetic resonance imaging. Magn Reson Med 2005;54:1377–1386. [DOI] [PubMed] [Google Scholar]
- 10. Cheng J, Jiang T, Deriche R. Nonnegative definite EAP and ODF estimation via a unified multi‐shell HARDI reconstruction. Med Image Comput Comput Assist Interv 2012;15:313–321. [DOI] [PubMed] [Google Scholar]
- 11. Hosseinbor AP, Chung MK, Wu Y‐CC, Alexander AL. Bessel Fourier orientation reconstruction (BFOR): an analytical diffusion propagator reconstruction for hybrid diffusion imaging and computation of q‐space indices. NeuroImage 2013;64:650–670. [DOI] [PMC free article] [PubMed] [Google Scholar]
- 12. Özarslan E, Koay CG, Shepherd TM, Komlosh ME, İrfanoğlu MO, Pierpaoli C, Basser PJ. Mean apparent propagator (MAP) MRI: a novel diffusion imaging method for mapping tissue microstructure. NeuroImage 2013;78:16–32. [DOI] [PMC free article] [PubMed] [Google Scholar]
- 13. Özarslan E, Koay CG, Basser PJ. Simple Harmonic Oscillator Based Estimation and Reconstruction for One‐Dimensional q‐Space MR. In Proceedings of the 16th Annual Meeting of ISMRM, Toronto, Canada, 2008. p. 35.
- 14. Assaf Y, Basser PJ. Composite hindered and restricted model of diffusion (CHARMED) MR imaging of the human brain. Neuroimage 2005;27:48–58. [DOI] [PubMed] [Google Scholar]
- 15. Panagiotaki E, Schneider T, Siow B, Hall MG, Lythgoe MF, Alexander DC. Compartment models of the diffusion MR signal in brain white matter: a taxonomy and comparison. NeuroImage 2012;59:2241–2254. [DOI] [PubMed] [Google Scholar]
- 16. Assaf Y, Blumenfeld‐Katzir T, Yovel Y, Basser PJ. AxCaliber: a method for measuring axon diameter distribution from diffusion MRI. Magn Reson Med 2008;59:1347–1354. [DOI] [PMC free article] [PubMed] [Google Scholar]
- 17. Zhang H, Schneider T, Wheeler‐Kingshott CA, Alexander DC. NODDI: practical in vivo neurite orientation dispersion and density imaging of the human brain. NeuroImage 2012;61:1000–1016. [DOI] [PubMed] [Google Scholar]
- 18. Jelescu IO, Veraart J, Adisetiyo V, Milla SS, Novikov DS, Fieremans E. One diffusion acquisition and different white matter models: how does microstructure change in human early development based on WMTI and NODDI? NeuroImage 2015;107:242–256. [DOI] [PMC free article] [PubMed] [Google Scholar]
- 19. Kunz N, Zhang H, Vasung L, O’Brien KR, Assaf Y, Lazeyras F, Alexander DC, Hüppi PS. Assessing white matter microstructure of the newborn with multi‐shell diffusion MRI and biophysical compartment models. NeuroImage 2014;96:288–299. [DOI] [PubMed] [Google Scholar]
- 20. Kodiweera C, Alexander AL, Harezlak J, McAllister TW, Wu Y‐CC. Age effects and sex differences in human brain white matter of young to middle‐aged adults: A DTI, NODDI, and q‐space study. NeuroImage 2016;128:180–192. [DOI] [PMC free article] [PubMed] [Google Scholar]
- 21. Hutchinson EB, Avram A, Komlosh M, Okan Irfanoglu M, Barnett A, Ozarslan E, Schwerin S, Radomski K, Juliano S, Pierpaoli C. A Systematic Comparative Study of DTI and Higher Order Diffusion Models in Brain Fixed Tissue. In Proceedings of the 24th Annual Meeting of ISMRM, Singapore, 2016. Abstract 1048.
- 22. Pierpaoli C, Barnett A, Basser P, Chang L, Koay C, Pajevic S, Rohde G, Sarlls J, Wu M. TORTOISE: an integrated software package for processing of diffusion MRI data. In Proceedings of the 18th Annual Meeting of ISMRM, Stockholm, Sweden, 2010. Abstract 1597.
- 23. Johnson GA, Badea A, Brandenburg J, Cofer G, Fubara B, Liu S, Nissanov J. Waxholm space: an image‐based reference for coordinating mouse brain research. NeuroImage 2010;53:365–372. [DOI] [PMC free article] [PubMed] [Google Scholar]
- 24. Veraart J, Novikov DS, Christiaens D, Ades‐aron B, Sijbers J, Fieremans E. Denoising of diffusion MRI using random matrix theory. NeuroImage 2016;142:394–406. [DOI] [PMC free article] [PubMed] [Google Scholar]
- 25. Chang L‐CC, Walker L, Pierpaoli C. Informed RESTORE: a method for robust estimation of diffusion tensor from low redundancy datasets in the presence of physiological noise artifacts. Magn Reson Med 2012;68:1654–1663. [DOI] [PMC free article] [PubMed] [Google Scholar]
- 26. Koay CG, Ozarslan E, Basser PJ. A signal transformational framework for breaking the noise floor and its applications in MRI. J Magn Reson 2009;197:108–119. [DOI] [PMC free article] [PubMed] [Google Scholar]
- 27. Pierpaoli C, Basser PJ. Toward a quantitative assessment of diffusion anisotropy. Magn Reson Med 1996;36:893–906. [DOI] [PubMed] [Google Scholar]
- 28. Glenn GR, Helpern JA, Tabesh A, Jensen JH. Quantitative assessment of diffusional kurtosis anisotropy. NMR Biomed 2015;28:448–459. [DOI] [PMC free article] [PubMed] [Google Scholar]
- 29. Avram AV, Sarlls JE, Barnett AS, Özarslan E, Thomas C, Irfanoglu MO, Hutchinson E, Pierpaoli C, Basser PJ. Clinical feasibility of using mean apparent propagator (MAP) MRI to characterize brain tissue microstructure. NeuroImage 2016;127:422–434. [DOI] [PMC free article] [PubMed] [Google Scholar]
- 30. Zhang H, Hubbard PL, Parker GJ, Alexander DC. Axon diameter mapping in the presence of orientation dispersion with diffusion MRI. NeuroImage 2011;56:1301–1315. [DOI] [PubMed] [Google Scholar]
- 31. Veraart J, Poot DH, Van Hecke W, Blockx I, Van der Linden A, Verhoye M, Sijbers J. More accurate estimation of diffusion tensor parameters using diffusion Kurtosis imaging. Magn Reson Med 2011;65:138–145. [DOI] [PubMed] [Google Scholar]
- 32. Anderson AW. Theoretical analysis of the effects of noise on diffusion tensor imaging. Magn Reson Med 2001;46:1174–1188. [DOI] [PubMed] [Google Scholar]
- 33. Basser PJ, Pajevic S. Statistical artifacts in diffusion tensor MRI (DT‐MRI) caused by background noise. Magn Reson Med 2000;44:41–50. [DOI] [PubMed] [Google Scholar]
- 34. Jones DK, Basser PJ. “Squashing peanuts and smashing pumpkins”: how noise distorts diffusion‐weighted MR data. Magn Reson Med 2004;52:979–993. [DOI] [PubMed] [Google Scholar]
- 35. Alexander DC. A general framework for experiment design in diffusion MRI and its application in measuring direct tissue‐microstructure features. Magn Reson Med 2008;60:439–448. [DOI] [PubMed] [Google Scholar]
- 36. Alexander DC, Hubbard PL, Hall MG, Moore EA, Ptito M, Parker GJ, Dyrby TB. Orientationally invariant indices of axon diameter and density from diffusion MRI. NeuroImage 2010;52:1374–1389. [DOI] [PubMed] [Google Scholar]
- 37. Glenn GR, Tabesh A, Jensen JH. A simple noise correction scheme for diffusional kurtosis imaging. Magn Reson Imaging 2015;33:124–133. [DOI] [PMC free article] [PubMed] [Google Scholar]
- 38. Jelescu IO, Veraart J, Fieremans E, Novikov DS. Degeneracy in model parameter estimation for multi‐compartmental diffusion in neuronal tissue. NMR Biomed 2016;29:33–47. [DOI] [PMC free article] [PubMed] [Google Scholar]
- 39. Koay CG, Chang L‐CC, Carew JD, Pierpaoli C, Basser PJ. A unifying theoretical and algorithmic framework for least squares methods of estimation in diffusion tensor imaging. J Magn Reson 2006;182:115–125. [DOI] [PubMed] [Google Scholar]
Associated Data
This section collects any data citations, data availability statements, or supplementary materials included in this article.
Supplementary Materials
Additional Supporting Information may be found in the online version of this article
Table S1. Values for the quantitative comparison of scalar metrics are provided including the relative error to compare the mean value of each metric obtained using six‐shell and eight‐shell sampling to the value obtained with five‐shell sampling where greater values indicate a greater histogram shift. The coefficient of variation is also given for each scalar metric obtained using different DWI sampling to describe the relative variability across datasets where greater values indicate grater variability. Only metrics for which histograms were unimodal are reported (i.e. NG, VIR, and VISO are excluded).
Fig. S2. Metric maps and histograms to probe water movement along the primary eigenvector (Dax, Kax, and rtpp) and perpendicular to it (Drad, Krad, and rtap). DTI, DKI, and MAP‐MRI models were fit using diffusion‐weighted data from three sampling schemes having 5, 6, and 8 shells and density histogram plots (right column) for each metric in 4 mouse brain samples show the distribution of metric values. Metric map abbreviations: Dax, axial diffusivity; Drad, radial diffusivity; Kax, axial kurtosis; Krad, radial kurtosis; rtap, return to the axis probability; rtpp, return to the plane probability.
Fig. S3. The effects of signal transformation and added noise are shown for metric maps for cylindrical components from the DTI, DKI, and MAP models. For each metric, whole brain histograms are shown for modeling of the original DWI dataset (black) and of the same dataset following noise floor subtraction (blue), addition of 20% or 50% rectified noise (orange and red respectively). To visualize the localization of metric differences resulting from noise manipulation, difference maps are shown for the same slice.
Fig. S4. Interstitial diffusivity (DIN) as a free parameter. The NODDI made was fit with DIN left as a free parameter and the scalar image (left) and histogram of values are shown in this figure. Notably, DIN spans a range of values and appears to demonstrate some dependence on tissue type.
Fig. S5. The effects of DWI sampling scheme on DTI metrics derived from the DKI model (MD‐DKI and FA‐DKI) or from the DTI model using the DKE implementation (MD‐DTI‐DKE and FA‐DTI‐DKE). The MD maps and histogram mode and shape are relatively stable across the full range of DWI sampling schemes when estimated from the DKI model, but demonstrate DWI sampling dependence when estimated from the DTI model alone.


