

Abstract
Aims
To evaluate the efficacy and safety of dulaglutide 1.5 and 0.75 mg in patients with type 2 diabetes by subgroups of gender, duration of diabetes and baseline glycated haemoglobin (HbA1c) in the dulaglutide clinical development programme (AWARD‐1 to ‐6 and ‐8 clinical trials).
Methods
Change in HbA1c was analysed by gender, duration of diabetes (<5, ≥5 years and <10, ≥10 years), and baseline HbA1c (<8.5%, ≥8.5%) in pooled and individual studies. Changes from baseline in weight, hypoglycaemia and gastrointestinal adverse events were evaluated for individual trials.
Results
In the pooled analysis of patients treated with dulaglutide 1.5 mg at 6 months, the reductions in HbA1c from baseline were similar across gender (men: least squares [LS] mean −1.26% [95% confidence interval {CI} −1.36, −1.16]; women: LS mean −1.33% [95% CI −1.43, −1.24]) and among duration of diabetes subgroups (<5 years: LS mean −1.32% [95% CI −1.43, −1.22]; ≥5 and <10 years: LS mean −1.33% [95% CI −1.43, −1.22]; ≥10 years: −1.24% [95% CI −1.35, −1.14]). Patients with baseline HbA1c ≥8.5% had greater HbA1c reductions than patients with baseline HbA1c <8.5%, (≥8.5%: LS mean −1.86% [95% CI −1.97, −1.75]; <8.5%: LS mean −1.02% [95% CI −1.12, −0.93]). Reductions in fasting blood glucose (FBG) were consistent with HbA1c changes. Similar results were observed with dulaglutide 0.75 mg. In general, body weight changes were similar among duration of diabetes and in baseline HbA1c subgroups, respectively; women had a numerically greater weight loss or less weight gain than men with both dulaglutide doses. There was no clinically meaningful difference in hypoglycaemia trends by gender or duration of diabetes. Hypoglycaemia incidence and rate were generally lower in patients with baseline HbA1c ≥8.5% than in those with <8.5%, except for the AWARD‐4 study (combination with mealtime insulin).
Conclusions
Across the AWARD studies, dulaglutide demonstrated significant improvements in glycaemic control irrespective of gender, duration of diabetes, or baseline HbA1c, with greater HbA1c and FBG reductions in patients with a higher baseline HbA1c. Dulaglutide was well tolerated, with a safety profile similar to other glucagon‐like peptide‐1 receptor agonists.
Keywords: dulaglutide , GLP‐1 , GLP‐1 analogue , type 2 diabetes
1. INTRODUCTION
Type 2 diabetes (T2D) is a progressive disease with complex aetiology and pathophysiology. Patients are diagnosed and managed in different stages of the illness. Moreover, given the progressive nature of T2D and despite treatment, glycaemic control tends to deteriorate over time, making it necessary to advance to more complex medication regimens. Patient characteristics may interfere with the effectiveness of some anti‐hyperglycaemic medications.1 It is important to know to what extent patients may benefit from a particular therapy, depending on the stage of the disease such as duration of diabetes, baseline glycated haemoglobin (HbA1c) and individual characteristics such as gender. Data obtained on treatment effects in patients with T2D according to different demographic profiles and baseline characteristics are of value for the development of personalized therapies.
Dulaglutide, a once‐weekly glucagon‐like peptide‐1 (GLP‐1) receptor agonist, is approved in the USA, the European Union and other countries to treat hyperglycaemia in adult patients with T2D. The efficacy and safety of once‐weekly dulaglutide 1.5 and 0.75 mg were investigated across the diabetes treatment continuum in the Assessment of Weekly AdministRation of LY2189265 in Diabetes (AWARD) trials. In these studies, dulaglutide was used as monotherapy, combination therapy with one or two oral antihyperglycaemic medications, or with mealtime insulin lispro.2, 3, 4, 5, 6, 7, 8, 9 At the primary endpoint, dulaglutide 1.5 mg achieved significantly greater reductions in HbA1c compared with metformin,2 sitagliptin,3 placebo,3, 5, 8 exenatide twice daily,5 and insulin glargine,6, 7 and achieved similar reduction compared with liraglutide 1.8 mg/d.4 Dulaglutide 0.75 mg achieved significantly greater reductions in HbA1c vs metformin,2 sitagliptin,3 exenatide twice daily,5 and insulin glargine in combination with insulin lispro with or without metformin,7 and similar reductions compared with insulin glargine added to metformin and glimepiride6; however, the effects of dulaglutide on patients with different demographic profiles and baseline characteristics including gender, duration of diabetes, and baseline HbA1c in these trials have not yet been reported.
The aim of the present post hoc analyses was to evaluate the efficacy and safety of once‐weekly dulaglutide in patients with T2D who participated in the dulaglutide phase III studies, stratified into subgroups based on gender, duration of diabetes (<5, ≥5 years and <10, ≥10 years), and baseline HbA1c (<8.5%, ≥8.5%).
2. RESEARCH DESIGN AND METHODS
2.1. Design of clinical trial programme
The 7 AWARD clinical trials (AWARD‐1 to ‐6 and ‐8) included in the present analyses were randomized controlled clinical studies ranging from 24 to 104 weeks' duration, with a total of 5470 patients. They were designed to evaluate the safety and efficacy of dulaglutide in adult patients with T2D, with primary endpoints at 6 or 12 months, depending on the individual study. The primary objective of the trials was to assess dulaglutide vs placebo and/or active comparators for HbA1c change from baseline. Detailed methods of the individual trials have been previously published.2, 3, 4, 5, 6, 7, 8
2.2. Statistical analyses
The efficacy and safety of dulaglutide 1.5 mg and dulaglutide 0.75 mg in patients were further evaluated by subgroups of gender, duration of diabetes (<5, ≥5 years and <10, and ≥10 years), and baseline HbA1c (<8.5% and ≥8.5%). The analyses were performed on the intention‐to‐treat population (randomized patients who received at least 1 dose of study medication). All efficacy analyses of changes from baseline in HbA1c and fasting blood glucose (FBG) were conducted on pooled studies at 6 months, as this was a common efficacy time point for all 7 AWARD studies. Additional analyses were conducted at 12 months for the 5 studies that had this time point in common (except AWARD‐6 and ‐8). In addition, change in HbA1c was also analysed by individual study. As a result of different background therapies interacting with body weight and potential confounders of safety measures, weight change from baseline and the safety measures were analysed by individual study. Weight change was analysed at 6 months. The incidence of all hypoglycaemia (total hypoglycaemia, plasma glucose ≤3.9 mmol/L [70 mg/dL]) and severe hypoglycaemia (defined as requiring assistance) episodes,10 and gastrointestinal adverse events focusing on nausea, vomiting and diarrhoea were summarized at final endpoints. The analyses of pooled data for changes in HbA1c and change in FBG were conducted using analysis of covariance (ANCOVA), with model terms baseline value, study, country, treatment, baseline characteristic groups (gender, duration of diabetes), and baseline characteristic groups by treatment interaction. The analyses of change in HbA1c and weight for individual studies were conducted using ANCOVA, including study‐specific stratification factors, treatment, baseline characteristic groups (gender, duration of diabetes), baseline characteristic groups by treatment interaction and baseline value as covariates. Similar models were used when the baseline characteristic group was HbA1c; however, because of the high correlation between baseline value and HbA1c subgroup category, baseline value was not included as a covariate in the analyses of change in HbA1c or FBG. Least squares (LS) means and corresponding 95% confidence intervals (CIs) are presented. Changes were considered statistically significant when the 95% CI did not include 0. The last observation was carried forward for missing data. Analyses of changes from baseline in HbA1c using a mixed model for repeated measures (MMRM) at 6 and 12 months were also conducted as sensitivity analyses.
3. RESULTS
In the present analyses of 7 phase III studies (Table S1, Supporting Information), a total of 5470 patients with T2D were included: 1958 (dulaglutide 1.5 mg), 1417 (dulaglutide 0.75 mg), 1717 (active comparators), and 378 (placebo). Patient numbers for gender, duration of diabetes, and baseline HbA1c subgroups for individual studies are listed in Table S2, Supporting Information. In general, the distribution for gender, duration of diabetes, and HbA1c at baseline was similar in both dulaglutide 1.5 mg and 0.75 mg treatment arms (Table 1). Patients with longer duration of diabetes tended to be older, had numerically higher baseline HbA1c and FBG values, and were under more intensive antihyperglycaemic treatment. Patients with greater baseline HbA1c tended to have longer duration of diabetes and higher baseline FBG values.
Table 1.
Demographic and baseline characteristics of pooled analysis
| Gender | Duration of diabetes (years) | Baseline HbA1c (%) | ||||||||||||
|---|---|---|---|---|---|---|---|---|---|---|---|---|---|---|
| DU 1.5 mg | DU 0.75 mg | DU 1.5 mg | DU 0.75 mg | DU 1.5 mg | DU 0.75 mg | |||||||||
| Male | Female | Male | Female | <5 | 5 to 10 | ≥10 | <5 | 5 to 10 | ≥10 | <8.5 | ≥8.5 | <8.5 | ≥8.5 | |
| Patient number | 969 | 989 | 704 | 713 | 724 | 601 | 633 | 528 | 370 | 519 | 1289 | 666 | 963 | 452 |
| Female, n (%) | 0 | 989 (100) | 0 | 713 (100) | 386 (53.3) | 300 (49.9) | 303 (47.9) | 288 (54.5) | 183 (49.5) | 242 (46.6) | 650 (50.4) | 337 (50.6) | 498 (51.7) | 214 (47.3) |
| Age, years | 56.8 (9.8) | 55.9 (10.1) | 56.9 (9.7) | 55.8 (9.8) | 53.1 (10.0) | 56.4 (9.5) | 60.1 (9.0) | 53.5 (10.4) | 55.4 (8.9) | 60.0 (8.5) | 56.6 (10.0) | 55.9 (9.9) | 56.4 (10.0) | 56.2 (9.3) |
| Weight, kg | 96.1 (18.4) | 84.3 (16.8) | 96.0 (19.3) | 84.5 (16.9) | 92.7 (19.2) | 89.6 (18.1) | 87.6 (18.0) | 92.0 (19.8) | 89.3 (18.3) | 89.2 (18.7) | 90.2 (18.2) | 89.9 (19.3) | 90.2 (19.1) | 90.5 (18.8) |
| BMI, kg/m2 | 31.6 (4.9) | 32.9 (5.5) | 31.7 (5.0) | 33.0 (5.5) | 33.3 (5.5) | 32.1 (5.1) | 31.3 (5.0) | 33.0 (5.6) | 31.9 (4.9) | 32.0 (5.3) | 32.4 (5.2) | 32.0 (5.3) | 32.4 (5.4) | 32.3 (5.2) |
| HbA1c, % | 8.1 (1.0) | 8.1 (1.0) | 8.1 (1.1) | 8.0 (1.1) | 7.9 (1.0) | 8.2 (1.0) | 8.4 (1.1) | 7.8 (1.1) | 8.1 (1.0) | 8.4 (1.1) | 7.5 (0.5) | 9.3 (0.8) | 7.5 (0.6) | 9.4 (0.8) |
| FBG, mg/dL | 168.9 (51.5) | 164.6 (52.5) | 165.0 (51.6) | 157.7 (48.8) | 160.7 (49.5) | 167.9 (50.4) | 172.4 (55.6) | 158.2 (50.0) | 162.5 (50.0) | 163.6 (50.7) | 149.4 (37.9) | 200.2 (59.0) | 144.8 (36.1) | 196.2 (57.7) |
| mmol/L | 9.4 (2.9) | 9.1 (2.9) | 9.2 (2.9) | 8.8 (2.7) | 8.9 (2.8) | 9.3 (2.8) | 9.6 (3.1) | 8.8 (2.8) | 9.0 (2.8) | 9.1 (2.8) | 8.3 (2.1) | 11.1 (3.3) | 8.0 (2.0) | 10.9 (3.2) |
| Duration of diabetes, years | 8.2 (6.2) | 7.7 (6.2) | 8.6 (6.4) | 7.7 (6.0) | 2.5 (1.3) | 6.9 (1.5) | 15.1 (5.4) | 2.6 (1.2) | 6.9 (1.4) | 14.7 (5.2) | 7.4 (6.2) | 9.0 (6.1) | 7.5 (6.0) | 9.6 (6.4) |
| Prior OAM use, n (%) | ||||||||||||||
| No OAM | 135 (13.9) | 176 (17.8) | 128 (18.2) | 175 (24.5) | 206 (28.5) | 66 (11.0) | 39 (6.2) | 187 (35.4) | 66 (17.8) | 50 (9.6) | 242 (18.8) | 68 (10.2) | 239 (24.8) | 64 (14.2) |
| 1 OAM | 423 (43.7) | 476 (48.1) | 178 (25.3) | 200 (28.1) | 388 (53.6) | 302 (50.2) | 209 (33.0) | 217 (41.1) | 87 (23.5) | 74 (14.3) | 601 (46.6) | 298 (44.7) | 275 (28.6) | 103 (22.8) |
| >1 OAM | 251 (25.9) | 202 (20.4) | 250 (35.5) | 193 (27.1) | 101 (14.0) | 158 (26.3) | 194 (30.6) | 91 (17.2) | 151 (40.8) | 201 (38.7) | 290 (22.5) | 163 (24.5) | 284 (29.5) | 159 (35.2) |
| Insulin + OAM(s) | 160 (16.5) | 135 (13.7) | 148 (21.0) | 145 (20.3) | 29 (4.0) | 75 (12.5) | 191 (30.2) | 33 (6.3) | 66 (17.8) | 194 (37.4) | 156 (12.1) | 137 (20.6) | 165 (17.1) | 126 (27.9) |
Abbreviations: BMI, body mass index; DU, dulaglutide; FBG, fasting blood glucose; HbAlc, glycated haemoglobin A1c; OAM, oral anti‐diabetic medication.
All data are presented as mean (standard deviation) unless otherwise indicated. No formal statistical test on baseline differences was conducted.
3.1. HbA1c, FBG reductions and weight changes
3.1.1. HbA1c, FBG reductions and weight changes by gender
At 6 months (Figure 1A), patients who received dulaglutide 1.5 and 0.75 mg experienced significant reductions in HbA1c, and the gender subgroups were similar (ANCOVA with LOCF analysis): LS means: −1.26% (95% CI −1.36, −1.16) for men and −1.33% (95% CI −1.43, −1.24) for women receiving dulaglutide 1.5 mg; and −1.09% (95% CI −1.19, −0.98) for men and −1.16% (95% CI −1.26, −1.06) for women receiving dulaglutide 0.75 mg. Significant reductions in HbA1c for both treatments in men and women (Figure 1B) were also observed at 12 months, and the LS mean reductions were similar: dulaglutide 1.5 mg, men: −1.21% (95% CI −1.32, −1.11), women: −1.28% (95% CI −1.38, −1.17); dulaglutide 0.75 mg, men: −1.01% (95% CI −1.13, −0.90), women: −1.04% (95% CI −1.15, −0.92). MMRM pooled analysis at 6 and 12 months also showed similar HbA1c reductions in men and women for both dulaglutide doses, confirming the ANCOVA analysis (data not shown). ANCOVA analyses of HbA1c reductions from baseline in individual studies, in general, showed similar reductions in men and women at 6 months for both dulaglutide doses (Table S3, Supporting Information).
Figure 1.
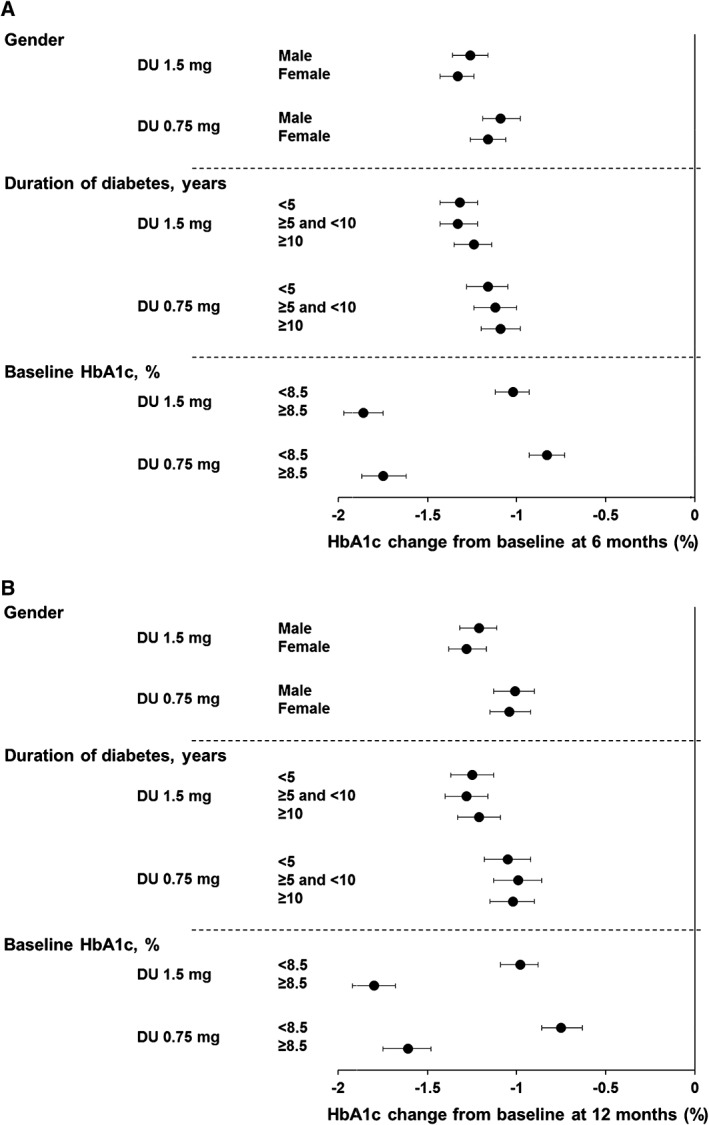
Change in HbA1c from baseline at A, 6 months and B, 12 months. Data are LS means (95% CI), intention‐to‐treat, LOCF ANCOVA analysis. DU, dulaglutide
In line with changes in HbA1c, the FBG reductions were also similar in men and women for both dulaglutide 1.5 and 0.75 mg treatments at 6 and 12 months (Figure 2A,B and Table S4, Supporting Information).
Figure 2.
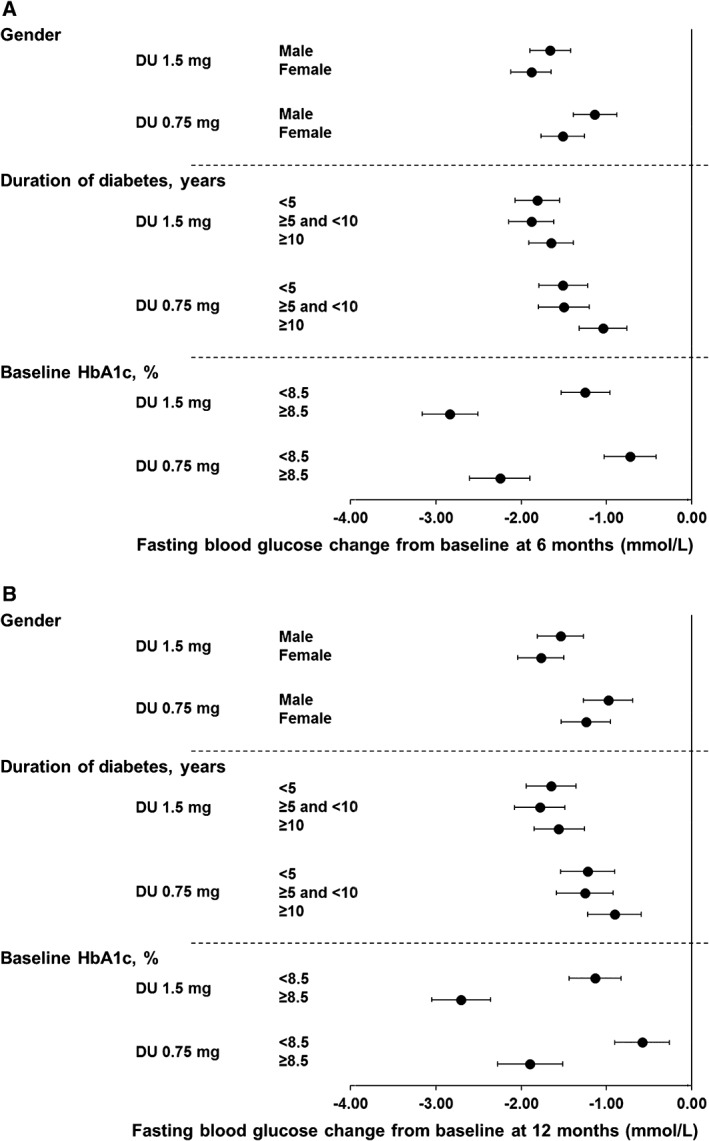
Change of FBG from baseline at A, 6 months and B, 12 months. Data are LS means (95% CI), intention‐to‐treat, LOCF ANCOVA analysis. DU, dulaglutide
In general, women had a numerically somewhat greater weight loss, or less weight gain, than men with both dulaglutide doses in all studies except for the dulaglutide 0.75 mg group in the AWARD‐1 study (Table 2).
Table 2.
Adjusted (LS) mean weight change from baseline at 6 months of individual studies
| Gender | Duration of diabetes | Baseline HbA1c | |||||
|---|---|---|---|---|---|---|---|
| Weight (kg) | Men | Women | <5 years | 5‐10 years | ≥10 years | <8.5% | ≥8.5% |
| AWARD‐3 | |||||||
| DU 1.5 mg | −1.77 (−2.44, −1.11) | −2.71 (−3.31, −2.11) | −1.84 (−2.41, −1.28) | −2.15 (−4.00, −0.29) | ‐ | −2.36 (−2.87, −1.84) | −1.97 (−2.95, −0.99) |
| DU 0.75 mg | −0.91 (−1.56, −0.26) | −1.75 (−2.35, −1.16) | −0.88 (−1.43, −0.32) | −2.05 (−4.28, 0.19) | −1.77 (−5.65, 2.10) | −1.37 (−1.88, −0.86) | −1.29 (−2.27, −0.30) |
| Metformin | −1.90 (−2.56, −1.24) | −2.53 (−3.12, −1.93) | −1.82 (−2.37, −1.27) | −1.47 (−3.04, 0.09) | −3.98 (−10.8, 2.87) | −2.38 (−2.89, −1.86) | −1.56 (−2.52, −0.60) |
| AWARD‐8 | |||||||
| DU 1.5 mg | −0.24 (−0.91, 0.43) | −0.75 (−1.35, −0.16) | −0.46 (−1.22, 0.30) | −0.56 (−1.25, 0.12) | −0.64 (−1.38, 0.11) | −0.62 (−1.20, −0.03) | −0.49 (−1.15, 0.18) |
| Placebo | 0.54 (−0.58, 1.65) | −0.39 (−1.39, 0.61) | 0.47 (−0.84, 1.78) | −0.09 (−1.21, 1.03) | −0.39 (−1.93, 1.15) | 0.18 (−0.86, 1.21) | −0.20 (−1.26, 0.86) |
| AWARD‐5 | |||||||
| DU 1.5 mg | −2.56 (−3.07, −2.06) | −3.77 (−4.26, −3.27) | −3.03 (−3.59, −2.48) | −3.12 (−3.72, −2.51) | −3.49 (−4.19, −2.80) | −3.19 (−3.62, −2.76) | −3.17 (−3.79, −2.56) |
| DU 0.75 mg | −1.97 (−2.51, −1.44) | −3.20 (−3.69, −2.71) | −2.81 (−3.42, −2.21) | −2.53 (−3.13, −1.92) | −2.52 (−3.17, −1.87) | −2.72 (−3.16, −2.28) | −2.44 (−3.07, −1.82) |
| Sitagliptin | −1.15 (−1.65, −0.65) | −1.78 (−2.26, −1.29) | −1.53 (−2.10, −0.96) | −1.05 (−1.60, −0.50) | −2.05 (−2.77, −1.33) | −1.46 (−1.88, −1.03) | −1.40 (−2.01, −0.79) |
| Placebo | −1.31 (−1.95, −0.67) | −1.67 (−2.32, −1.01) | −1.67 (−2.39, −0.95) | −1.35 (−2.09, −0.61) | −1.23 (−2.19, −0.27) | −1.29 (−1.85, −0.73) | −1.87 (−2.68, −1.06) |
| AWARD‐6 | |||||||
| DU 1.5 mg | −2.35 (−2.95, −1.74) | −3.28 (−3.84, −2.72) | −2.48 (−3.16, −1.80) | −3.00 (−3.64, −2.35) | −3.26 (−4.09, −2.42) | −3.09 (−3.57, −2.61) | −2.82 (−3.54, −2.09) |
| Liraglutide | −2.91 (−3.49, −2.32) | −4.21 (−4.78, −3.64) | −3.42 (−4.09, −2.76) | −3.51 (−4.24, −2.79) | −3.90 (−4.64, −3.16) | −4.07 (−4.56, −3.58) | −2.95 (−3.65, −2.25) |
| AWARD‐1 | |||||||
| DU 1.5 mg | −0.92 (−1.62, −0.22) | −1.87 (−2.66, −1.08) | −0.78 (−1.75, 0.19) | −1.69 (−2.57, −0.82) | −1.37 (−2.16, −0.57) | −1.41 (−2.05, −0.77) | −1.08 (−1.96, −0.19) |
| DU 0.75 mg | 0.15 (−0.53, 0.84) | 0.25 (−0.57, 1.06) | −0.50 (−1.52, 0.52) | 0.53 (−0.31, 1.38) | 0.20 (−0.60, 0.99) | 0.07 (−0.57, 0.71) | 0.50 (−0.38, 1.37) |
| Exenatide twice daily | −1.23 (−1.94, −0.52) | −0.89 (−1.67, −0.11) | −1.08 (−2.09, −0.08) | −0.62 (−1.46, 0.23) | −1.57 (−2.37, −0.77) | −1.01 (−1.64, −0.38) | −1.19 (−2.10, −0.29) |
| Placebo | 0.95 (0.05, 1.85) | 1.64 (0.57, 2.71) | 0.85 (−0.39, 2.09) | 1.35 (0.16, 2.55) | 1.21 (0.12, 2.29) | 1.84 (0.98, 2.70) | 0.12 (−1.01, 1.25) |
| AWARD‐2 | |||||||
| DU 1.5 mg | −1.39 (−1.91, −0.87) | −2.23 (−2.77, −1.69) | −2.08 (−2.84, −1.33) | −1.56 (−2.17, −0.96) | −1.75 (−2.34, −1.16) | −1.86 (−2.33, −1.39) | −1.74 (−2.34, −1.14) |
| DU 0.75 mg | −1.14 (−1.67, −0.61) | −1.71 (−2.24, −1.18) | −0.80 (−1.57, −0.03) | −1.64 (−2.28, −1.01) | −1.57 (−2.13, −1.01) | −1.36 (−1.82, −0.89) | −1.70 (−2.32, −1.09) |
| Insulin glargine | 1.30 (0.77, 1.84) | 0.81 (0.26, 1.35) | 0.94 (0.16, 1.71) | 1.16 (0.56, 1.77) | 1.09 (0.47, 1.72) | 0.66 (0.18, 1.14) | 1.64 (1.02, 2.26) |
| AWARD‐4 | |||||||
| DU 1.5 mg | −0.33 (−0.98, 0.33) | −1.63 (−2.37, −0.88) | −1.64 (−3.04,–0.24) | 0.31 (−0.57, 1.19) | −0.96 (−1.55, −0.38) | −1.71 (−2.39, −1.04) | 0.06 (−0.64, 0.76) |
| DU 0.75 mg | 0.61 (−0.07, 1.28) | −0.33 (−1.04, 0.37) | 0.21 (−1.09, 1.51) | 0.08 (−0.84, 1.00) | 0.54 (−0.04, 1.13) | −0.46 (−1.10, 0.19) | 0.95 (0.24, 1.67) |
| Insulin glargine | 2.34 (1.69, 3.00) | 2.20 (1.47, 2.93) | 1.98 (0.58, 3.38) | 2.19 (1.25, 3.12) | 2.66 (2.09, 3.23) | 1.70 (1.03, 2.38) | 2.96 (2.28, 3.63) |
Abbreviations: DU, dulaglutide. ‐, no patients in the subgroup.
All data are presented as LS means (95% CI), LOCF ANCOVA analysis. No formal statistical test on subgroup differences was conducted.
3.1.2. HbA1c, FBG reductions and weight changes by duration of diabetes
In the pooled analysis (Figure 1A), there were significant HbA1c reductions from baseline at 6 months in both the dulaglutide 1.5 mg and dulaglutide 0.75 mg arms among all duration of diabetes subgroups. The HbA1c reductions for each dulaglutide dose were similar among the duration of diabetes subgroups (ANCOVA with LOCF analysis): LS means: dulaglutide 1.5 mg, <5 years: −1.32% (95% CI −1.43, −1.22), ≥5 and <10 years: −1.33% (95% CI −1.43, −1.22), ≥10 years: −1.24% (95% CI −1.35, −1.14); dulaglutide 0.75 mg, <5 years: −1.16% (95% CI −1.28, −1.05), ≥5 and <10 years: −1.12% (95% CI −1.24, −1.00), ≥10 years: −1.09% (95% CI −1.20, −0.98). At 12 months, the HbA1c reductions (Figure 1B) were also similar in patients with different duration of diabetes: dulaglutide 1.5 mg, <5 years: −1.25% (95% CI −1.37, −1.13), ≥5 and <10 years: −1.28% (95% CI −1.40, −1.16), ≥10 years: −1.21% (95% CI −1.33, −1.09); dulaglutide 0.75 mg, <5 years: −1.05% (95% CI −1.18, −0.92), ≥5 and <10 years: −0.99% (95% CI −1.13, −0.86), ≥10 years: −1.02% (95% CI −1.15, −0.90). MMRM pooled analysis at 6 and 12 months showed similar HbA1c reductions among duration of diabetes subgroups, consistent with using ANCOVA analysis (data not shown). ANCOVA analyses of HbA1c reductions from baseline in individual studies also demonstrated similar results among duration of diabetes subgroups at 6 months for both dulaglutide doses (Table S3, Supporting Information).
The FBG reductions were similar among duration of diabetes subgroups for both dulaglutide 1.5 and 0.75 mg treatments at 6 and 12 months (Figure 2A and B, Table S4, Supporting Information).
Body weight changes were generally similar among duration of diabetes subgroups with both dulaglutide doses in all studies (Table 2).
3.1.3. HbA1c, FBG reductions and weight changes by baseline HbA1c
In the pooled analysis, at 6 months, in both HbA1c subgroups, dulaglutide 1.5 and 0.75 mg treatments resulted in significant HbA1c reductions with greater HbA1c reductions observed for patients with baseline HbA1c ≥8.5% than for patients with baseline HbA1c <8.5% (Figure 1A; ANCOVA with LOCF analysis): LS mean: dulaglutide 1.5 mg, <8.5%: −1.02% (95% CI −1.12, −0.93); ≥8.5%: −1.86% (95% CI −1.97, −1.75); dulaglutide 0.75 mg, <8.5%: −0.83% (95% CI −0.93, −0.73); ≥8.5%: −1.75% (95% CI −1.87, −1.62). At 12 months, the greater Hb1Ac reductions (Figure 1B) for patients with baseline HbA1c ≥8.5% were maintained: dulaglutide 1.5 mg, <8.5%: −0.98% (95% CI −1.09, −0.88); ≥8.5%: −1.80% (95% CI −1.92, −1.68); dulaglutide 0.75 mg, <8.5%: −0.75% (95% CI −0.86, −0.63); ≥8.5%: −1.61% (95% CI −1.75, −1.48). MMRM pooled analysis at 6 and 12 months also showed similar results to those observed with ANCOVA for HbA1c reductions in patients with baseline HbA1c <8.5% and ≥8.5%, respectively (data not shown). Results of HbA1c reductions from baseline in individual studies with ANCOVA analysis were also consistent with those observed in the pooled analysis at 6 months, with significant reductions seen in both dulaglutide doses but were generally greater for patients with baseline HbA1c ≥8.5% than patients with HbA1c <8.5% (Table S3, Supporting Information).
Consistent with HbA1c, the FBG reductions were greater in patients with baseline ≥8.5% than in patients with baseline HbA1c <8.5% for both dulaglutide 1.5 and 0.75 mg treatments at 6 and 12 months (Figure 2A,B and Table S4, Supporting Information).
Dulaglutide achieved a similar effect on weight in patients with baseline HbA1c ≥8.5% and those with <8.5%, except in AWARD‐4 in which dulaglutide in combination with mealtime insulin lispro resulted in weight reduction only in patients with baseline HbA1c <8.5% (Table 2).
3.2. Hypoglycaemia
Hypoglycaemia was analysed by study and not pooled because patients were on different concomitant therapies (non‐insulin secretagogues, insulin secretagogues and insulin). In general, the incidences of total hypoglycaemia with dulaglutide treatment were higher in the studies with insulin secretagogues or insulin as concomitant medications (AWARD‐2, ‐4, and ‐8) as compared with the other AWARD studies, and were consistent with that which has been observed in studies on other GLP‐1 receptor agonists (AWARD‐1 and ‐6; Table 3).
Table 3.
Total hypoglycaemia incidence and rate at final endpoints of individual studies
| Gender | Duration of diabetes | Baseline HbA1c | ||||||||||||
|---|---|---|---|---|---|---|---|---|---|---|---|---|---|---|
| Male | Female | <5 years | 5‐10 years | ≥10 years | <8.5% | ≥8.5% | ||||||||
| n (%) | Rate, events/patient‐/year | n (%) | Rate, events/patient‐/year | n (%) | Rate, events/patient‐/year | n (%) | Rate, events/patient‐/year | n (%) | Rate, events/patient‐/year | n (%) | Rate, events/patient‐/year | n (%) | Rate, events/patient‐/year | |
| AWARD‐3 | ||||||||||||||
| DU 1.5 mg | 16 (14.0) | 1.58 | 19 (12.3) | 0.43 | 32 (12.6) | 0.94 | 3 (20.0) | 0.41 | ‐ | ‐ | 33 (15.0) | 1.09 | 2 (4.1) | 0.12 |
| DU 0.75 mg | 13 (11.0) | 0.56 | 18 (11.8) | 0.40 | 28 (10.9) | 0.46 | 1 (11.1) | 0.23 | 2 (66.7) | 1.69 | 31 (14.0) | 0.57 | 0 (0.0) | 0.00 |
| Metformin | 15 (12.4) | 0.26 | 22 (15.0) | 0.34 | 34 (13.7) | 0.30 | 3 (15.8) | 0.41 | 0 (0.0) | 0.00 | 30 (13.9) | 0.28 | 7 (13.5) | 0.40 |
| AWARD‐8 | ||||||||||||||
| DU 1.5 mg | 22 (21.2) | 3.45 | 28 (20.7) | 1.46 | 16 (21.6) | 2.56 | 20 (22.5) | 1.57 | 14 (18.4) | 2.98 | 38 (28.6) | 3.53 | 12 (11.3) | 0.82 |
| Placebo | 1 (3.6) | 0.08 | 2 (6.3) | 0.14 | 2 (10.5) | 0.23 | 0 (0.0) | 0.00 | 1 (7.7) | 0.17 | 1 (3.3) | 0.07 | 2 (6.7) | 0.14 |
| AWARD‐5 | ||||||||||||||
| DU 1.5 mg | 18 (12.3) | 0.27 | 21 (13.3) | 0.26 | 16 (12.8) | 0.32 | 13 (12.9) | 0.14 | 10 (12.8) | 0.34 | 33 (16.1) | 0.29 | 6 (6.1) | 0.20 |
| DU 0.75 mg | 11 (8.2) | 0.08 | 15 (8.9) | 0.31 | 10 (9.3) | 0.13 | 8 (7.8) | 0.07 | 8 (8.7) | 0.45 | 20 (9.8) | 0.29 | 6 (6.2) | 0.04 |
| Sitagliptin | 14 (9.3) | 0.29 | 13 (7.9) | 0.11 | 8 (7.0) | 0.17 | 9 (7.0) | 0.06 | 10 (13.7) | 0.48 | 20 (9.3) | 0.13 | 7 (7.0) | 0.35 |
| AWARD‐6 | ||||||||||||||
| DU 1.5 mg | 13 (9.4) | 0.40 | 13 (8.1) | 0.28 | 8 (7.6) | 0.17 | 11 (8.9) | 0.37 | 7 (10.0) | 0.54 | 22 (10.5) | 0.38 | 4 (4.4) | 0.24 |
| Liraglutide | 7 (4.7) | 0.52 | 12 (7.9) | 0.64 | 6 (5.3) | 0.30 | 6 (6.3) | 0.68 | 7 (7.6) | 0.81 | 13 (6.3) | 0.65 | 6 (6.4) | 0.42 |
| AWARD‐1 | ||||||||||||||
| DU 1.5 mg | 19 (11.7) | 0.38 | 18 (15.5) | 0.45 | 11 (15.5) | 0.60 | 16 (16.8) | 0.51 | 10 (8.8) | 0.21 | 30 (15.7) | 0.54 | 7 (8.0) | 0.14 |
| DU 0.75 mg | 23 (13.7) | 0.79 | 24 (21.4) | 0.89 | 8 (12.5) | 0.36 | 20 (19.6) | 1.06 | 19 (16.7) | 0.89 | 41 (21.4) | 1.11 | 6 (6.8) | 0.23 |
| Exenatide twice daily | 27 (17.3) | 0.85 | 29 (24.2) | 1.61 | 10 (14.5) | 0.86 | 26 (27.1) | 1.46 | 20 (18.0) | 1.14 | 44 (22.9) | 1.54 | 12 (14.3) | 0.35 |
| AWARD‐2 | ||||||||||||||
| DU 1.5 mg | 88 (61.1) | 3.07 | 75 (58.1) | 5.28 | 31 (47.0) | 2.59 | 63 (61.8) | 3.87 | 69 (65.7) | 5.30 | 116 (66.3) | 4.89 | 47 (48.0) | 2.71 |
| DU 0.75 mg | 86 (63.2) | 3.83 | 74 (54.4) | 4.70 | 34 (52.3) | 4.00 | 51 (56.0) | 3.09 | 75 (64.7) | 5.33 | 117 (65.4) | 4.82 | 43 (46.2) | 3.19 |
| Insulin glargine | 95 (70.9) | 6.71 | 92 (71.9) | 7.05 | 37 (60.7) | 4.74 | 72 (72.7) | 8.15 | 78 (76.5) | 6.92 | 126 (74.6) | 7.24 | 61 (65.6) | 6.20 |
| AWARD‐4 | ||||||||||||||
| DU 1.5 mg | 138 (86.3) | 41.00 | 118 (87.4) | 41.59 | 25 (86.2) | 26.85 | 65 (86.7) | 38.23 | 166 (86.9) | 44.65 | 137 (87.8) | 40.53 | 118 (86.1) | 42.44 |
| DU 0.75 mg | 135 (91.2) | 44.55 | 130 (89.7) | 50.73 | 27 (81.8) | 21.41 | 62 (93.9) | 47.55 | 176 (90.7) | 52.09 | 149 (90.3) | 46.23 | 114 (90.5) | 49.07 |
| Insulin glargine | 148 (89.7) | 59.64 | 118 (90.1) | 51.39 | 23 (82.1) | 28.83 | 60 (87.0) | 54.79 | 183 (92.0) | 60.23 | 137 (91.9) | 60.44 | 125 (88.0) | 51.62 |
Abbreviation: DU, dulaglutide.
Hypoglycaemia is defined as plasma glucose ≤3.9 mmol/L (70 mg/dL). No formal statistical test on subgroup differences was conducted. ‐, no patients in the subgroup.
Overall, severe hypoglycaemia during dulaglutide treatment was low.9 Severe hypoglycaemia was infrequent, with a total of 20 episodes in patients treated with comparators (2 episodes in patients treated with exenatide twice daily in AWARD‐1, and 18 episodes in patients treated with insulin glargine in AWARD‐2 and ‐4), and 20 episodes in dulaglutide‐treated patients: 12 in the dulaglutide 1.5 mg group (10 in combination with mealtime insulin and 2 in combination with metformin and glimepiride) and 8 in the dulaglutide 0.75 mg group (all in combination with mealtime insulin).
Total hypoglycaemia incidence was similar in men and women and in patients with different duration of diabetes when treated with either of the dulaglutide doses during the period of drug exposure for each individual study (Table 3). The incidence of total hypoglycaemia was generally lower in patients with baseline HbA1c ≥8.5% than in those with baseline HbA1c <8.5% in the dulaglutide arms of all studies except for AWARD‐4, in which patients were treated in combination with mealtime insulin lispro. In AWARD‐4, the hypoglycaemia incidence was similar between baseline HbA1c subgroups with both dulaglutide doses (Table 3).
3.3. Gastrointestinal adverse events
Gastrointestinal adverse events, the most common treatment‐emergent adverse events, were mild to moderate and transient in nature with dulaglutide. The percentages of patients reporting gastrointestinal adverse events including nausea, vomiting, and diarrhoea in the individual studies according to gender, duration of diabetes, and baseline HbA1c are shown in Table S4, Supporting Information. In the present analysis, our data showed that women in general had numerically higher incidences of nausea and vomiting, and this was also observed with some of the comparators in the individual studies (metformin, liraglutide, exenatide twice daily, and insulin glargine). There was no observed trend for the differences in the incidence of gastrointestinal adverse events experienced by dulaglutide‐treated patients by duration of diabetes or baseline HbA1c.
4. DISCUSSION
In this post hoc analyses of patients from 7 phase III studies, significant reductions in HbA1c with dulaglutide 1.5 and 0.75 mg were achieved regardless of gender, duration of diabetes, or baseline HbA1c at both 6 and 12 months. The reductions in HbA1c were similar in men and women, in patients with different duration of diabetes, and greater in patients with baseline HbA1c ≥8.5% compared with patients with baseline HbA1c <8.5%. Similarly, the FBG reductions were consistent with HbA1c reductions in both dulaglutide doses at 6 and 12 months. All these results were consistent between pooled and individual study analyses.
The effect of dulaglutide on weight was analysed in individual studies rather than pooled to prevent the confounding effect on weight of the various concomitant background medications used in each study. At 6 months, dulaglutide showed similar effects on weight in most of the studies across duration of diabetes and baseline HbA1c subgroups except in AWARD‐4, in which dulaglutide in combination with mealtime insulin lispro demonstrated greater weight reduction in patients with baseline HbA1c <8.5% probably because of the lower dose increase of lispro in this group. Women treated with dulaglutide had a numerically greater weight loss, or less weight gain, compared with men in the majority of studies.
The significant improvements in glycaemic control observed in dulaglutide‐treated patients, irrespective of gender in this report, are consistent with results observed in the subgroup analyses of exenatide twice daily,11 exenatide once weekly,12 and lixisenatide.13 A study of liraglutide in a real clinical practice context also showed no differences in HbA1c reductions between women and men, consistent with our findings.14 Furthermore, no difference in HbA1c changes was also observed between men and women in dulaglutide‐treated Japanese patients.15 Dulaglutide‐treated women from these AWARD trials had a numerically greater weight loss or less weight gain compared with men, and this is consistent with results reported with exenatide twice daily or once weekly.11, 12 It has been hypothesized that the differences in response may be related to interaction with other hormones known to be different between sexes, such as leptin. Moreover, GLP‐1 receptor agonists appear to have an additive effect on the anorexogenic response to leptin.16 Thus, this mechanism of action could be hypothesized to account for the sex‐specific differences observed. In addition, subgroup analysis of dulaglutide treatment in Japanese patients also resulted in greater weight loss in women.15 Future investigations would be needed to clarify the observed differences in weight loss between men and women.
Dulaglutide treatment resulted in clinically meaningful reductions in HbA1c regardless of duration of diabetes in the present post hoc analysis. Similarly, HbA1c and weight changes did not differ by different duration of diabetes subgroups. These findings are consistent with the findings that duration of diabetes had no major clinically relevant effect on HbA1c reductions or weight changes in patients treated with other GLP‐1 receptor agonists, such as exenatide twice daily,11 exenatide once weekly,12 liraglutide,17 or albiglutide treatments.18 Blonde et al.13 reported recently that there was no evidence of smaller changes in HbA1c with longer duration of diabetes with lixisenatide.13 All these findings suggest that GLP‐1 receptor agonists may be effective in patients with advanced stages and long duration of diabetes. In addition, dulaglutide was shown to have significant HbA1c reduction regardless of β‐cell function at baseline.19
Our observation that poorly controlled patients with baseline HbA1c ≥8.5% had greater HbA1c reductions compared with patients with baseline HbA1c <8.5% is consistent with published data that patients with lower baseline HbA1c tend to experience smaller treatment‐induced changes in HbA1c than those with higher HbA1c at baseline.20, 21, 22 This was also reported for liraglutide by Henry et al.23 In that post hoc analysis of phase III, randomized controlled trials, patients with T2D were stratified by baseline HbA1c values into 5 categories (≤7.5%, >7.5% to 8.0%, >8.0% to 8.5%, >8.5% to 9.0%, and >9.0%), and reductions in HbA1c levels with liraglutide were generally greater in groups with higher baseline HbA1c. Similar findings were also reported for lixisenatide, with greater reductions in HbA1c in patients with higher baseline HbA1c levels, as shown in a pooled analysis of the lixisenatide GetGoal studies.13 Consistent with the present analysis, studies looking at baseline factors as predictors of outcomes in patients treated with GLP‐1 receptor agonists reported thus far indicated an association between baseline HbA1c and change in HbA1c, such that patients with higher baseline HbA1c usually experienced greater decreases in HbA1c.
Another important clinical characteristic hypothesized to interact with glycaemic control with dulaglutide is baseline body mass index (BMI); however, recent analyses found no influence of baseline BMI on HbA1c reductions in response to dulaglutide 0.75 and 1.5 mg in individual AWARD studies.24 Furthermore, weight changes were not dependent on baseline BMI either.25
Total hypoglycaemia incidence observed with dulaglutide was similar across gender and duration of diabetes subgroups. The incidence of total hypoglycaemia was generally lower in patients with baseline HbA1c ≥8.5% than in those with baseline HbA1c <8.5% in dulaglutide studies except AWARD‐4, in which the hypoglycaemia incidence was similar between baseline HbA1c subgroups with both dulaglutide doses. Concomitant mealtime insulin lispro in AWARD‐4 caused a higher level of hypoglycaemia which may have confounded the effect of baseline HbA1c on hypoglycaemia.
The incidence of gastrointestinal adverse events on dulaglutide treatment peaked at 2 weeks and rapidly declined over the next 4 weeks.2, 3, 4, 5, 6, 7, 8 In this post hoc analysis, no consistent differences were observed for the incidence of gastrointestinal adverse events in dulaglutide‐treated patient subgroups categorized by duration of diabetes or baseline HbA1c, consistent with the observation of no striking differences seen for exenatide once weekly categorized by duration of diabetes.12 Dulaglutide‐treated women experienced numerically higher incidences of nausea and vomiting, and this was also observed with some of the comparators in the individual studies (metformin, liraglutide, exenatide twice daily and insulin glargine), similarly to the results reported with exenatide once weekly.12 Interestingly, we also observed numerically greater weight reduction in women than men treated with dulaglutide in this post hoc analysis.
Limitations in these analyses restrict the application of these data to the larger population of patients with T2D. The analyses were post hoc, and no placebo or active comparator data were included in the pooled analyses. While the number of patients was large, they were selected according to protocol‐defined inclusion criteria and may not necessarily be representative of the entire T2D patient population in clinical practice. The mean duration of diabetes of ~8 years and the mean age of 56 years were typical for the clinical trials, but may differ from the wider T2D population. Similarly, concomitant glucose‐lowering medications in these studies may not fully represent the various combination treatments available in daily practice. Moreover, the durations of the studies in the present analysis were limited to 6 or 12 months, which may not reflect the effect of longer‐term use of dulaglutide.
In conclusion, treatment with dulaglutide resulted in clinically meaningful HbA1c and FBG reductions, irrespective of gender or duration of diabetes at baseline. The HbA1c reduction of dulaglutide was larger in those patients with higher baseline HbA1c. The effect of dulaglutide on weight is generally similar, irrespective of duration of diabetes and baseline HbA1c, but numerically greater in women. The overall safety profile is consistent with the GLP‐1 receptor agonist class.
ORCID
Luis‐Emilio Garcia‐Perez http://orcid.org/0000-0003-3840-787X
Supporting information
Table S1. AWARD clinical studies included in the analysis.
Table S2. Numbers of patients by baseline characteristics subgroups in individual studies.
Table S3. Adjusted (Least‐Square) Mean HbA1c change from baseline at 6 months of individual studies.
Table S4. Adjusted (Least‐Square) Mean FBG Change from baseline at 6 and 12 months of pooled studies.
Table S5. Gastrointestinal adverse events at final endpoints of individual studies.
ACKNOWLEDGMENTS
This work was sponsored by Eli Lilly and Company. We acknowledge Yixun Wu's and Ian Sturdy's assistance with statistical analyses.
Conflict of interest
F. G. is now carrying out clinical trials as co‐investigator for Eli Lilly and Sanofi, providing advisory services to Eli Lilly, Sanofi, Takeda, AstraZeneca, and Lifescan, and receiving grant support from Takeda, Eli Lilly, and Lifescan. B. G. has received honoraria for participating in advisory boards from: Amgen, AstraZeneca, Boehringer Ingelheim, Lilly, Merck, Novo Nordisk and has received honoraria for lectures from these companies as well as from Bristol Myers Squibb and Novartis. S. D.‐J. is principal Investigator/Co‐investigator for Clinical Trials Contracts to University of Tennessee, AstraZeneca, Novo Nordisk, Boehringer Ingelheim, and consultant/advisory board member of Amgen, Merck, Sanofi, AstraZeneca, Novo Nordisk, Boehringer Ingelheim, Janssen, Response Scientific, Inc. V. T., I. P., M. Y., N. Z. and L. E. G. P. are employees and stock holders of Eli Lilly and Company. K. E. R. is an employee of Eli Lilly and Company.
Gallwitz B, Dagogo‐Jack S, Thieu V, et al. Effect of once‐weekly dulaglutide on glycated haemoglobin (HbA1c) and fasting blood glucose in patient subpopulations by gender, duration of diabetes and baseline HbA1c . Diabetes Obes Metab. 2018;20:409–418. 10.1111/dom.13086
Funding information This work was sponsored by Eli Lilly and Company.
REFERENCES
- 1. Inzucchi SE, Bergenstal RM, Buse JB, et al. Management of hyperglycemia in type 2 diabetes, 2015: a patient‐centered approach: update to a position statement of the American Diabetes Association and the European Association for the Study of Diabetes. Diabetes Care. 2015;38:140–149. [DOI] [PubMed] [Google Scholar]
- 2. Umpierrez G, Tofe Povedano S, Perez Manghi F, Shurzinske L, Pechtner V. Efficacy and safety of dulaglutide monotherapy versus metformin in type 2 diabetes in a randomized controlled trial (AWARD‐3). Diabetes Care. 2014;37:2168–2176. [DOI] [PubMed] [Google Scholar]
- 3. Nauck M, Weinstock RS, Umpierrez GE, Guerci B, Skrivanek Z, Milicevic Z. Efficacy and safety of dulaglutide versus sitagliptin after 52 weeks in type 2 diabetes in a randomized controlled trial (AWARD‐5). Diabetes Care. 2014;37:2149–2158. [DOI] [PMC free article] [PubMed] [Google Scholar]
- 4. Dungan KM, Povedano ST, Forst T, et al. Once‐weekly dulaglutide versus once‐daily liraglutide in metformin‐treated patients with type 2 diabetes (AWARD‐6): a randomised, open‐label, phase 3, non‐inferiority trial. Lancet. 2014;384:1349–1357. [DOI] [PubMed] [Google Scholar]
- 5. Wysham C, Blevins T, Arakaki R, et al. Efficacy and safety of dulaglutide added onto pioglitazone and metformin versus exenatide in type 2 diabetes in a randomized controlled trial (AWARD‐1). Diabetes Care. 2014;37:2159–2167. [DOI] [PubMed] [Google Scholar]
- 6. Giorgino F, Benroubi M, Sun JH, Zimmermann AG, Pechtner V. Efficacy and safety of once‐weekly Dulaglutide versus insulin glargine in patients with type 2 diabetes on metformin and glimepiride (AWARD‐2). Diabetes Care. 2015;38(12):2241–2249. [DOI] [PubMed] [Google Scholar]
- 7. Blonde L, Jendle J, Gross J, et al. Once‐weekly dulaglutide versus bedtime insulin glargine, both in combination with prandial insulin lispro, in patients with type 2 diabetes (AWARD‐4): a randomised, open‐label, phase 3, non‐inferiority study. Lancet. 2015;385:2057–2066. [DOI] [PubMed] [Google Scholar]
- 8. Dungan KM, Weitgasser R, Perez Manghi F, et al. A 24‐week study to evaluate the efficacy and safety of once‐weekly dulaglutide added on to glimepiride in type 2 diabetes (AWARD‐8). Diabetes Obes Metab. 2016;18:475–482. [DOI] [PMC free article] [PubMed] [Google Scholar]
- 9. Anderson JE, Thieu VT, Boye KS, Hietpas RT, Garcia‐Perez LE. Dulaglutide in the treatment of adult type 2 diabetes: a perspective for primary care providers. Postgrad Med. 2016;128:810–821. [DOI] [PubMed] [Google Scholar]
- 10. Seaquist ER, Anderson J, Childs B, et al. Hypoglycemia and diabetes: a report of a workgroup of the American Diabetes Association and the Endocrine Society. Diabetes Care. 2013;36:1384–1395. [DOI] [PMC free article] [PubMed] [Google Scholar]
- 11. Pencek R, Blickensderfer A, Li Y, Brunell SC, Anderson PW. Exenatide twice daily: analysis of effectiveness and safety data stratified by age, sex, race, duration of diabetes, and body mass index. Postgrad Med. 2012;124:21–32. [DOI] [PubMed] [Google Scholar]
- 12. Pencek R, Blickensderfer A, Li Y, Brunell SC, Chen S. Exenatide once weekly for the treatment of type 2 diabetes: effectiveness and tolerability in patient subpopulations. Int J Clin Pract. 2012;66:1021–1032. [DOI] [PMC free article] [PubMed] [Google Scholar]
- 13. Blonde L, Chava P, Dex T, Lin J, Nikonova EV, Goldenberg RM. Predictors of outcomes in patients with type 2 diabetes in the lixisenatide GetGoal clinical trials. Diabetes Obes Metab. 2016;19(2):275–283. [DOI] [PMC free article] [PubMed] [Google Scholar]
- 14. Sastre J, Vicente A, Maqueda E, et al. Are there gender differences in liraglutide response in adults with type 2 diabetes? Endocrine Abstracts. 2013;32:P482. [Google Scholar]
- 15. Onishi Y, Oura T, Matsui A, Matsuura J, Iwamoto N. Analysis of efficacy and safety of dulaglutide 0.75 mg stratified by sex in patients with type 2 diabetes in 2 randomized, controlled phase 3 studies in Japan. Endocr J. 2017;64(5):553–560. [DOI] [PubMed] [Google Scholar]
- 16. Nathan BM, Rudser KD, Abuzzahab MJ, et al. Predictors of weight‐loss response with glucagon‐like peptide‐1 receptor agonist treatment among adolescents with severe obesity. Clin Obes. 2016;6:73–78. [DOI] [PMC free article] [PubMed] [Google Scholar]
- 17. Seufert J, Bailey T, Barkholt Christensen S, Nauck MA. Impact of diabetes duration on achieved reductions in glycated haemoglobin, fasting plasma glucose and body weight with liraglutide treatment for up to 28 weeks: a meta‐analysis of seven phase III trials. Diabetes Obes Metab. 2016;18:721–724. [DOI] [PMC free article] [PubMed] [Google Scholar]
- 18. Home P, Miller D, Carr MC. Albiglutide provides effective glycaemic lowering across diabetes duration subgroups. Diabetologia. 2015;58:S378. [Google Scholar]
- 19. Mathieu C, Botros FT, Thieu V, Jia N, Zhang N, Garcia‐Perez L. Effect of once weekly dulaglutide by baseline β‐cell function in the AWARD program. Diabetes. 2016;65:A269. [DOI] [PMC free article] [PubMed] [Google Scholar]
- 20. Bloomgarden ZT, Dodis R, Viscoli CM, Holmboe ES, Inzucchi SE. Lower baseline glycemia reduces apparent oral agent glucose‐lowering efficacy: a meta‐regression analysis. Diabetes Care. 2006;29:2137–2139. [DOI] [PubMed] [Google Scholar]
- 21. Phatak HM, Yin DD. Factors associated with the effect‐size of thiazolidinedione (TZD) therapy on HbA(1c): a meta‐analysis of published randomized clinical trials. Curr Med Res Opin. 2006;22:2267–2278. [DOI] [PubMed] [Google Scholar]
- 22. Chapell R, Gould AL, Alexander CM. Baseline differences in A1C explain apparent differences in efficacy of sitagliptin, rosiglitazone and pioglitazone. Diabetes Obes Metab. 2009;11:1009–1016. [DOI] [PubMed] [Google Scholar]
- 23. Henry RR, Buse JB, Sesti G, et al. Efficacy of antihyperglycemic therapies and the influence of baseline hemoglobin A(1C): a meta‐analysis of the liraglutide development program. Endocr Pract. 2011;17:906–913. [DOI] [PubMed] [Google Scholar]
- 24. Vázquez LA, Jódar E, Trescoli C, Nicolay C, Reviriego J, Gentilella R. Improvement in HbA1c in patients with type 2 diabetes mellitus treated with once weekly dulaglutide across baseline body mass index (BMI) subgroups at 26 or 52 weeks. Diabetologia. 2015;1:S376. [Google Scholar]
- 25. Umpierrez GE, Pantalone KM, Kwan AYM, Zimmermann AG, Zhang N, Fernandez Lando L. Relationship between weight change and glycaemic control in patients with type 2 diabetes receiving once‐weekly dulaglutide treatment. Diabetes Obes Metab. 2016;18:615–622. [DOI] [PMC free article] [PubMed] [Google Scholar]
Associated Data
This section collects any data citations, data availability statements, or supplementary materials included in this article.
Supplementary Materials
Table S1. AWARD clinical studies included in the analysis.
Table S2. Numbers of patients by baseline characteristics subgroups in individual studies.
Table S3. Adjusted (Least‐Square) Mean HbA1c change from baseline at 6 months of individual studies.
Table S4. Adjusted (Least‐Square) Mean FBG Change from baseline at 6 and 12 months of pooled studies.
Table S5. Gastrointestinal adverse events at final endpoints of individual studies.