

Abstract
Objective
To investigate the role of skeletal muscle (SkM) interleukin (IL)‐6 in the regulation of adipose tissue metabolism.
Methods
Muscle‐specific IL‐6 knockout (IL‐6 MKO) and IL‐6loxP/loxP (Floxed) mice were subjected to standard rodent diet (Chow), high‐fat diet (HFD), or HFD in combination with exercise training (HFD ExTr) for 16 weeks.
Results
Total fat mass increased (P < 0.05) in both genotypes with HFD. However, HFD IL‐6 MKO mice had lower (P < 0.05) inguinal adipose tissue (iWAT) mass than HFD Floxed mice. Accordingly, iWAT glucose transporter 4 (GLUT4) protein content, 5′AMP activated protein kinase (AMPK)Thr172 phosphorylation, and fatty acid synthase (FAS) mRNA content were lower (P < 0.05) in IL‐6 MKO than Floxed mice on Chow. In addition, iWAT AMPKThr172 and hormone‐sensitive lipase (HSL)Ser565 phosphorylation as well as perilipin protein content was higher (P < 0.05) in HFD IL‐6 MKO than HFD Floxed mice, and pyruvate dehydrogenase E1α (PDH‐E1α) protein content was higher (P < 0.05) in HFD ExTr IL‐6 MKO than HFD ExTr Floxed mice.
Conclusions
These findings indicate that SkM IL‐6 affects iWAT mass through regulation of glucose uptake capacity as well as lipogenic and lipolytic factors.
Introduction
White adipose tissue (WAT) has been considered an inert tissue with the sole purpose of storing energy in the form of triglycerides and releasing non‐esterified fatty acids (NEFA) when needed. However, studies have shown that WAT releases adipokines, which exert effects on other tissues 1, WAT is susceptible to exercise training adaptations 2, 3, and WAT may play an important role in development of metabolic diseases such as type 2 diabetes 4.
Prolonged energy surplus results in larger WAT mass, altered WAT morphology, and adipocyte hypertrophy 5, which has been associated with increased basal lipolysis and higher NEFA concentrations in the circulation 6. Furthermore, previous studies in rats and mice have shown that intake of high‐fat diet (HFD) decreased visceral WAT glucose transporter 4 (GLUT4) mRNA and protein content 7, 8 and increased sterol regulatory binding element (SREBP)‐1c, fatty acid synthase (FAS), and lipoprotein lipase (LPL) mRNA content in epididymal WAT (eWAT) 9, 10. This indicates that carbohydrate metabolism is decreased and lipid uptake and lipogenesis are increased in visceral WAT during HFD administration. In addition, 5′AMP activated protein kinase (AMPK) phosphorylation and protein content have been shown to be lowered by HFD feeding 6. Because AMPK phosphorylates the inhibitory Ser565 on hormone‐sensitive lipase (HSL) 11, this may suggest that lipolysis is increased in WAT in response to HFD. However, the same study showed that HFD feeding reduced HSLSer563 and Ser660 phosphorylation and perilipin protein content in mouse inguinal WAT (iWAT) and eWAT 6. Together this indicates that HFD results in increased basal lipolysis and triglyceride synthesis as well as reduced protein kinase A (PKA) ‐dependent lipolysis relative to chow feeding.
The changes in WAT metabolism in response to HFD may have detrimental effects on whole‐body metabolism. However, exercise training has been shown to increase insulin sensitivity 12, glucose uptake 2, 3, and lipolytic capacity in human adipose tissue 13. Previous studies have suggested that exercise training‐induced adaptations in adipose tissue metabolism are regulated by interleukin (IL)‐6, secreted from skeletal muscle (SkM) during exercise 14, 15, 16. In line with this, infusion of recombinant IL‐6 in human subjects has been reported to increase lipolysis and fatty acid (FA) oxidation 17, 18, and whole‐body IL‐6 knockout (KO) mice have been demonstrated to develop obesity 19. Furthermore, a previous study has shown that the reduction in iWAT AMPK protein content observed in WT mice in response to exercise training was absent in IL‐6 KO mice 15. As AMPK phosphorylation was similar in iWAT in exercise‐trained IL‐6 KO and WT mice 15, this may indicate that IL‐6 contributes to maintaining the ability to induce PKA‐dependent lipolysis after exercise training. In addition, previous studies have reported that cold exposure and exercise training‐induced regulation of uncoupling protein (UCP)1 mRNA and protein content in mouse iWAT was dependent on IL‐6 16, and that IL‐6 indirectly regulated the glyceroneogenic factors phosphoenolpyruvate carboxykinase (PEPCK) and pyruvate dehydrogenase kinase (PDK)4 in mouse eWAT 20. Taken together these findings indicate that IL‐6 exerts effects in both eWAT and iWAT, and a recent study suggests that IL‐6 signaling may be different in the two depots 21. It has recently been reported that SkM‐specific knockout of IL‐6 (IL‐6 MKO) led to reduced fat mass and body weight in male mice when on HFD 22, suggesting that SkM IL‐6 does not decrease but rather maintain, adipose tissue mass. However, the mechanisms underlying the reduced adipose tissue mass in male IL‐6 MKO mice are unknown.
Therefore, the aim of the present study was to test the hypotheses that SkM IL‐6 is required for (1) maintenance of WAT mass and metabolism in mice on HFD and (2) counteraction of HFD‐induced changes in WAT with exercise training in mice.
Methods
Animals
C57BL/6 mice carrying loxP inserts surrounding exon 2 of the IL‐6 gene as previously described 23 were bred with C57BL/6 mice carrying the Cre recombinase gene under the control of the myogenin promoter 24. This generated Floxed mice carrying the loxP insert (Floxed) and IL‐6 MKO mice. Knockout of IL‐6 in SkM, but not in heart, brown adipose tissue, iWAT, eWAT, and liver was confirmed using primers surrounding exon 2 of the IL‐6 gene (Figure 1a). In addition, IL‐6 mRNA was decreased in quadriceps of IL‐6 MKO mice compared with Floxed mice (Figure 1b). The residual mRNA content is assumed to be contamination from other cell types in whole muscle tissue. In addition, basal plasma IL‐6 levels were undetectable in both genotypes (data not shown).
Figure 1.
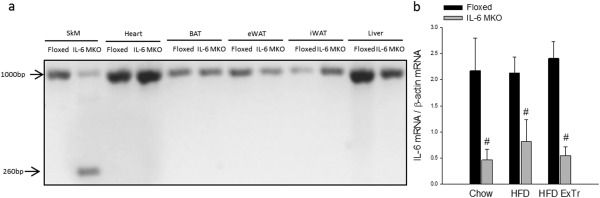
(a) Gel electrophoresis of PCR products generated with primers surrounding exon 2 of the IL‐6 gene in quadriceps (SkM), brown adipose tissue, heart, iWAT, eWAT, and liver and (b) IL‐6 mRNA content in quadriceps in Floxed and IL‐6 MKO mice after 16 weeks on Chow, HFD, or HFD combined with exercise training (HFD ExTr). A reduction in band size from 1,000 bp to 260 bp in panel a is consistent with loss of exon 2 of the IL‐6 gene. Values are mean ± SE. #Significantly different from Floxed within given intervention (P < 0.05).
All animals in this study were kept at 22°C and at a 12:12 h light:dark cycle with ad libitum access to standard rodent diet (Chow) and water if not stated otherwise. All experiments were approved by and carried out according to the guidelines provided by The Danish Animal Experiments Inspectorate (The Danish Ministry of Fishery and Foods, Denmark).
Protocol
Male Floxed and IL‐6 MKO mice were at the age of 8 weeks each randomly divided in three groups and housed individually. A group receiving standard rodent chow diet (Altromin 1314F, Brogaarden, Lynge, Denmark), a group receiving HFD with 60% of calories from fat (Altromin C 1090‐60, Brogaarden, Lynge, Denmark), and a group receiving HFD while having access to a running wheel in the cage (HFD ExTr) (n = 10) for 16 weeks. The HFD ExTr group was during the last 4 weeks running on a treadmill three times a week at 13.8 m/min and 10° incline for 60 min the first week increasing to 16.2 m/min and 10° incline for 60 min the last week. Body weight, food intake, and running distance were recorded weekly. Two days before euthanization, mice were MRI scanned (EchoMRI 4in1, Zinsser Analytic GMBH, Frankfurt, Germany). The reduced number of mice in the MRI data was due to a machine break down (n = 4‐9). After 16 weeks of intervention the mice were euthanized by cervical dislocation, trunk blood was collected in EDTA containing tubes and all iWAT and eWAT were quickly removed and snap frozen in liquid nitrogen. Blood was centrifuged at 2,600g, 4°C for 15 min and plasma was collected.
Plasma NEFA and IL‐6
Plasma NEFA concentration was measured according to the manufacturer's protocol (WAKO, Germany). Plasma IL‐6 was measured using mesoscale discovery v‐plex kit according to manufacturer's protocol (MSD, Rockville, MD).
Glucose and insulin tolerance
The mice were fasted for 6 h (5.30 am to 11.30 am) followed by weighing and measurement of fasting tail blood glucose with a glucometer (Bayer Healthcare inc., Germany). Then mice received an intraperitoneal (IP) injection of glucose (2 mg/g mouse) for the glucose tolerance test (GTT) and insulin (0.5 mU/g mouse) for the insulin tolerance test (ITT) (Actrapid, Novo Nordisk, Denmark). Tail blood glucose concentration was measured with the glucometer (Bayer Healthcare Inc.) 15, 30, 45 60, 90, and 120 min after the injection.
RNA isolation and reverse transcription
RNA was isolated from ≈35 mg crushed or finely cut adipose tissue using a guanidinium‐thiocyanate‐chloroform protocol 25 with modifications 26. Reverse transcription was performed on 1 µg RNA using Superscript II RNAse H− system and oligodT (Life Technologies, Naerum, Denmark).
Real‐time PCR
Real‐time PCR was performed using the ABI‐7900 Sequencing Detection System (Applied Biosystems, Foster City, CA). mRNA sequences were obtained from the ensemble database (http://ensambl.org). Primers and Taqman probes were designed using Primer Express (Applied Biosystems) (Table 1) and probes were 5′‐6‐carboxyfluorescein (FAM) and 3′‐6‐carboxy‐N,N,N′,N′‐tetramethylrhodamine (TAMRA) labeled. Samples were run in triplicates together with a tissue‐specific serial dilution made from a pool of all samples from that tissue. A standard curve was constructed from the results of the serial dilution and used for quantification. Samples were then normalized to single‐stranded (ss) DNA determined by OliGreen® (Life Technologies) as previously described 27.
Table 1.
Primer and Taqman probe sequences used for real‐time PCR
| Gene | Forward primer | Reverse primer | Probe |
|---|---|---|---|
| Cyt c | 5′ TGCCCAGTGCCACACTGT 3′ | 5′ CTGTCTTCCGCCCGAACA 3′ | 5′ AGGCAAGCATAAGACTGGACCAAATCTCCA 3′ |
| FAS | 5′ ATCCTGGAACGAGAACACGATCT 3′ | 5′ GGACTTGGGGGCTGTCGTGTCA 3′ | 5′ CAGTGAAGAAAAGACTCTGGATGGGCACA 3′ |
| LPL | 5′ GAGAGCGAGAACATTCCCTTCA 3′ | 5′ TCCACCTCCGTGTAAATCAAGA 3′ | 5′ CCTGCCCGAGGTTTCCACAAATAAAACCTA 3′ |
| IL‐6R | 5′ CCACGAAGGCTGTGCTGTTT 3′ | 5′ GACAGGGCACCTGGAAGTCA 3′ | 5′ CAAAGAAAATCAACACCACCAACGGGAA 3′ |
| PGC‐1α | 5′ CTCCCTTGTATGTGAGATCACGTT 3′ | 5′ TGCGGTATTCATCCCTCTTGA 3′ | 5′ ACAGCCGTAGGCCCAGGTACGACA 3′ |
| UCP1 | 5′ AAGCGTACCAAGCTGTGCG A 3′ | 5′ AGAAAAGAAGCCACAAACCCTT 3′ | 5′ CCATGTACACCAAGGAAGGACCGACG 3′ |
SDS PAGE and Western blotting
Protein lysates were generated from ≈80 mg of finely cut adipose tissue by homogenization in lysis buffer 28 using a tissue lyzer (Qiagen, Germany). Immediately after homogenization, SDS was added to a concentration of 2%. Samples were then centrifuged at 16,000g for 20 min at 4°C to generate lysates. The bicinchoninic acid assay (Thermo Fischer Scientific, MA) was used to determine the protein concentration in the samples and samples were adjusted to a protein concentration of 0.5 µg/µl in sample buffer.
An equal amount of protein was separated by SDS‐polyacrylamide gel electrophoresis (SDS PAGE) and blotted on to a PVDF membrane by semidry blotting. The membrane was then blocked for 1 h in 3% fish gel (FG) (Sigma Aldrich, Copenhagen, Denmark) and incubated overnight in primary antibody against AMPKα1 protein (Hardie G.), AMPKThr172 phosphorylation (#2535s Cell Signaling Technologies (CST), Danvers, MA), HSL protein, and HSLSer660 and Ser565 as well as perilipin (#8334S CST), GLUT4 protein (#PAI‐1065, ABR), PEPCK protein (#10004943, Cayman Chemical Co., Ann Arbor, MI), PDK4 protein (Hardie G.), PDH‐E1α protein (Hardie G.), PDHSer300 phosphorylation (Hardie G.), and PDHSer232 phosphorylation (#AP1063, Millipore). The following day the membrane was incubated in secondary antibodies (Dako) in 3% FG and quantified using LAS 4000 and Image Quant TL 8.1 (GE Healthcare, Germany).
Statistics
All data are presented as mean ± standard error (SE). A Two way ANOVA was used to test the effect of intervention and genotype. A Student Newman–Keuls post hoc test was used to locate differences. When equal variance was not present, a one way ANOVA was used to test for effects of intervention and a t‐test was used to test for effects of genotype within each of the groups. A significant level of P < 0.05 is used.
Results
Body weight and composition
The body weight of IL‐6 MKO mice, but not Floxed mice, was higher (P < 0.05) on HFD than Chow (Figure 2a), while body weight was similar in HFD ExTr and Chow for both genotypes (Figure 2a). Both genotypes had larger (P < 0.05) fat and lower (P < 0.05) lean body mass on HFD than Chow. Total fat mass was lower (P < 0.05) and total lean mass was larger (P < 0.05) in HFD ExTr than HFD in both genotypes (Figure 2b,c). Additionally, both eWAT and iWAT mass was larger (P < 0.05) on HFD than Chow for both genotypes, but iWAT mass was lower (P < 0.05) in IL‐6 MKO mice than Floxed mice when on HFD. Furthermore, eWAT mass in Floxed mice was lower (P < 0.05) in HFD ExTr than HFD mice (Figure 2d,e).
Figure 2.
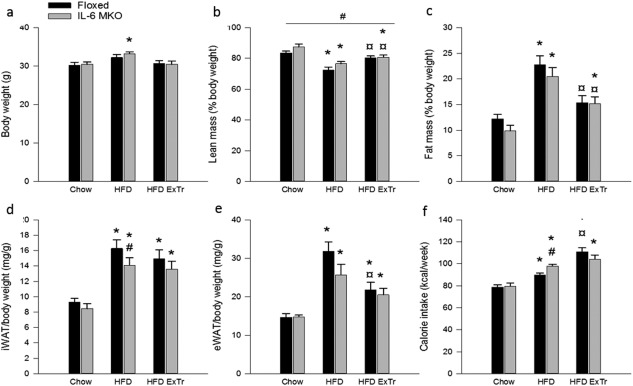
Body weight, body composition, and food intake in Floxed and IL‐6 MKO mice after 16 weeks on Chow, HFD, or HFD combined with exercise training (HFD ExTr). (a) Body weight (n = 10), (b) lean mass as percentage of body weight (n = 4‐9), (c) fat mass as percentage of body weight (n = 4‐9), (d) iWAT mass (n = 10), (e) eWAT mass (n = 9‐10), (f) calorie intake (n = 10). Values are mean ± SE. *Significantly different from Chow within given genotype (P < 0.05). ¤Significantly different from HFD within given genotype (P < 0.05). #Significantly different from Floxed within given intervention (P < 0.05).
Glucose and insulin tolerance
Glucose tolerance was impaired (P < 0.05) in HFD relative to Chow mice for both genotypes, and exercise training did not affect the glucose tolerance relative to HFD (Figure 3a). Insulin tolerance was unaltered in response to HFD and HFD with exercise training for both genotypes (Figure 3b).
Figure 3.
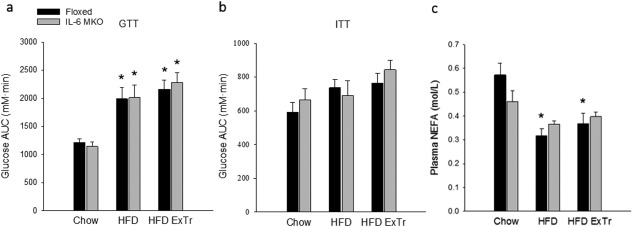
Whole‐body glucose metabolism and plasma NEFA in Floxed and IL‐6 MKO mice after 16 weeks on Chow, HFD, or HFD combined with exercise training (HFD ExTr). (a) Glucose tolerance calculated as glucose area under the curve (AUC), (b) insulin tolerance calculated as glucose AUC, and (c) plasma NEFA in Floxed mice and IL‐6 MKO mice (n = 7‐10). Values are mean ± SE. *Significantly different from Chow within given genotype (P < 0.05).
Plasma NEFA
Plasma NEFA concentrations were lower (P < 0.05) with HFD and HFD ExTr in Floxed mice (Figure 3c).
Regulators of lipolysis
The AMPKThr172 phosphorylation in iWAT was lower (P < 0.05) in IL‐6 MKO than Floxed Chow mice (Figure 4a). Furthermore, AMPKThr172 phosphorylation was lower (P < 0.05) in Floxed HFD mice, and higher (P < 0.05) in IL‐6 MKO HFD mice than the corresponding Chow mice. This resulted in higher (P < 0.05) AMPK phosphorylation in IL‐6 MKO than Floxed HFD mice (Figure 4d). Furthermore, iWAT AMPKThr172 phosphorylation was higher (P < 0.05) in Floxed mice on HFD ExTr than HFD. In addition, IL‐6 MKO mice had higher AMPKThr172 phosphorylation (P < 0.05) when on HFD ExTr than Chow (Figure 4a). AMPKα1 protein content in iWAT was higher (P < 0.05) in HFD and HFD ExTr than Chow for IL‐6 MKO mice, while no differences were observed in Floxed mice (Figure 4d).
Figure 4.
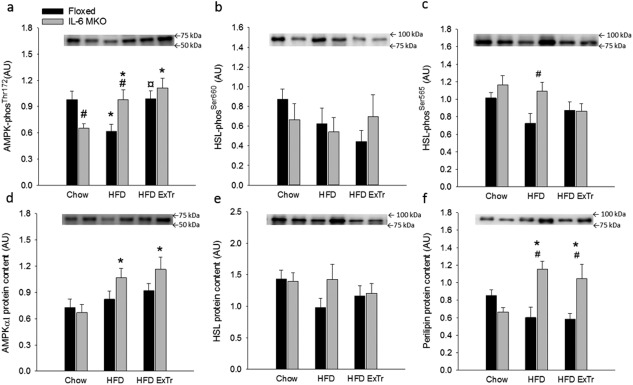
Regulation of AMPK and HSL in iWAT in Floxed and IL‐6 MKO mice after 16 weeks on Chow, HFD, or HFD combined with exercise training (HFD ExTr). (a) AMPKThr172 phosphorylation (phos), (b) HSLSer660 phos, (c) HSLSer565 phos, (d) AMPKα1 protein content, (e) HSL protein content, and (f) perilipin protein content (n = 9‐10). Values are mean ± SE. *Significantly different from Chow within given genotype (P < 0.05). ¤Significantly different from HFD within given genotype (P < 0.05). #Significantly different from Floxed within given intervention (P < 0.05).
There were no differences in iWAT HSLSer660 phosphorylation in either genotype (Figure 4b). However, phosphorylation of HSLSer565 in iWAT was higher (P < 0.05) in HFD IL‐6 MKO mice than HFD Floxed mice (Figure 4c). While no differences were observed in iWAT HSL protein content in either genotype (Figure 4e), iWAT perilipin protein content in IL‐6 MKO mice was higher (P < 0.05) in HFD and HFD ExTr than Chow. This resulted in higher perilipin protein content in IL‐6 MKO than Floxed mice on HFD and HFD ExTr (Figure 4f).
Regulators of lipid and glucose uptake, lipogenesis, and glyceroneogenesis
iWAT GLUT4 protein content in Floxed mice was lower (P < 0.05) in HFD and HFD ExTr than Chow. Moreover, GLUT4 protein content in iWAT was lower (P < 0.05) in IL‐6 MKO than Floxed mice when on chow diet (Figure 5a). iWAT PEPCK protein content was higher (P < 0.05) in IL‐6 MKO than Floxed mice on HFD (Figure 5b). In Floxed mice, iWAT LPL mRNA content was lower (P < 0.05) in HFD than Chow (Figure 5c), and iWAT FAS mRNA content was lower (P < 0.05) with HFD and HFD ExTr than Chow. In addition, iWAT FAS mRNA content in IL‐6 MKO was lower (P < 0.05) in HFD and HFD ExTr than Chow. Furthermore, FAS mRNA content was also lower (P < 0.05) in IL‐6 MKO than Floxed Chow mice (Figure 5d).
Figure 5.
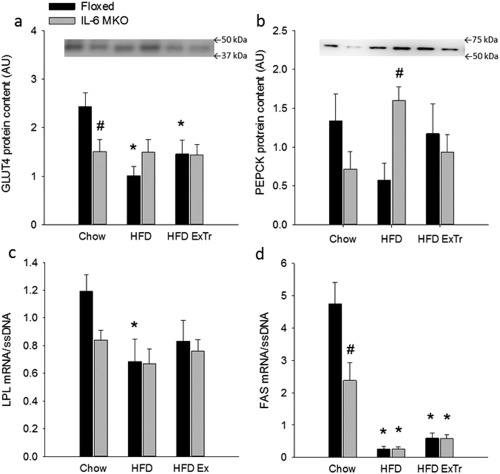
Regulation of GLUT4 and PEPCK protein content as well as LPL and FAS mRNA content in Floxed and IL‐6 MKO mice after 16 weeks on Chow, HFD, or HFD combined with exercise training (HFD ExTr). (a) GLUT4 protein content, (b) PEPCK protein content, (c) LPL mRNA content, and (d) FAS mRNA content (n = 8‐10). Target mRNA is normalized to single‐stranded (ss) DNA. Values are mean ± SE. *Significantly different from Chow within given genotype (P < 0.05). #Significantly different from Floxed within given intervention (P < 0.05).
Key factors in substrate choice
iWAT PDHSer300 and Ser232 phosphorylation was lower (P < 0.05) in HFD and HFD ExTr than Chow for both genotypes (Figure 6a,b), and iWAT PDHSer300 phosphorylation was lower (P < 0.05) in IL‐6 MKO than Floxed mice on Chow (Figure 6a). In Floxed mice, iWAT PDH‐E1α protein content was lower (P < 0.05) in HFD ExTr than both HFD and Chow, while PDH‐E1α protein content was higher (P < 0.05) in IL‐6 MKO than Floxed within HFD ExTr mice (Figure 6d). Additionally, iWAT PDK4 protein was lower (P < 0.05) in HFD and HFD ExTr than Chow for both genotypes (Figure 6c).
Figure 6.
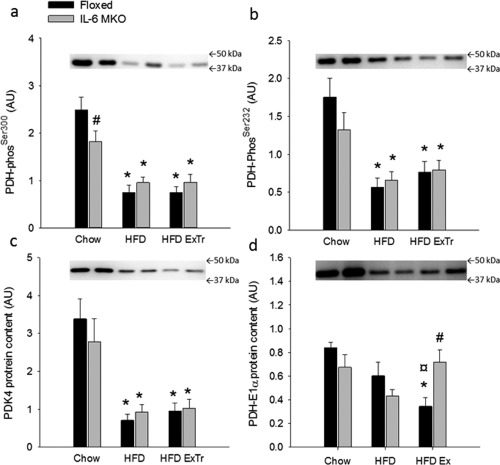
Regulation of PDH in Floxed and IL‐6 MKO mice after 16 weeks on Chow, HFD, or HFD combined with exercise training (HFD ExTr). (a) iWAT PDH‐E1αSer300 phosphorylation (phos), (b) PDH‐E1αSer232 phos, (c) PDK4 protein content and (d) PDH‐E1α protein content (n = 9‐10). Values are mean ± SE. *Significantly different from Chow within given genotype (P < 0.05). ¤Significantly different from HFD within given genotype (P < 0.05). #Significantly different from Floxed within given intervention (P < 0.05).
Discussion
The present study demonstrates for the first time that SkM IL‐6 regulates GLUT4 protein content and AMPK‐phosphorylation in iWAT and is required to prevent a HFD‐induced increase in iWAT perilipin protein content and HSLSer565 phosphorylation. Furthermore, SkM IL‐6 affects PDH‐E1α protein content in iWAT in response to exercise training when on HFD.
The present observation that body weight was unaffected by HFD in Floxed mice was unexpected but in accordance with the only slightly increased caloric intake with HFD relative to Chow. This may be due to the method of feeding, as food was changed once a week in the present study and 2‐3 times a week in a previous study, where body weight was increased with HFD in both Floxed and IL‐6 MKO mice 22. However, the lack of an increase in body weight may also be due to housing conditions as mice in the present study were housed individually and mice in the previous study were housed 4‐5 mice per cage. Thus, housing the mice individually may have increased the demand for thermoregulation 29 and resulted in a higher energy expenditure. Despite this, the findings that both genotypes on HFD gained more body weight (Supporting Information Figure S1) than Chow and increased fat mass and reduced lean mass relative to Chow indicate that HFD did have a metabolic impact. In addition, fat mass was decreased when HFD was combined with exercise training suggesting that exercise training was effective in eliciting metabolic effects. Furthermore, the present study confirms that male IL‐6 MKO mice have a reduced iWAT mass as previously shown 22.
The novel findings that iWAT GLUT4 protein was lower in IL‐6 MKO than Floxed mice on chow diet and that no further reduction was observed with HFD in IL‐6 MKO mice indicate that SkM IL‐6 contributes to the regulation of iWAT glucose metabolism. However, the similar glucose and insulin tolerance in IL‐6 MKO and Floxed Chow mice suggests that the reduced iWAT GLUT4 level did not affect whole‐body glucose metabolism in IL‐6 MKO mice, But other tissues may be capable of compensating for the loss of glucose transport capacity in iWAT. It may be suggested that the lower GLUT4 content was due to the decreased AMPK phosphorylation observed in iWAT of IL‐6 MKO relative to Floxed mice when on chow diet because GLUT4 expression has been shown to increase in response to AICAR and to depend on AMPK activation in SkM 30. This is supported by the previous observation that AMPK phosphorylation in iWAT was lower in IL‐6 KO mice than WT mice 14. However it should be noted that no genotype differences were observed in the present study when AMPK phosphorylation was normalized to AMPKα1 protein content.
In addition, glucose can be converted to glyceraldehyde‐3‐phosphate and used for re‐esterification. As Floxed, but not IL‐6 MKO mice, reduced the GLUT4 protein content in response to HFD feeding, it may be suggested that the lower iWAT GLUT4 content in IL‐6 MKO mice on Chow limited the re‐esterification of lipids when IL‐6 MKO mice were on HFD. This may have contributed to a reduced accumulation of FA in iWAT and thus the lower iWAT mass in IL‐6 MKO.
Adipose tissue FA uptake from circulating triglyceride (TG) sources is limited by LPL in the adipose tissue and thus LPL plays an important role in regulating adipose tissue mass 31. The observation that iWAT LPL mRNA content was lower in IL‐6 MKO than Floxed mice on chow (significant when using a t‐test (P < 0.05)) may therefore have resulted in a lower iWAT FA uptake in IL‐6 MKO than Floxed mice. Thus this may have caused the IL‐6 MKO mice to accumulate less TG in iWAT when put on HFD and hence contributed to the reduced iWAT mass in IL‐6 MKO. The seemingly reduced capability to retrieve FA and glucose from the circulation was reflected in the lower iWAT FAS mRNA content in IL‐6 MKO Chow mice than Floxed Chow mice. FAS mRNA content and FA synthesis have previously been shown to be increased in subcutaneous adipose tissue of GLUT4 KO mice 32. Nevertheless, the present findings that decreased iWAT GLUT4 content in IL‐6 MKO mice on chow diet was associated with lower iWAT FAS mRNA content indicate that SkM IL‐6 regulates FAS and GLUT4 in parallel to increase FA synthesis in iWAT.
Previous studies have shown increased basal lipolysis and decreased PKA‐dependent lipolysis in iWAT with HFD diet 6. Thus, it may be speculated that the lower iWAT mass observed in IL‐6 MKO than Floxed mice on HFD was due to increased lipolysis. However, both HSLSer565 phosphorylation and perilipin protein content were increased in IL‐6 MKO relative to Floxed mice on HFD. As phosphorylation of HSLSer565 inhibits PKA induction of lipolysis 11 and perilipin null mice have been shown to have increased basal lipolysis 33, this may suggest that both basal and PKA‐dependent lipolysis was decreased rather than increased in iWAT of IL‐6 MKO mice. However, the observation that NEFA concentrations were reduced with HFD only in Floxed mice and that plasma glycerol was unaltered (data not shown) does not support this possibility.
It might be speculated that a reduction in re‐esterification in response to HFD could lead to an increase in FA release and thus have contributed to the lower iWAT fat mass observed in the IL‐6 MKO relative to Floxed mice on HFD. However, IL‐6 MKO mice had higher PEPCK protein content in iWAT than Floxed mice when on HFD, indicating that iWAT glyceroneogenic capacity was increased during HFD when SkM IL‐6 was lacking. Glyceroneogenic activity is also dependent on substrate derived from pyruvate, and regulation of the PDH activity is therefore important for glyceroneogenic activity. It would be anticipated that HFD would reduce PDH activity to increase glyceroneogenic substrate availability. On the other hand, the observation that iWAT PDK4 protein and PDH‐E1α phosphorylation decreased with HFD feeding in both genotypes without changes in PDH‐E1α protein content suggests that PDH activity was increased and glyceroneogenesis decreased in iWAT with HFD. Moreover, the findings that iWAT PDH‐E1α protein content in HFD ExTr was decreased in Floxed mice and increased in IL‐6 MKO mice relative to HFD, and with no change in the absolute PDH phosphorylation, mean that the fraction of unphosphorylated and potentially active PDH may have been higher in IL‐6 MKO than Floxed HFD ExTr mice. This may reflect that carbohydrate rather than fat was used for oxidation, and glyceroneogenic activity remained low during HFD combined with exercise training in IL‐6 MKO mice. This possibility is in agreement with a previous study showing that IL‐6 regulates PDH activity in mouse SkM 34.
Contrary to the findings in iWAT, knockout of SkM IL‐6 did not have any effect on factors involved in the regulation of lipogenesis, lipolysis, glyceroneogenesis, or glucose transport capacity in eWAT (Supporting Information Figures S2 and S3). This may suggest that SkM IL‐6 mainly contributes to the regulation of metabolic factors in iWAT.
In conclusion, the current study shows for the first time that loss of SkM IL‐6 alters iWAT GLUT4 protein content and contributes to the regulation of iWAT fat accumulation in response to HFD. Furthermore, the present findings indicate that SkM IL‐6 is important for the regulation of iWAT proteins involved in substrate choice in response to exercise training, while eWAT metabolism is regulated independent of SkM IL‐6. Taken together these findings indicate that SkM IL‐6 contributes to the regulation of key factors in iWAT metabolism.
Supporting information
Supporting Information
Acknowledgments
The authors would like to thank Stine Ringholm for technical assistance and Professor Grahame Hardie, University of Dundee, for providing antibodies.
Funding agencies: The study was supported by grants from the Lundbeck Foundation, The Danish Research Foundation, The Danish Council for Independent Research in the Natural Sciences, the Novo Nordisk Foundation, and the Augustinus Foundation. Centre of Inflammation and Metabolism (CIM) is supported by a grant from the Danish National Research Foundation (#02‐512‐55). CIM is a member of DD2–the Danish Center for Strategic Research in Type 2 Diabetes (the Danish Council for Strategic Research, grant no. 09‐067009 and 09‐075724).
Disclosure: The authors declared no conflict of interest.
References
- 1. Scherer PE, Williams S, Fogliano M, Baldini G, Lodish HF. A novel serum protein similar to C1q, produced exclusively in adipocytes. J Biol Chem 1995;270:26746–26749. [DOI] [PubMed] [Google Scholar]
- 2. Stallknecht B, Andersen PH, Vinten J, et al. Effect of physical training on glucose transporter protein and mRNA levels in rat adipocytes. Am J Physiol 1993; 265:E128–E34. [DOI] [PubMed] [Google Scholar]
- 3. Hirshman MF, Goodyear LJ, Horton ED, Wardzala LJ, Horton ES. Exercise training increases GLUT‐4 protein in rat adipose cells. Am J Physiol 1993;264(6 Part 1):E882–E889. [DOI] [PubMed] [Google Scholar]
- 4. Lundgren M, Svensson M, Lindmark S, Renström F, Ruge T, Eriksson JW. Fat cell enlargement is an independent marker of insulin resistance and ‘hyperleptinaemia’. Diabetologia 2007;50:625–633. [DOI] [PubMed] [Google Scholar]
- 5. Gollisch KS, Brandauer J, Jessen N, et al. Effects of exercise training on subcutaneous and visceral adipose tissue in normal‐ and high‐fat diet‐fed rats. Am J Physiol Endocrinol Metab 2009;297:E495–E504. [DOI] [PMC free article] [PubMed] [Google Scholar]
- 6. Gaidhu MP, Anthony NM, Patel PHTJ, Ceddia RB. Dysregulation of lipolysis and lipid metabolism in visceral and subcutaneous adipocytes by high‐fat diet: role of ATGL, HSL, and AMPK. Am J Physiol Cell Physiol 2010;298:C961–C71. [DOI] [PubMed] [Google Scholar]
- 7. Yanagisawa R, Koike E, Win‐Shwe TT, Yamamoto M, Takano H. Impaired lipid and glucose homeostasis in hexabromocyclododecane‐exposed mice fed a high‐fat diet. Environ Health Perspect 2014;122:277–283. [DOI] [PMC free article] [PubMed] [Google Scholar]
- 8. Gorres BK, Bomhoff GL, Gupte AA, Geiger PC. Altered estrogen receptor expression in skeletal muscle and adipose tissue of female rats fed a high‐fat diet. J Appl Physiol (1985) 2011;110:1046–1053. [DOI] [PMC free article] [PubMed] [Google Scholar]
- 9. Kim S, Jin Y, Choi Y, Park T. Resveratrol exerts anti‐obesity effects via mechanisms involving down‐regulation of adipogenic and inflammatory processes in mice. Biochem Pharmacol 2011;81:1343–1351. [DOI] [PubMed] [Google Scholar]
- 10. Kim YJ, Park T. Genes are differentially expressed in the epididymal fat of rats rendered obese by a high‐fat diet. Nutr Res 2008;28:414–422. [DOI] [PubMed] [Google Scholar]
- 11. Garton AJ, Campbell DG, Carling D, Hardie DG, Colbran RJ, Yeaman SJ. Phosphorylation of bovine hormone‐sensitive lipase by the AMP‐activated protein kinase. Eur J Biochem 1989;179:249–254. [DOI] [PubMed] [Google Scholar]
- 12. Stallknecht B, Larsen JJ, Mikines KJ, Simonsen L, Bülow J, Galbo H. Effect of training on insulin sensitivity of glucose uptake and lipolysis in human adipose tissue. Am J Physiol Endocrinol Metab 2000;279:E376–E385. [DOI] [PubMed] [Google Scholar]
- 13. Stallknecht B, Simonsen L, Bulow J, Vinten J, Galbo H. Effect of training on epinephrine‐stimulated lipolysis determined by microdialysis in human adipose tissue. Am J Physiol Endocrinol Metab 1995;269:E1059–E1066. [DOI] [PubMed] [Google Scholar]
- 14. Kelly M, Keller C, Avilucea PR, et al. AMPK activity is diminished in tissues of IL‐6 knockout mice: the effect of exercise. Biochem Biophys Res Commun 2004;320:449–454. [DOI] [PubMed] [Google Scholar]
- 15. Brandt C, Jakobsen AH, Adser H, et al. IL‐6 regulates exercise and training‐induced adaptations in subcutaneous adipose tissue in mice. Acta Physiol 2012;205:224–235. [DOI] [PubMed] [Google Scholar]
- 16. Knudsen JG, Murholm M, Carey AL, et al. Role of IL‐6 in exercise training‐ and cold‐induced UCP1 expression in subcutaneous white adipose tissue. PLoS One 2014;9:e84910. [DOI] [PMC free article] [PubMed] [Google Scholar]
- 17. Wolsk E, Mygind H, Grondahl TS, Pedersen BK, Hall G. IL‐6 selectively stimulates fat metabolism in human skeletal muscle. Am J Physiol Endocrinol Metab 2010;299:E832–E840. [DOI] [PubMed] [Google Scholar]
- 18. van Hall G, Steensberg A, Sacchetti M, et al. Interleukin‐6 stimulates lipolysis and fat oxidation in humans. J Clin Endocrinol Metab 2003;88:3005–3010. [DOI] [PubMed] [Google Scholar]
- 19. Wallenius V, Wallenius K, Ahren B, et al. Interleukin‐6‐deficient mice develop mature‐onset obesity. Nat Med 2002;8:75–79. [DOI] [PubMed] [Google Scholar]
- 20. Wan Z, Ritchie I, Beaudoin M‐S, Castellani L, Chan CB, Wright DC. IL‐6 indirectly modulates the induction of glyceroneogenic enzymes in adipose tissue during exercise. PLoS One 2012;7:e41719. [DOI] [PMC free article] [PubMed] [Google Scholar]
- 21. Wan Z, Perry CGR, Macdonald T, Chan CB, Holloway GP, Wright DC. IL‐6 is not necessary for the regulation of adipose tissue mitochondrial content. PLoS One 2012;7:e51233. [DOI] [PMC free article] [PubMed] [Google Scholar]
- 22. Ferrer B, Navia B, Giralt M, et al. Muscle‐specific interleukin‐6 deletion influences body weight and body fat in a sex‐dependent manner. Brain Behav Immunity 2014;40:121–130. [DOI] [PubMed] [Google Scholar]
- 23. Quintana A, Erta M, Ferrer B, Comes G, Giralt M, Hidalgo J. Astrocyte‐specific deficiency of interleukin‐6 and its receptor reveal specific roles in survival, body weight and behavior. Brain Behav Immunity 2013;27:162–173. [DOI] [PubMed] [Google Scholar]
- 24. Li S, Czubryt MP, McAnally J, et al. Requirement for serum response factor for skeletal muscle growth and maturation revealed by tissue‐specific gene deletion in mice. Proc Natl Acad Sci USA 2005;102:1082–1087. [DOI] [PMC free article] [PubMed] [Google Scholar]
- 25. Chomczynski P, Sacchi N. Single‐step method of RNA isolation by acid guanidinium thiocyanate‐phenol‐chloroform extraction. Anal Biochem 1987;162:156–159. [DOI] [PubMed] [Google Scholar]
- 26. Pilegaard H, Ordway GA, Saltin B, Neufer PD. Transcriptional regulation of gene expression in human skeletal muscle during recovery from exercise. Am J Physiol Endocrinol Metab 2000;279:E806–E814. [DOI] [PubMed] [Google Scholar]
- 27. Lundby C, Nordsborg N, Kusuhara K, Kristensen K, Neufer P, Pilegaard H. Gene expression in human skeletal muscle: alternative normalization method and effect of repeated biopsies. Eur J Appl Physiol 2005;95:351–360. [DOI] [PubMed] [Google Scholar]
- 28. Birk JB, Wojtaszewski JFP. Predominant α/β2/γ3 AMPK activation during exercise in human skeletal muscle. J Physiol 2006;577:1021–1332. [DOI] [PMC free article] [PubMed] [Google Scholar]
- 29. Himms‐Hagen J, Villemure C. Number of mice per cage influences uncoupling protein content of brown adipose tissue. Exp Biol Med 1992;200:502–506. [DOI] [PubMed] [Google Scholar]
- 30. Jørgensen SB, Treebak JT, Viollet B, et al. Role of AMPK{alpha}2 in basal, training‐, and AICAR‐induced GLUT4, hexokinase II, and mitochondrial protein expression in mouse muscle. Am J Physiol Endocrinol Metab 2007;292:E331–E339. [DOI] [PubMed] [Google Scholar]
- 31. Weinstock PH, Bisgaier CL, Aalto S, et al. Severe hypertriglyceridemia, reduced high density lipoprotein, and neonatal death in lipoprotein lipase knockout mice. Mild hypertriglyceridemia with impaired very low density lipoprotein clearance in heterozygotes. J Clin Invest 1995;96:2555–2568. [DOI] [PMC free article] [PubMed] [Google Scholar]
- 32. Herman MA, Peroni OD, Villoria J, et al. A novel ChREBP isoform in adipose tissue regulates systemic glucose metabolism. Nature 2012;484:333–338. [DOI] [PMC free article] [PubMed] [Google Scholar]
- 33. Tansey JT, Sztalryd C, Gruia‐Gray J, et al. Perilipin ablation results in a lean mouse with aberrant adipocyte lipolysis, enhanced leptin production, and resistance to diet‐induced obesity. Proc Natl Acad Sci USA 2001;98:6494–6499. [DOI] [PMC free article] [PubMed] [Google Scholar]
- 34. Biensø R, Knudsen J, Brandt N, Pedersen P, Pilegaard H. Effects of IL‐6 on pyruvate dehydrogenase regulation in mouse skeletal muscle. Pflugers Arch 2014;466:1647–1657. [DOI] [PMC free article] [PubMed] [Google Scholar]
Associated Data
This section collects any data citations, data availability statements, or supplementary materials included in this article.
Supplementary Materials
Supporting Information