

Abstract
Toxicogenomic approaches can detect and classify adverse interactions between environmental toxicants and other environmental stressors but require more complex experimental designs and analytical approaches. Here we use novel toxicogenomic techniques to analyze the effect of arsenic exposure in wild killifish populations acclimating to changing salinity. Fish from three populations were acclimated to full strength seawater and transferred to fresh water for 1 or 24 h. Linear models of gene expression in gill tissue identified 31 genes that responded to osmotic shock at 1 h and 178 genes that responded at 24 h. Arsenic exposure (100 μg/L) diminished the responses (reaction norms) of these genes by 22% at 1 h (p = 1.0 × 10−6) and by 10% at 24 h (p = 3.0 × 10⁻¹⁰). Arsenic also significantly reduced gene coregulation in gene regulatory networks (p = 0.002, paired Levene’s test), and interactions between arsenic and salinity acclimation were uniformly antagonistic at the biological pathway level (p < 0.05, binomial test). Arsenic’s systematic interference with gene expression reaction norms was validated in a mouse multistressor experiment, demonstrating the ability of these toxicogenomic approaches to identify biologically relevant adverse interactions between environmental toxicants and other environmental stressors.
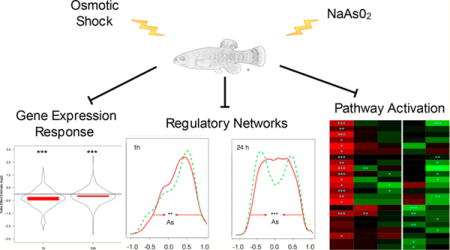
Graphical abstract
■ INTRODUCTION
Arsenic is naturally present in bedrock and is released into aquatic systems, particularly in reducing conditions at high pH.1 Dissolved inorganic arsenic enters cells through sodium/phosphate cotransporters and water channels,2 where it may take the place of phosphorus in biochemical reactions or interact with thiol groups in proteins and peptides3 leading to toxic effects. Many organisms have evolved mechanisms to detoxify arsenic, for example, arsenic methyltransferases, that are highly conserved in nature4 demonstrating that arsenic is a broadly relevant environmental toxicant. Nonetheless, environmental arsenic is best known as a threat to human health, affecting over 100 million people5 by increasing their risk of dozens of diseases.6
Many organisms have been used to understand arsenic’s diverse effects at low doses. For example, studies in chronically exposed mice reveal reduced immune signaling,7 an effect also observed in zebrafish embryos.8 Xenopus tadpoles chronically exposed to arsenic show impaired metamorphosis,9 chick embryos exposed to arsenic respond less to estrogen,10 and mice chronically exposed to arsenic respond less effectively to influenza infection.11 Collectively, these studies suggest that arsenic exposure diminishes the ability of organisms to respond effectively to stress, and our overarching hypothesis is therefore that arsenic’s ability to diminish stress responses is associated with reduced gene expression responses.
Therefore, we tested the hypothesis that exposure to arsenic during a response to a second stressor reduces responses at the gene expression level using killifish as a model system. Like most marine fish, killifish living in salt water maintain internal sodium chloride concentrations that are about 60% less than salt water by excreting excess chloride through their gills.12 Unlike most fish, killifish that are acclimated to salt water can survive the hypo-osmotic shock of being placed in fresh water. They undergo a process of gill tissue remodeling over several days to produce a gill phenotype appropriate to fresh water. Fresh water gills differ from salt water gills primarily in terms of the density and disposition of ionocytes, ion channel activity, epithelial tight junctions, and blood supply.13 Changes in killifish gill gene expression during gill remodeling have been extensively studied at various time points out to 10 days, and killifish from different populations are known to vary in their ability to respond to salinity.14–18 We assessed gene expression in three populations of killifish, at two distinctly different time points, to identify conserved responses.
Killifish survive in changing salinity because they can alter their gill phenotype to suit environmental conditions, in other words, they exhibit phenotypic plasticity.19,20 Altered gene expression has been reported to facilitate phenotypic plasticity in extreme temperatures21,22 or variability in water availability.23 The ability of an organism to regulate gene expression can be quantified as gene expression reaction norms.24 Here we applied the concept of gene expression reaction norms to quantify the impact of arsenic on salinity responses in killifish, hypothesizing that reduced gene expression reaction norms during acclimation to salinity in the killifish gill will reduce phenotypic plasticity.
Gene regulatory networks coordinate gene expression and have been shown to facilitate phenotypic plasticity.15,25 We used a simple statistic based upon Pearson correlation26 to quantify the level of gene regulatory phenotypic plasticity as connectivity in our system and the effect of arsenic on that network connectivity. We hypothesized that exposure to arsenic would reduce network connectivity and interfere with the ability of genes to respond in a coordinated fashion.
Specific gene regulatory networks have been annotated as biological pathways that perform specific functions, for example, those belonging to the Kyoto Encyclopedia of Genes and Genomes (KEGG).27 We hypothesized that if arsenic interference with gene expression responses leads to reduced phenotypic plasticity, arsenic interference might target pathways with functions that facilitate the early or late phases of tissue remodeling in the killifish gill. To assess this, we used Pathway Activation Analysis (PAA) to score whether genes in a given pathway are systematically turned on or off by arsenic or other treatment effects. The general principle is similar to Differential Expression for Pathways (DEAP)28 but PAA does not require explicit knowledge of regulatory relationships. In addition, PAA does not rely on arbitrary significance cutoffs, overcoming a substantial drawback of first generation pathway analysis approaches such as using Fisher’s exact test to identify pathways enriched in genes found significant in a statistical test.29
Novel methods presented here are relevant to any toxicogenomic study involving multiple stressors, and demonstrate that they can detect significant shifts in gene expression that increase our understanding of interactions between biotic and abiotic stressors.30,31 Specifically, we found that arsenic reduced gene expression reaction norms in killifish gill tissue responding to osmotic shock, and that this effect generalized to a second animal model (i.e., mouse). We also report that arsenic diminished network connectivity, and limited activation of biological pathways. An analysis of publicly available data showed that arsenic also reduces reaction norms in response to dexamethasone, a synthetic corticosteroid stress hormone. Taken together, our findings suggest that arsenic toxicity may increase as a function of environmental stress.
■ MATERIALS AND METHODS
Killifish, Arsenic Exposures, and Tissue Collection
Gill tissue was obtained from male wild killifish sampled from two locations in Maine and one in Virginia. We used fish from Northeast Creek, Maine because we have used these fish extensively in previous experiments.2,15,32–39 Fish from Horse-shoe Cove Maine, and King’s Creek Virginia were included in the study to ensure that our results would focus on responses shared by multiple killifish populations. We used a nearby Maine population (Horseshoe Cove) because they were easy to collect and expected to be genetically similar to the Northeast Creek population. The population from King’s Creek, Virginia was supplied by Rich Di Giulio of the Duke Ecotoxicology Lab, and was included because it is representative of the southern killifish clade, which includes all killifish south of the Hudson River in New York.40 Fish (Northeast Creek, 1.62 ± 0.47 g, Horseshoe Cove, 1.68 ± 0.32 g, King’s Creek, 4.74 ± 0.62 g) were preacclimated to common garden conditions, housed, maintained and exposed to arsenic as previously described15 in accordance with IACUC # MDIBL 13–01 from Mount Desert Island Biological Laboratory, Salisbury Cove, Maine. Briefly, 72 killifish were maintained for at least 2 weeks in seawater (pH 8.1 ± 0.4; salinity 33 ± 0.5‰, 15 ± 1 °C) and exposed to natural light cycle (16:8 h light:dark), to ensure all were fully acclimated. Experimental factors included population (Northeast Creek, ME, Horseshoe Cove, ME, King’s Cove, VA), exposure to 100 μg/L arsenic (yes/no), and time exposed to fresh water (0 h, 1 h, 24 h) to yield a balanced design of 18 groups with four fish per group. Freshwater and seawater conditions were established as previously described.41,15 Fish were fed commercial flake food (48% protein, 9% fat; Tetracichlid, Tetra, Blacksburg, VA) once a day that contained no detectable inorganic arsenic, or monomethyl- or dimethyl arsenic (Shaw et al. 2010). Arsenic concentrations in exposed samples were assayed at 100.2 μg/L ± 1.4 μg/L (SD), total arsenic, 98.9% inorganic As III using a 7700x ICP-MS (Agilent, Santa Clara, CA) mass spectrometer. Arsenic concentrations in unexposed samples were below the detection limit of 1.0 μg/L arsenic.
Fish were anesthetized, pithed, and gills were removed and stored in RNAlater (Qiagen, Valencia, CA) according to manufacturer’s recommendations.
RNA Isolation, Hybridization, and Normalization
Tissue samples were removed from RNAlater and rinsed before being homogenized using a Tissue-Tearor (Biospec Products, Bartlesville, OK). The homogenized tissue was then processed using RNeasy kits with DNase treatment (Qiagen, Valencia, CA) according to manufacturer’s protocols to extract RNA. RNA quality and concentration were determined by an Agilent 2100 bioanalyzer. All samples used in genome expression studies achieved an RNA integrity number (RIN) score >7, as required by the in-house protocols of the IU Center for Genomics and Informatics microarray processing core, and widely suggested in the literature.42 RNA was amplified using MessageAmp II kits (Ambion) and hybridized to a custom NimbleGen array that interrogates 135 000 probes associated with 69 426 unique contigs, that map to 16 104 unique genes.15 Raw fluorescence values were quantile normalized across arrays using RMA.43 Complete gene expression data has been deposited at the NCBI Gene Expression Omnibus44 and are accessible through GEO Series accession number GSE104218 (https://www.ncbi.nlm.nih.gov/geo/query/acc.cgi?acc=GSE104218).
Identifying Genes that Significantly Responded to Hypo-Osmotic Shock
As certain killifish genes were associated with more than one probe on the microarray, we selected the probe with the highest median expression across all conditions to represent each unique killifish gene. The Robust MultiArray Average (RMA) normalized log2 expression values for each gene were then analyzed using various linear models in R. False discovery rates (FDR) were calculated from linear model p values using the method of Benjamini and Yekutieli,45 and genes with an FDR less than 0.05 were deemed significant. First, ordinary linear models were used to assess main effects of population, arsenic, acclimation time, and interactions between arsenic and acclimation. The expression of about 60% of all genes differed significantly (FDR < 0.05) between populations, and Maine populations were as different from each other as they were from the Virginia population. Neither arsenic as a factor, nor interactions with arsenic identified specific genes that were differentially expressed (FDR < 0.05) in this model, though genes were identified as differentially expressed at 1 and 24 h. To increase sensitivity to arsenic and its interactions with changing salinity, we modeled gene expression as a function of arsenic, acclimation time and their interactions, treating population as a random effect using the R nlme package.46 Fixed effect linear models and mixed effects linear models on data subsets were also used to explore the data.
Visualizing Differences between of 1 and 24 h Responses
We used Venn diagrams from the R gplots package (https://CRAN.R-project.org/package=gplots) and pairs plots from the R GGally package (https://CRAN.R-project.org/package=GGally) to establish that genes responding at 1 h are distinct from each other and respond differently at the two time points.
Identifying Genes that Significantly Responded to Arsenic
Procedures that control false discovery rates to correct for multiple hypothesis testing set a higher bar for significance and therefore decrease sensitivity, that is, procedures that decrease the false positive rate increase the false negative rate. In the toxicogenomic setting, the capacity to detect true effects may be more important than the ability to avoid detecting spurious effects, so we used a graphical analysis of p value distributions to assess whether FDR corrected statistics might underestimate differential gene expression responses to arsenic and interactions between arsenic and exposure to changing salinity. We used ggplot2 (http://ggplot2.org) to visualize that the number of observed p values that were less than 0.05 exceeded the fraction that would be expected based on the null hypothesis and gene expression independence.
Systematic Assessment of Gene Expression Reaction Norms
The number of genes that respond to treatment is a useful proxy for biological response, and therefore relevant to toxicogenomics.47,48 Therefore, we calculated the impact of arsenic on gene expression reaction norms in salinity responsive genes. First, we used mixed effect linear models with population as a random effect to identify genes that respond significantly (FDR < 0.05) to salinity. Second, we calculated the average absolute log2 response (gene expression reaction norm) in these genes at 1 and 24 h compared to 0 h, in fish that were not experimentally exposed to arsenic. Analogous reaction norm calculations were made for arsenic exposed fish, and the impact of arsenic on hypo-osmotic shock gene expression reaction norms was calculated by subtracting arsenic unexposed reaction norms from arsenic exposed reaction norms. The impact of arsenic on reaction norms was visualized for genes that significantly responded to hypo-osmotic shock using pirate plots in yarrr,49 and significant differences were identified by a one sample t test where the mean difference attributable to arsenic under the null hypothesis was predicted to be zero.
Quantifying Changes in Gene Regulatory Network Structure
Genes regulate other genes, and if arsenic interferes with the ability of killifish to respond to changes in salinity, we hypothesized that it may do so by interfering with regulatory relationships among genes. Regulatory relationships among genes may be visualized as networks and inferred from the level of correlation among genes.50 The impact of arsenic on regulatory network structure was quantified using correlation matrices as follows. Separate correlation matrices were constructed for fish exposed to either 100 μg/L or 0 μg/L arsenic to explore regulatory relationships between genes that respond to hypo-osmotic shock. Pairwise Pearson correlations between all genes significantly responding to salinity at a given time point (1 h, 24 h) were calculated for all samples using the corr.test package in the R psych library,51 resulting in four matrices. Correlation values from each time point (plus and minus arsenic) were then compared in terms of their variability using levene.var.test in the R package PairedData52 which implements a paired Levene’s test using Wilcox’s approach.53 Smaller variability in correlation indicates a larger proportion of genes with near zero correlation, and hence less connectivity in the gene regulatory network.
Pathway Activation Analysis
While it is useful to quantify the impact of arsenic on gene reaction norms and regulatory networks, these assessments do not identify specific biological functions affected by arsenic. To address this shortcoming, we mapped our killifish genes to orthologous genes in the Kyoto Encyclopedia of Genes and Genomes (KEGG) pathways based on zebrafish orthologs using OrthoMCL54 and reciprocal blastp as described in the publication of the killifish reference genome.55 Effect estimates from linear models for all genes (regardless of statistical significance) in 166 KEGG paths were tested for significant pathway level biases toward induction or repression using binomial tests with a null hypothesis that 50% of the genes in any pathway are induced. Significance levels of binomial tests were FDR-corrected for multiple hypothesis testing.
Validation of Arsenic Impact on Gene Expression Reaction Norms
Finally, we used publicly available data to validate that the patterns of arsenic interference observed in killifish during hypo-osmotic shock generalize to other systems exposed to multiple stressors. Validation used normalized gene expression data from two studies in the Gene Expression Omnibus (GEO).56 First, we used GSE47035, a study of killifish exposed to arsenic during acclimation to hyper-osmotic shock.15 Second, we used GSE11056, a study of gene expression responses in mouse lung tissue 8 h after IP injection with arsenic (1 mg/kg), or dexamethasone (1 mg/kg) or both. We chose this study because we are familiar with the experimental details of the data, and because arsenic was combined with dexamethasone, a synthetic steroid hormone similar to cortisol which evokes a broad stress response.57
■ RESULTS AND DISCUSSION
Arsenic’s diverse toxic effects in human populations range from cancer, heart disease, and diabetes to reduced IQ,6 suggesting that environmental exposure to arsenic might affect organisms living in dynamic environments in many different ways. Our toxicogenomic analysis in killifish reveals that arsenic interferes with gene expression responses to osmotic shock at three levels of biological organization: individual genes, regulatory networks, and biological pathways. Publicly available data, analyzed with our techniques, suggest that arsenic’s interference with gene expression responses extends to other species.
We had previously observed that acute exposure to high doses of arsenic (12 mg/L) during acclimation from fresh water to salt water led to high rates of mortality,39 although this arsenic concentration failed to increase mortality in fish maintained in stable conditions, suggesting adverse interactions between arsenic and osmotic shock. We have also shown that 100 μg/L arsenic interferes with the induction of serum and glucocorticoid-regulated kinase 1 (SGK1) that normally occurs when fresh water acclimated killifish are exposed to salt water.36 Finally, in a recent whole transcriptome experiment in a single killifish population we showed that arsenic’s impact on gene expression during salinity acclimation extends far beyond SGK1 by identifying roughly 400 killifish genes with a significant interactions between exposure to arsenic (100 μg/L) and changed salinity.15 In the present study, we assessed the impact of arsenic on gene expression in three populations of seawater acclimated killifish during acclimation to fresh water, looking for arsenic-mediated differences in gene expression.
Identifying Differentially Expressed Genes
This report presents methods to identify biologically relevant patterns in gene expression responses. As patterns require many genes to define, we began by estimating how many genes respond to each treatment condition. Assuming that the roughly 16 000 genes measured on our array respond independently, about 800 (5%) of these genes are expected to achieve a p value of 0.05 or less in any statistical test under the null hypothesis. Recognizing this, toxicogenomic studies often use false discovery rate (FDR) calculations45 to reduce the number of false positive calls, but this approach can also increase false negative calls, eliminating genes whose expression truly varies and making downstream analysis problematic.58 FDR calculations may therefore underestimate the number of genes differentially expressed in a toxicogenomic experiment.
Our design included 24 fish from each of three separate populations, making our results more likely to represent killifish in general than an experimental design using a single population. Although this study was not intended to explore population differences in detail, fixed effect linear models were used to independently assess each of the three populations (Northeast Creek, Maine (NEC), King’s Creek Virginia (KC), and Horseshoe Cove, Maine (HC)). These results were compared to mixed effect linear models treating population as a random effect.
Mixed effects linear models were more sensitive to differential gene expression than independent, fixed effect models, identifying 178 genes that responded significantly (FDR < 0.05) to fresh water exposure at 24 h (Figure 1A, red bar) compared to a total of 105 unique genes identified by fixed effect models in either Northeast Creek (green bar) King’s Creek (blue bar) or Horseshoe Cove (purple bar). Neither fixed nor mixed effect linear models identified large numbers of arsenic responsive genes or genes with arsenic interactions. This result either suggests that 100 μg/Ll arsenic affects very few genes in the killifish gill, or that our design and statistics simply failed to detect arsenic responsive genes.
Figure 1.
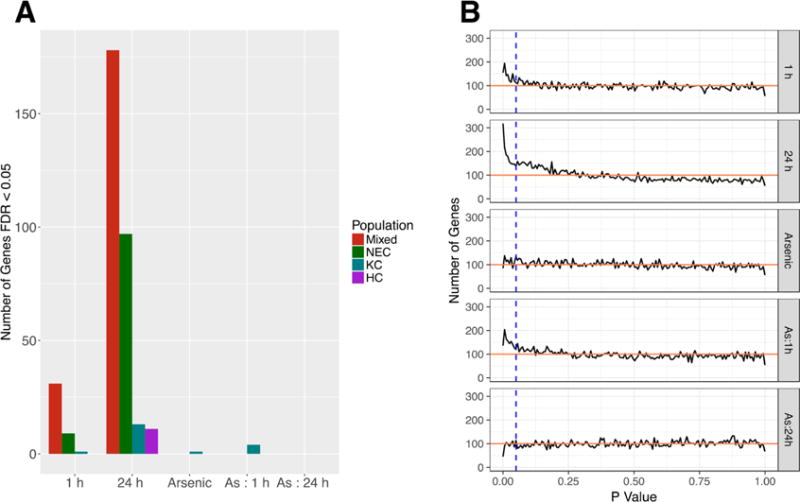
A Number of significant genes (FDR < 0.05) identified by mixed effect linear models (Mixed) or by fixed effect linear models of each killifish population (NEC = Northeast Creek, KC = King’s Creek, HC = Horseshoe Cove). Counts shown for each model term including time of exposure to fresh water, exposure to arsenic or interactions between arsenic and time (As: 1 h, As: 24 h). 7 Distribution of mixed effect p values for all 16 104 unique genes associated with each model term. Horizontal line shows expected number of genes (100) in each bin assuming uniform distribution. Vertical line demarks a nominal p value of 0.05.
Complete mixed effect linear model output is available in Supporting Information (SI) Table 1.
An analysis of p value distributions suggests that using FDR correction to identify treatment effects underestimates the number of arsenic-responsive genes, particularly with respect to interactions between arsenic exposure and exposure to fresh water for 1 h. Figure 1B shows the observed number of p values within a specified range and the theoretical expectation (red horizontal line) assuming the null hypothesis and gene expression independence. P value bin ranges in Figure 1B were selected to contain exactly 100 genes in the case that the null hypothesis is universally true, that is, in the case where there are no true treatment effects. The area under the curve in Figure 1B that lies above the red line therefore represents the number of genes that achieved significance for some other reason than simultaneously testing many genes. For all model terms, the total area under the curve, to the left of the vertical bars (p < 0.05) and above the horizontal line identifies 1793 instances of significance that are not attributable to the multiple hypotheses testing burden—about 8 times as many significantly differentially expressed genes as were identified in Figure 1A by mixed effect models with an FDR < 0.05 (208 genes). Defining “differential expression” as a fold change greater than 2 together with a p value of less than 0.05 increases the number of differentially expressed genes to 389, but still leaves out most of the 1793 instances of significance that are not attributable to the multiple hypotheses testing burden.
Genes differentially expressed at 1 h are distinct from those at 24 h in terms of set composition (Figure 2A). This finding is consistent with previous reports that the response to osmotic shock in the killifish gill includes a crisis phase in the first 6 h followed by a second response that facilitates gill remodeling over several days.17,59–61 Not only were the gene sets identified in this experiment distinct, but genes selected at the two time points were largely uncorrelated in their response (Figure 2B, second row, first column, r = −0.116) consistent with functional independence. Salinity effect estimates at 1 h were anticorrelated with 1 h arsenic interactions (Figure 2B, third row, first column r = −0.675) and 24 h salinity effects were anticorrelated with 24 h arsenic interactions (Figure 2B, fourth row, second column r = −0.429). Negative correlations between salinity effects and interaction effects at the same time point suggest that arsenic interactions are largely antagonistic.
Figure 2.
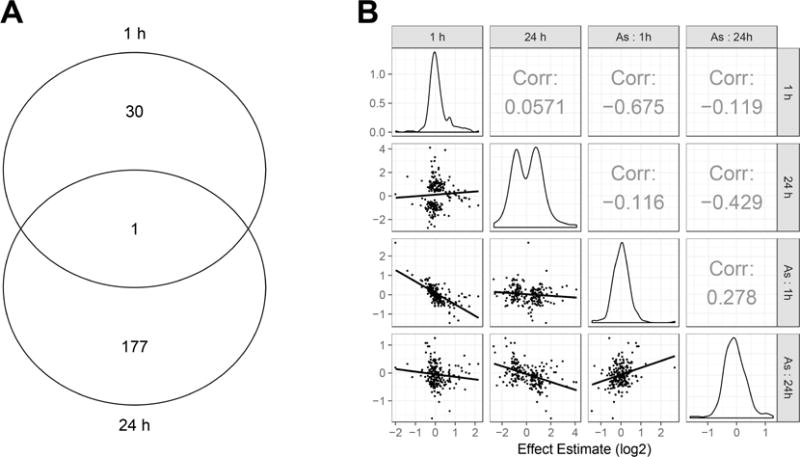
A Gene set overlap of significant early response genes (FDR < 0.05) at 1 and 24 h. B Correlation of effect estimates of the 208 unique genes shown in Figure 2A, comparing 1 h, 24 h, and arsenic interactions at 1 h (“As: 1 h”), and at 24 h (“As: 24h”). Linear regression lines and 95% confidence interval shown as shaded areas.
Annotations for genes identified in Figure 2A and 2B are available in SI Table 2 and SI Table 3.
Arsenic Systematically Reduced the Magnitude of Hypo-osmotic Response
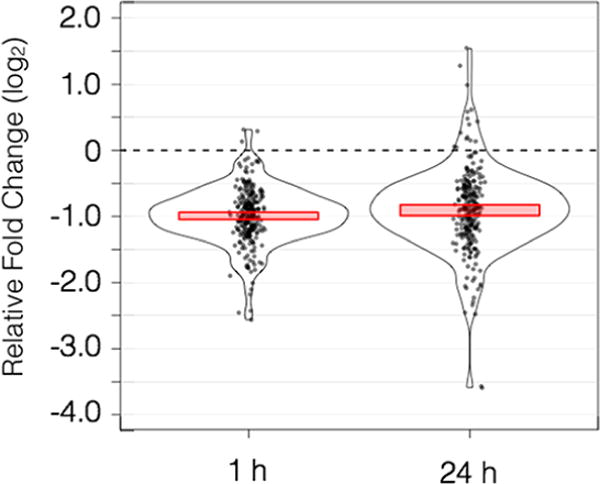
Antagonism between arsenic and beneficial environmental stress responses would be predicted to lead to adverse outcomes if antagonism is sufficiently large. We have assessed this question by looking at gene expression reaction norms in response to hypo-osmotic challenge in the absence of arsenic and comparing these responses to gene-expression reaction norms when arsenic was present. As shown in Figure 3, gene expression responses were decreased in the presence of arsenic by −0.36 in log2 units, equivalent to a 22% reduction at 1 h. At 24 h, response repression attributable to arsenic was reduced by 10%. Both effects were highly statistically significant based on paired t tests, p-value = 1.0 × 10⁻⁶ (1 h) and p-value = 3.0 × 10⁻¹⁰ (24 h).
Figure 3.
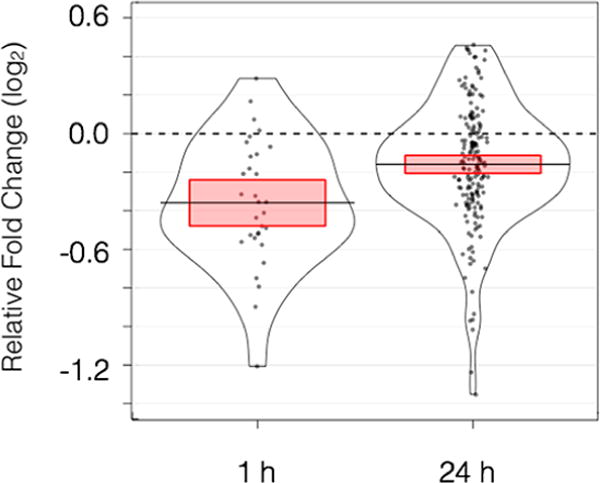
Impact of arsenic on the magnitude of gene expression responses to hypo-osmotic shock, in log2 units of fold change. Each dot represents a gene that responded significantly at the given time point. Height on the y axis shows the extent to which arsenic increased or decreased response to changing salinity, calculated by subtracting baseline reaction norms from arsenic exposed reaction norms. The frequency of observing a given response is shown by kernel density estimations. Red bars delineate the 95% confidence interval of the mean value.
Arsenic mediated reduction in transcriptional responses to changing environmental conditions would be predicted to lead to delayed or incomplete salinity acclimation, reducing the ability of fish to compete in niches that require euryhalinity. If arsenic is not unique in its ability to alter environmental stress responses, measuring toxicant-mediated systematic differences in gene expression response may help explain the etiology of adverse outcomes, a key challenge of environmental toxicology.62
Arsenic Reduced Coexpression in Gene Regulatory Networks
Environmental stress responses involve many genes acting in a coordinated fashion15 and we hypothesized that arsenic interferes with coordinated behavior by affecting gene regulatory networks. To test this hypothesis, we assessed the level of correlation between genes in salinity responsive gene regulatory networks in fish that either were or were not exposed to arsenic. Greater correlation suggests stronger connections between genes.26 Gene–gene connectivity can be measured by Pearson correlation, which ranges from −1 to +1.
Positive correlations occur when genes induce the expression of other genes, and negative correlations suggest mutual repression. The overall network architecture of genes responding to salinity can be visualized as kernel density plots of the frequency with which specific levels of correlation (connectivity) are observed, as shown in Figure 4.
Figure 4.
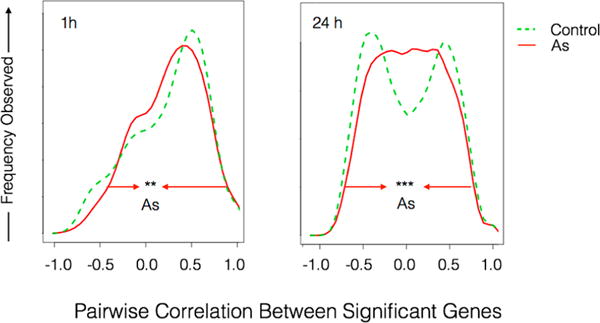
Impact of arsenic on frequency distributions of gene regulatory network connectivity following 1 or 24 h exposure to hypo-osmotic shock. Distributions of gene–gene correlations were calculated for the salinity responsive genes shown in Figure 2. Arsenic distributions (red line) were significantly shifted toward gene–gene correlations of zero at 1 h (“**” p = 0.002 Levene’s test) compared to distributions of correlation observed in fish that were not exposed to arsenic (dashed green line). The effect was extremely significant at 24 h (“***” p = 2.2 × −16 Levene’s test).
Different genes, and therefore different gene networks, are regulated during early and late responses to osmotic shock.14 In our study, networks composed of genes that significantly responded to hypo-osmotic shock at 1 h yielded network relationships that were dominated by positive correlations, as evidenced by the single peak in the distribution with a mode around 0.5 (Figure 4, 1h). Networks composed of genes that responded at 24 h showed a bimodal distribution in correlations (Figure 3, right) suggesting that genes in these networks both induce and repress each other. This is consistent with transient induction of genes associated with the early, crisis response to osmotic shock, followed by repression of the early genes and induction of the independent process involved in long-term acclimation that is known to occur.61 Despite differences in network structures inferred from early and late responses to osmotic shock, arsenic reduced network connectivity at both time points.
Arsenic Exposure Activated Cellular Proliferation Response Pathways
We hypothesized that arsenic’s ability to block phenotypic plasticity15,36,39 may depend on its ability to systematically interfere with the expression of genes in specific biological pathways. We used KEGG27 pathways, manually curated gene sets composed of genes that participate in well understood biological functions, to test this hypothesis.
The most commonly used pathway analysis approach takes advantage of the idea that if pathways are specifically affected by experimental conditions, there should be significantly more differentially expressed genes in paths that are affected than those that are not. This approach is sometimes referred to as over representation analysis, because under the null hypothesis, differentially expressed genes should be randomly scattered across all pathways. Given a list of differentially expressed genes, and the pathways to which they belong, Fisher’s exact test can therefore identify pathways that include more of these genes than expected by chance. In the present case, however, no genes responded significantly (FDR < 0.05) to arsenic exposure or interactions between arsenic and fresh water exposure, making this approach to pathway analysis impossible. Rather than selecting a new threshold of significance or interpreting the result as evidence that arsenic does not interfere with gene expression at the pathway level, we instead chose to measure pathway activation, an approach that does not require lists of differentially expressed genes.
Briefly, Pathway Activation Analysis (PAA) uses binomial tests to determine whether the pattern of differential expression in a given pathway is consistent with systematic induction or repression of the pathway as a whole: the null hypothesis is that differential expression will be evenly split between induction and repression. All genes on each pathway are interrogated based on linear model effect estimates relative to the reference condition (0 h, arsenic unexposed) without regard to statistical significance. Despite the fact that no individual genes were significantly differentially expressed in response to arsenic (FDR < 0.05 based on p values from mixed effect linear models), PAA identified 23 pathways that were significantly affected by arsenic or arsenic interactions (FDR < 0.05).
Arsenic as a single stressor significantly activated 17 pathways including many involved in cellular proliferation, gene expression and ribosome biogenesis (Figure 5, first column). Mean activation for significant paths was 81% (deep red) meaning that fewer than 20% of genes in these pathways were repressed by arsenic compared to control. Activation significance in Figure 5 is FDR-corrected to take into account the fact that 5% of 166 paths would be expected to achieve significance by chance alone. Although further molecular tests are required to establish the mechanism by which arsenic might systematically induce these pathways, global induction of gene expression by arsenic has been attributed to epigenetic effects.63
Figure 5.
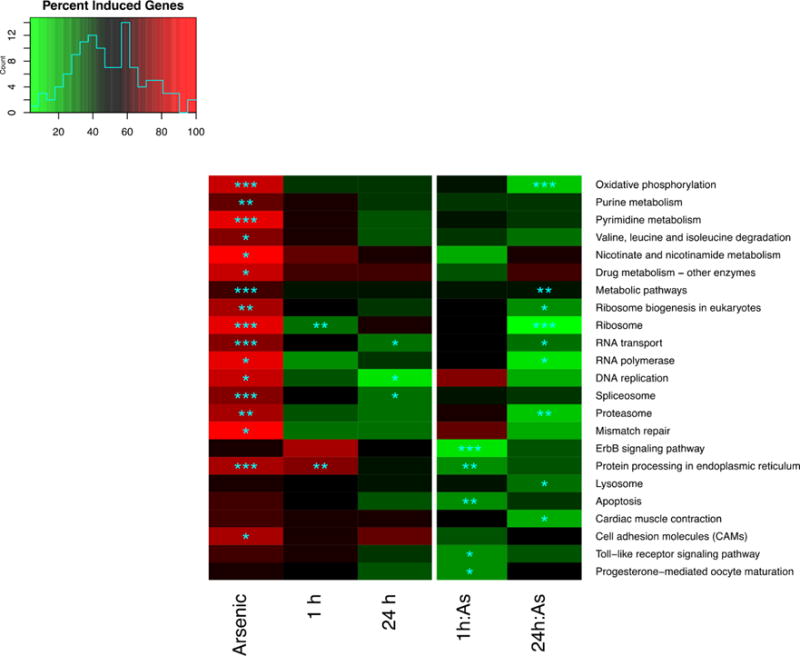
Pathway activation analysis of arsenic, hypo-osmotic shock at 1 h, 24 h and interaction effects between osmotic shock and arsenic. Cell colors indicate percent of genes on a path that were induced ranging from 5% (green) to 100% (red). Asterisks denote FDR corrected significance in a binomial test (“*” = 0.05, “**” = 0.01, “***” = 0.001).
Some pathway activation effects in Figure 5 are generally consistent with the literature, for example, arsenic in groundwater interferes with mismatch repair64 and interferes with glucuronidation,65 a key step in the drug metabolism pathway that was significantly affected by arsenic in this analysis.
At the same time, it should be noted that there is no named KEGG pathway for “salinity acclimation in the gill” or “response to environmental arsenic”, so some of the significant pathways appear out of place, even though they may make sense on closer inspection. For example, “cardiac muscle contraction” is relevant to gill biology because both involve ion transport. Similarly, “progesterone mediated oocyte maturation” may be relevant to arsenic interference with salinity acclimation in the gill because progesterone is a steroid hormone involved in chloride secretion66 and steroid hormone signaling plays a major role in killifish salinity acclimation.67 Thus, the ability of pathway activation analysis to connect arsenic exposure with activation of these pathways suggests that it can successfully map gene expression changes to relevant biological effects.
Based on pathway activation, the effect of arsenic alone would be predicted to increase energy expenditure in general, making it more difficult for arsenic exposed organisms to tolerate a second stressor, especially one like salinity acclimation68 which is energetically intense and consumes up to 10% of the total energy budget.61 The combination of arsenic and a second stressor might therefore create a resource allocation conflict that would be expected to reduce fitness.
Arsenic Responses Interfered with Salinity Response Pathways
Whether due to energy constraints or some other factor, gene expression responses to arsenic and salinity interfered with each other in this experiment, at the pathway level. For example, “protein processing in the endoplasmic reticulum” pathway was significantly activated when seawater acclimated killifish were exposed to fresh water for 1 h (Figure 5, column 2), and significantly activated by arsenic alone (Figure 5, column 1). Although a simple additive model suggests that the combination of arsenic exposure and salinity acclimation would further activate this pathway, the arsenic interaction term at 1 h for “protein processing in the endoplasmic reticulum” (Figure 5, Column 4) is significantly less than additive and suggests relative pathway repression (green color).
Significant pathway activation effects were observed for arsenic interactions with 1 h salinity (5 significant pathways in column 4 of Figure 5) and arsenic interactions at 24 h (9 significant pathways, in column 5 of Figure 5) and they were universally associated with relative deactivation (green color) of these paths, with an average activation level of 22%, meaning that more than 80% of genes in these pathways were repressed relative to the expectation of additivity. Although further experiments are required to know how interference between arsenic and response to hypo-osmotic shock affect fitness, these data suggest that killifish exposed to arsenic during the process of acclimation acclimate less effectively.
Arsenic Reduced the Magnitude of Hyper-osmotic Response
Above, we have shown that arsenic interferes with gene expression reaction norms in three populations of killifish transitioning from full strength seawater to fresh water. This raises the question of whether arsenic interferes with both hypo- and hyper-osmotic shock responses in killifish. We reanalyzed previously published gene expression data in which a single population was exposed to arsenic during fresh water to seawater acclimation to to assess this. We found that arsenic reduced the reaction norm of genes that significantly responded to hyper-osmotic shock at both 1 and 24 h by about 1 unit on a log2 scale (50%), an effect that was highly significant at both time points, paired t test p-value = 2.2 × 10⁻¹⁶ (Figure 6). Arsenic’s antagonistic effect during acclimation to seawater is consistent with the antagonistic effect observed during acclimation to fresh water.15
Figure 6.
Impact of arsenic on magnitude of gene expression responses to hyper-osmotic shock, in log2 units of fold change. Each dot represents a gene that responded significantly to hyper-osmotic shock at the given time point. Height on the y axis shows the extent to which arsenic increased or decreased the response to changing salinity, calculated by subtracting baseline reaction norms from arsenic exposed reaction norms. The frequency of observing a given response is shown by kernel density estimations. Red bars delineate the 95% confidence interval of the mean value.
Arsenic Reduced the Magnitude of a General Stress Response
Having demonstrated that exposure to 100 μg/L arsenic reduced gene expression responses to osmotic stress during both hyper- and hypo-osmotic shock, we looked for evidence that arsenic might interfere with stress responses in other systems. Dexamethasone is a synthetic stress hormone which binds to the glucocorticoid receptor and elicits a large number of transcriptional events, including the repression of many pro-inflammatory genes, consistent with a stress response involving the hypothalamic-pituitary-adrenal axis.69 Dexamethasone’s broad transcriptional effect involves complex signaling events with which arsenic might interfere. Analysis of mouse lung gene expression data (https://www.ncbi.nlm.nih.gov/geo/query/acc.cgi?acc=GSE11056) published as part of a study of arsenic exposure7 shows that exposure to arsenic (1 mg/kg intraperitoneal injection) at 8 h significantly interferes with the strength of the gene expression response to 1 mg/kg intraperitoneal dexamethasone (p = 2.2 × −16, paired t test) as shown in Figure 7.
Figure 7.
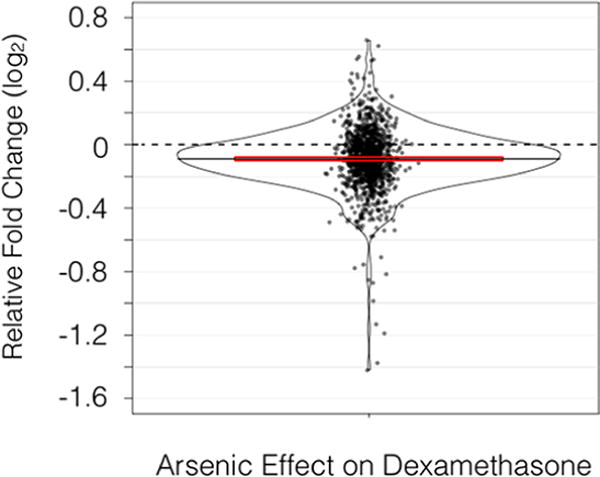
Impact of arsenic on magnitude of gene expression responses to dexamethasone in log2 units of fold change. Each dot represents a gene that responded significantly to dexamethasone. Height on the y axis shows the extent to which arsenic increased or decreased the response to dexamethasone, calculated by subtracting baseline reaction norms from arsenic exposed reaction norms. The frequency of observing a given response is shown by kernel density estimations. Red bars delineate the 95% confidence interval of the mean value.
Results in killifish and mice therefore validate that arsenic interferes with gene expression stress responses, and also demonstrate that the methods outlined in this report can increase our understanding of interactions between environmental toxicants and other stressors, a contemporary challenge in environmental toxicology.70
Collectively, we have determined that arsenic reduces the gene response to other stressors at three levels of biological organization: gene response, gene regulatory networks, and biological pathways. In doing so, we detail three novel analytical techniques, namely, identifying gene-expression reaction norms, gene network connectivity, and pathway activation. These techniques embrace the reality that genes often do not operate independently, an assumption of most traditional toxicogenomic methods. These methods were developed to fill gaps in current multistressor methods, which are limited in their abilities to identify significant interactions and are often limited by upstream FDR corrections. In this study, we apply these methods to reveal that arsenic inhibits salinity acclimation in killifish by decreasing gene response reaction norms, diminishing gene network connectivity, and uniformly producing antagonistic interactions at the pathway level. These methods will facilitate toxicogenomic studies of multistressors either used independently or in conjunction with established methods, to improve environmental risk assessment.
Supplementary Material
Acknowledgments
Support for these studies was provided by NIEHS grant number P42-ES007373 (T.H.H and B.A.S), Institutional Development Awards (IDeA) from the National Institute of General Medical Sciences (NIGMS) under grant numbers P20GM0103423 and P20GM104318 (J.R.S.), the National Institute of Environmental Health Sciences (NIEHS) grant R01 ES019324 (J.R.S.); the National Science Foundation (NSF) grant DEB-1120512 (J.R.S.), the Salisbury Cove Research Fund (J.R.S.); and the METACyt Initiative of IU, through a grant from the Lilly Endowment, Inc. to the Center for Genomics and Bioinformatics at IU.
Footnotes
Supporting Information The Supporting Information is available free of charge on the ACS Publications website at DOI: 10.1021/acs.est.8b01550.
Annotated output from mixed effect linear models including probe, effect estimate, p value, FDR corrected p value, and gene annotation is available as Supplemental Table 1 (XLSX)
Genes that were significantly differentially expressed in these models (FDR < 0.05) at 1 or 24 h are available in Supplemental Table 2 (XLSX)
Supplemental Table 3 (XLSX)
ORCID
Thomas H. Hampton: 0000-0003-0543-402X
The authors declare no competing financial interest.
References
- 1.Smedley PL, Kinniburgh DG. A review of the source, behaviour and distribution of arsenic in natural waters. Appl Geochem. 2002;17(5):517–568. [Google Scholar]
- 2.Jung D, Adamo MA, Lehman RM, Barnaby R, Jackson CE, Jackson BP, Shaw JR, Stanton BA. A novel variant of aquaporin 3 is expressed in killifish (Fundulus heteroclitus) intestine. Comp Biochem Physiol, Part C: Toxicol Pharmacol. 2015;171:1–7. doi: 10.1016/j.cbpc.2015.03.001. [DOI] [PMC free article] [PubMed] [Google Scholar]
- 3.Hughes MF, Beck BD, Chen Y, Lewis AS, Thomas DJ. Arsenic Exposure and Toxicology: A Historical Perspective. Toxicol Sci. 2011;123(2):305–332. doi: 10.1093/toxsci/kfr184. [DOI] [PMC free article] [PubMed] [Google Scholar]
- 4.Thomas D. Elucidating the pathway for arsenic methylation. Toxicol Appl Pharmacol. 2004;198(3):319–326. doi: 10.1016/j.taap.2003.10.020. [DOI] [PubMed] [Google Scholar]
- 5.Singh R, Singh S, Parihar P, Singh VP, Prasad SM. Arsenic contamination, consequences and remediation techniques: A review. Ecotoxicol Environ Saf. 2015;112:247–270. doi: 10.1016/j.ecoenv.2014.10.009. [DOI] [PubMed] [Google Scholar]
- 6.Naujokas MF, Anderson B, Ahsan H, Aposhian HV, Graziano J, Thompson C, Suk WA. The Broad Scope of Health Effects from Chronic Arsenic Exposure: Update on a Worldwide Public Health Problem. Environ Health Perspect. 2013;121(3):295–302. doi: 10.1289/ehp.1205875. [DOI] [PMC free article] [PubMed] [Google Scholar]
- 7.Kozul CD, Hampton TH, Davey JC, Gosse JA, Nomikos AP, Eisenhauer PL, Weiss DJ, Thorpe JE, Ihnat MA, Hamilton JW. Chronic exposure to arsenic in the drinking water alters the expression of immune response genes in mouse lung. Environ Health Perspect. 2009;117(7):1108–1115. doi: 10.1289/ehp.0800199. [DOI] [PMC free article] [PubMed] [Google Scholar]
- 8.Mattingly CJ, Hampton TH, Brothers KM, Griffin NE, Planchart A. Perturbation of defense pathways by low-dose arsenic exposure in zebrafish embryos. Environ Health Perspect. 2009;117(6):981–987. doi: 10.1289/ehp.0900555. [DOI] [PMC free article] [PubMed] [Google Scholar]
- 9.Davey JC, Nomikos AP, Wungjiranirun M, Sherman JR, Ingram L, Batki C, Lariviere JP, Hamilton JW. Arsenic as an Endocrine Disruptor: Arsenic Disrupts Retinoic Acid Receptor–and Thyroid Hormone Receptor–Mediated Gene Regulation and Thyroid Hormone–Mediated Amphibian Tail Metamorphosis. Environ Health Perspect. 2008;116(2):165–172. doi: 10.1289/ehp.10131. [DOI] [PMC free article] [PubMed] [Google Scholar]
- 10.Davey JC, Bodwell JE, Gosse JA, Hamilton JW. Arsenic as an Endocrine Disruptor: Effects of Arsenic on Estrogen Receptor–Mediated Gene Expression In Vivo and in Cell Culture. Toxicol Sci. 2007;98(1):75–86. doi: 10.1093/toxsci/kfm013. [DOI] [PubMed] [Google Scholar]
- 11.Kozul CD, Ely KH, Enelow RI, Hamilton JW. Low-Dose Arsenic Compromises the Immune Response to Influenza A Infection in Vivo. Environ Health Perspect. 2009;117(9):1441–1447. doi: 10.1289/ehp.0900911. [DOI] [PMC free article] [PubMed] [Google Scholar]
- 12.Evans DH. Teleost fish osmoregulation: what have we learned since August Krogh, Homer Smith, and Ancel Keys. AJP: Regulatory, Integrative and Comparative Physiology. 2008;295(2):R704–R713. doi: 10.1152/ajpregu.90337.2008. [DOI] [PubMed] [Google Scholar]
- 13.Kültz D. Physiological mechanisms used by fish to cope with salinity stress. J Exp Biol. 2015;218(Pt 12):1907–1914. doi: 10.1242/jeb.118695. [DOI] [PubMed] [Google Scholar]
- 14.Brennan RS, Galvez F, Whitehead A. Reciprocal osmotic challenges reveal mechanisms of divergence in phenotypic plasticity in the killifish Fundulus heteroclitus. J Exp Biol. 2015 doi: 10.1242/jeb.110445. jeb.110445.2181212. [DOI] [PubMed] [Google Scholar]
- 15.Shaw JR, Hampton TH, King BL, Whitehead A, Galvez F, Gross RH, Keith N, Notch E, Jung D, Glaholt SP, et al. Natural selection canalizes expression variation of environmentally induced plasticity-enabling genes. Mol Biol Evol. 2014;31(11):3002–3015. doi: 10.1093/molbev/msu241. [DOI] [PMC free article] [PubMed] [Google Scholar]
- 16.Kozak GM, Brennan RS, Berdan EL, Fuller RC, Whitehead A. Functional And Population Genomic Divergence Within And Between Two Species Of Killifish Adapted To Different Osmotic Niches. Evolution. 2014;68(1):63–80. doi: 10.1111/evo.12265. [DOI] [PubMed] [Google Scholar]
- 17.Whitehead A, Galvez F, Zhang S, Williams LM, Oleksiak MF. Functional genomics of physiological plasticity and local adaptation in killifish. J Hered. 2011;102(5):499–511. doi: 10.1093/jhered/esq077. [DOI] [PMC free article] [PubMed] [Google Scholar]
- 18.Whitehead A, Roach JL, Zhang S, Galvez F. Genomic mechanisms of evolved physiological plasticity in killifish distributed along an environmental salinity gradient. Proc Natl Acad Sci U S A. 2011;108(15):6193–6198. doi: 10.1073/pnas.1017542108. [DOI] [PMC free article] [PubMed] [Google Scholar]
- 19.Schlichting CD, Smith H. Phenotypic plasticity: linking molecular mechanisms with evolutionary outcomes. Evol Ecol. 2002;16(3):189–211. [Google Scholar]
- 20.Pigliucci M. Phenotypic Plasticity. JHU Press; 2001. [Google Scholar]
- 21.Stanton-Geddes J, Nguyen A, Chick L, Vincent J, Vangala M, Dunn RR, Ellison AM, Sanders NJ, Gotelli NJ, Cahan SH. Thermal reactionomes reveal divergent responses to thermal extremes in warm and cool-climate ant species. BMC Genomics. 2016;17(1):171. doi: 10.1186/s12864-016-2466-z. [DOI] [PMC free article] [PubMed] [Google Scholar]
- 22.Chen J, Nolte V, Schlötterer C. Temperature-Related Reaction Norms of Gene Expression: Regulatory Architecture and Functional Implications. Mol Biol Evol. 2015;32(9):2393–2402. doi: 10.1093/molbev/msv120. [DOI] [PMC free article] [PubMed] [Google Scholar]
- 23.Gao L, Geng Y, Yang H, Hu Y, Yang J. Gene Expression Reaction Norms Unravel the Molecular and Cellular Processes Underpinning the Plastic Phenotypes of Alternanthera Philoxeroides in Contrasting Hydrological Conditions. Front Plant Sci. 2015;6:991. doi: 10.3389/fpls.2015.00991. [DOI] [PMC free article] [PubMed] [Google Scholar]
- 24.Aubin-Horth N, Renn SCP. Genomic reaction norms: using integrative biology to understand molecular mechanisms of phenotypic plasticity. Mol Ecol. 2009;18(18):3763–3780. doi: 10.1111/j.1365-294X.2009.04313.x. [DOI] [PubMed] [Google Scholar]
- 25.Pfennig DW, Ehrenreich IM. Towards a gene regulatory network perspective on phenotypic plasticity, genetic accommodation and genetic assimilation. Mol Ecol. 2014;23(18):4438–4440. doi: 10.1111/mec.12887. [DOI] [PMC free article] [PubMed] [Google Scholar]
- 26.Ayroles JF, Carbone MA, Stone EA, Jordan KW, Lyman RF, Magwire MM, Rollmann SM, Duncan LH, Lawrence F, Anholt RRH, et al. Systems genetics of complex traits in Drosophila melanogaster. Nat Genet. 2009;41(3):299–307. doi: 10.1038/ng.332. [DOI] [PMC free article] [PubMed] [Google Scholar]
- 27.Kanehisa M, Araki M, Goto S, Hattori M, Hirakawa M, Itoh M, Katayama T, Kawashima S, Okuda S, Tokimatsu T, et al. KEGG for linking genomes to life and the environment. Nucleic Acids Res. 2007;36:D480–D484. doi: 10.1093/nar/gkm882. Database. [DOI] [PMC free article] [PubMed] [Google Scholar]
- 28.Haynes WA, Higdon R, Stanberry L, Collins D, Kolker E. Differential expression analysis for pathways. PLoS Comput Biol. 2013;9(3):e1002967. doi: 10.1371/journal.pcbi.1002967. [DOI] [PMC free article] [PubMed] [Google Scholar]
- 29.Khatri P, Sirota M, Butte AJ. Ten Years of Pathway Analysis: Current Approaches and Outstanding Challenges. PLoS Comput Biol. 2012;8(2):e1002375. doi: 10.1371/journal.pcbi.1002375. [DOI] [PMC free article] [PubMed] [Google Scholar]
- 30.Lange R, Marshall D. Ecologically relevant levels of multiple, common marine stressors suggest antagonistic effects. Sci Rep. 2017;7(1):6281. doi: 10.1038/s41598-017-06373-y. [DOI] [PMC free article] [PubMed] [Google Scholar]
- 31.Przeslawski R, Byrne M, Mellin C. A review and meta-analysis of the effects of multiple abiotic stressors on marine embryos and larvae. Global Change Biology. 2015;21(6):2122–2140. doi: 10.1111/gcb.12833. [DOI] [PubMed] [Google Scholar]
- 32.Notch EG, Chapline C, Flynn E, Lameyer T, Lowell A, Sato D, Shaw JR, Stanton BA. Mitogen activated protein kinase 14–1 regulates serum glucocorticoid kinase 1 during seawater acclimation in Atlantic killifish, Fundulus heteroclitus. Comparative Biochemistry and Physiology Part A. Comp Biochem Physiol, Part A: Mol Integr Physiol. 2012;162(4):443–448. doi: 10.1016/j.cbpa.2012.04.025. [DOI] [PMC free article] [PubMed] [Google Scholar]
- 33.Jung D, MacIver B, Jackson BP, Barnaby R, Sato JD, Zeidel ML, Shaw JR, Stanton BA. A Novel Aquaporin 3 in Killifish (Fundulus heteroclitus) Is Not An Arsenic Channel. Toxicol Sci. 2012;127(1):101–109. doi: 10.1093/toxsci/kfs078. [DOI] [PMC free article] [PubMed] [Google Scholar]
- 34.Jung D, Sato JD, Shaw JR, Stanton BA. Expression of aquaporin 3 in gills of the Atlantic killifish (Fundulus heteroclitus): Effects of seawater acclimation. Comparative Biochemistry and Physiology Part A. Comp Biochem Physiol, Part A: Mol Integr Physiol. 2012;161(3):320–326. doi: 10.1016/j.cbpa.2011.11.014. [DOI] [PMC free article] [PubMed] [Google Scholar]
- 35.Notch EG, Shaw JR, Coutermarsh BA, Dzioba M, Stanton BA. Morpholino gene knockdown in adult Fundulus heteroclitus: role of SGK1 in seawater acclimation. PLoS One. 2011;6(12):e29462. doi: 10.1371/journal.pone.0029462. [DOI] [PMC free article] [PubMed] [Google Scholar]
- 36.Shaw JR, Bomberger JM, VanderHeide J, LaCasse T, Stanton S, Coutermarsh B, Barnaby R, Stanton BA. Arsenic inhibits SGK1 activation of CFTR Cl-channels in the gill of killifish, Fundulus heteroclitus. Aquat Toxicol. 2010;98(2):157–164. doi: 10.1016/j.aquatox.2010.02.001. [DOI] [PMC free article] [PubMed] [Google Scholar]
- 37.Shaw JR, Sato JD, VanderHeide J, LaCasse T, Stanton CR, Lankowski A, Stanton SE, Chapline C, Coutermarsh B, Barnaby R, et al. The role of SGK and CFTR in acute adaptation to seawater in Fundulus heteroclitus. Cell Physiol Biochem. 2008;22(1–4):69–78. doi: 10.1159/000149784. [DOI] [PubMed] [Google Scholar]
- 38.Shaw JR, Jackson B, Gabor K, Stanton S, Hamilton JW, Stanton BA. The influence of exposure history on arsenic accumulation and toxicity in the killifish, Fundulus heteroclitus. Environ Toxicol Chem. 2007;26(12):2704–2709. doi: 10.1897/07-032.1. [DOI] [PubMed] [Google Scholar]
- 39.Stanton CR, Thibodeau R, Lankowski A, Shaw JR, Hamilton JW, Stanton BA. Arsenic inhibits CFTR-mediated chloride secretion by killifish (Fundulus heteroclitus) opercular membrane. Cell Physiol Biochem. 2006;17(5–6):269–278. doi: 10.1159/000094139. [DOI] [PubMed] [Google Scholar]
- 40.Whitehead A. Comparative mitochondrial genomics within and among species of killifish. BMC Evol Biol. 2009;9(1):11. doi: 10.1186/1471-2148-9-11. [DOI] [PMC free article] [PubMed] [Google Scholar]
- 41.Marshall W, Emberley T, Singer T, Bryson S, Mccormick S. Time course of salinity adaptation in a strongly euryhaline estuarine teleost, fundulus heteroclitus: a multivariable approach. J Exp Biol. 1999;202(Pt 11):1535–1544. doi: 10.1242/jeb.202.11.1535. [DOI] [PubMed] [Google Scholar]
- 42.Schroeder A, Mueller O, Stocker S, Salowsky R, Leiber M, Gassmann M, Lightfoot S, Menzel W, Granzow M, Ragg T. The RIN: an RNA integrity number for assigning integrity values to RNA measurements. BMC Mol Biol. 2006;7(1):3. doi: 10.1186/1471-2199-7-3. [DOI] [PMC free article] [PubMed] [Google Scholar]
- 43.Bolstad BM. PreprocessCore: A Collection of Pre-Processing Functions. 2018 R package version 1.42.0. [Google Scholar]
- 44.Edgar R, Domrachev M, Lash AE. Gene Expression Omnibus: NCBI gene expression and hybridization array data repository. Nucleic Acids Res. 2002;30(1):207–210. doi: 10.1093/nar/30.1.207. [DOI] [PMC free article] [PubMed] [Google Scholar]
- 45.Benjamini Y, statistics, D. Y. A. O. The control of the false discovery rate in multiple testing under dependency. JSTOR. 2001;29(4):1165–1188. 2001. [Google Scholar]
- 46.Pinheiro J, Bates D, DebRoy S, Sarkar D, R Core Team nlme: Linear and Nonlinear Mixed Effects Models. 2018 R package version 3.1-137. [Google Scholar]
- 47.Gao C, Weisman D, Lan J, Gou N, Gu AZ. Toxicity mechanisms identification via gene set enrichment analysis of time-series toxicogenomics data: impact of time and concentration. Environ Sci Technol. 2015;49(7):4618–4626. doi: 10.1021/es505199f. [DOI] [PMC free article] [PubMed] [Google Scholar]
- 48.Gou N, Gu AZ. A new Transcriptional Effect Level Index (TELI) for toxicogenomics-based toxicity assessment. Environ Sci Technol. 2011;45(12):5410–5417. doi: 10.1021/es200455p. [DOI] [PubMed] [Google Scholar]
- 49.Phillips ND. YaRrr! The Pirate’s Guide to R. APS Observer. 2017;30(3) [Google Scholar]
- 50.Marbach D, Prill RJ, Schaffter T, Mattiussi C, Floreano D, Stolovitzky G. Revealing strengths and weaknesses of methods for gene network inference. Proc Natl Acad Sci U S A. 2010;107(14):6286–6291. doi: 10.1073/pnas.0913357107. [DOI] [PMC free article] [PubMed] [Google Scholar]
- 51.Revelle W. Psych: Procedures for Psychological, Psychometric, And Personality Research. Northwestern University; 2014. [Google Scholar]
- 52.Team RCR. A Language and Environment for Statistical Computing. Vienna: R Foundation for Statistical Computing; 2014. version 3.1. 0. http://www.R-project.org. [Google Scholar]
- 53.Wilcox RR. Comparing the variances of dependent groups. Psychometrika. 1989;54(2):305–315. [Google Scholar]
- 54.Li L, Stoeckert CJ, Roos DS. OrthoMCL: identification of ortholog groups for eukaryotic genomes. Genome Res. 2003;13(9):2178–2189. doi: 10.1101/gr.1224503. [DOI] [PMC free article] [PubMed] [Google Scholar]
- 55.Reid NM, Jackson CE, Gilbert D, Minx P, Montague MJ, Hampton TH, Helfrich LW, King BL, Nacci DE, Aluru N, et al. The Landscape of Extreme Genomic Variation in the Highly Adaptable Atlantic Killifish. Genome Biol Evol. 2017;9(3):659–676. doi: 10.1093/gbe/evx023. [DOI] [PMC free article] [PubMed] [Google Scholar]
- 56.Barrett T, Troup DB, Wilhite SE, Ledoux P, Rudnev D, Evangelista C, Kim IF, Soboleva A, Tomashevsky M, Marshall KA, et al. NCBI GEO: archive for high-throughput functional genomic data. Nucleic Acids Res. 2009;37:D885–D890. doi: 10.1093/nar/gkn764. Database. [DOI] [PMC free article] [PubMed] [Google Scholar]
- 57.Oakley RH, Ramamoorthy S, Foley JF, Busada JT, Lu NZ, Cidlowski JA. Glucocorticoid receptor isoform-specific regulation of development, circadian rhythm, and inflammation in mice. FASEB J. 2006 doi: 10.1096/fj.201701153R. fj201701153R.fj.201701153R. [DOI] [PMC free article] [PubMed] [Google Scholar]
- 58.Gosse JA, Hampton TH, Davey JC, Hamilton JW. A New Approach to Analysis and Interpretation of Toxicogenomic Gene Expression Data and its Importance in Examining Biological Responses to Low, Environmentally Relevant Doses of Toxicants. John Wiley & Sons, Ltd; Chichester, UK: 2008. pp. 27–57. [Google Scholar]
- 59.Reid NM, Proestou DA, Clark BW, Warren WC, Colbourne JK, Shaw JR, Karchner SI, Hahn ME, Nacci D, Oleksiak MF, et al. The genomic landscape of rapid repeated evolutionary adaptation to toxic pollution in wild fish. Science. 2016;354(6317):1305–1308. doi: 10.1126/science.aah4993. [DOI] [PMC free article] [PubMed] [Google Scholar]
- 60.Guan Y, Zhang GX, Zhang S, Domangue B, Galvez F. The potential role of polyamines in gill epithelial remodeling during extreme hypoosmotic challenges in the Gulf killifish, Fundulus grandis. Comp Biochem Physiol, Part B: Biochem Mol Biol. 2016;194–195:39–50. doi: 10.1016/j.cbpb.2016.01.003. [DOI] [PubMed] [Google Scholar]
- 61.Whitehead A, Roach JL, Zhang S, Galvez F. Salinity- and population-dependent genome regulatory response during osmotic acclimation in the killifish (Fundulus heteroclitus) gill. J Exp Biol. 2012;215(8):1293–1305. doi: 10.1242/jeb.062075. [DOI] [PubMed] [Google Scholar]
- 62.Carlin DJ, Naujokas MF, Bradham KD, Cowden J, Heacock M, Henry HF, Lee JS, Thomas DJ, Thompson C, Tokar EJ, et al. Arsenic and Environmental Health: State of the Science and Future Research Opportunities. Environ Health Perspect. 2016;124(7):890–899. doi: 10.1289/ehp.1510209. [DOI] [PMC free article] [PubMed] [Google Scholar]
- 63.Eckstein M, Eleazer R, Rea M, Fondufe-Mittendorf Y. Epigenomic reprogramming in inorganic arsenic-mediated gene expression patterns during carcinogenesis. Rev Environ Health. 2017;32(1–2):93–103. doi: 10.1515/reveh-2016-0025. [DOI] [PubMed] [Google Scholar]
- 64.Andrew AS, Karagas MR, Hamilton JW. Decreased DNA repair gene expression among individuals exposed to arsenic in United States drinking water. Int J Cancer. 2003;104(3):263–268. doi: 10.1002/ijc.10968. [DOI] [PubMed] [Google Scholar]
- 65.Konopnicki C, Fujiwara R, Nguyen N, Tukey RH. Oral arsenic exposure induces UGT1A1 expression in neonatal humanized UDP-Glucuronosyltransferase-1 mice through changes in cellular morphology associated cytotoxicity. FASEB J. 2012;26(1 Supplement):850.13–850.13. [Google Scholar]
- 66.Shaw JR, Gabor K, Hand E, Lankowski A, Durant L, Thibodeau R, Stanton CR, Barnaby R, Coutermarsh B, Karlson KH, et al. Role of glucocorticoid receptor in acclimation of killifish (Fundulus heteroclitus) to seawater and effects of arsenic. AJP: Regulatory, Integrative and Comparative Physiology. 2007;292(2):R1052–R1060. doi: 10.1152/ajpregu.00328.2006. [DOI] [PubMed] [Google Scholar]
- 67.Marshall WS, Cozzi RRF, Pelis RM, McCormick SD. Cortisol receptor blockade and seawater adaptation in the euryhaline teleost Fundulus heteroclitus. J Exp Zoolog Part A Comp Exp Biol. 2005;303(2):132–142. doi: 10.1002/jez.a.129. [DOI] [PubMed] [Google Scholar]
- 68.Sokolova IM, Frederich M, Bagwe R, Lannig G, Sukhotin AA. Energy homeostasis as an integrative tool for assessing limits of environmental stress tolerance in aquatic invertebrates. Mar Environ Res. 2012;79:1–15. doi: 10.1016/j.marenvres.2012.04.003. [DOI] [PubMed] [Google Scholar]
- 69.Newton R. Molecular mechanisms of glucocorticoid action: what is important? Thorax. 2000;55(7):603–613. doi: 10.1136/thorax.55.7.603. [DOI] [PMC free article] [PubMed] [Google Scholar]
- 70.Gunderson AR, Armstrong EJ, Stillman JH. Multiple Stressors in a Changing World: The Need for an Improved Perspective on Physiological Responses to the Dynamic Marine Environment. Ann Rev Mar Sci. 2016;8(1):357–378. doi: 10.1146/annurev-marine-122414-033953. [DOI] [PubMed] [Google Scholar]
Associated Data
This section collects any data citations, data availability statements, or supplementary materials included in this article.