

Abstract
Motivation
Annotation of genomic variants is an increasingly important and complex part of the analysis of sequence-based genomic analyses. Computational predictions of variant function are routinely incorporated into gene-based analyses of rare-variants, though to date most studies use limited information for assessing variant function that is often agnostic of the disease being studied.
Results
In this work, we outline an annotation process motivated by the Alzheimer’s Disease Sequencing Project, illustrate the impact of including tissue-specific transcript sets and sources of gene regulatory information and assess the potential impact of changing genomic builds on the annotation process. While these factors only impact a small proportion of total variant annotations (∼5%), they influence the potential analysis of a large fraction of genes (∼25%).
Availability and implementation
Individual variant annotations are available via the NIAGADS GenomicsDB, at https://www.niagads.org/genomics/ tools-and-software/databases/genomics-database. Annotations are also available for bulk download at https://www.niagads.org/datasets. Annotation processing software is available at http://www.icompbio.net/resources/software-and-downloads/.
Supplementary information
Supplementary data are available at Bioinformatics online.
1 Introduction
Multiple large-scale whole-exome (WES) and whole-genome sequencing (WGS) campaigns are currently underway to identify genetic variants that associate to a variety of traits, including studies of schizophrenia (Genovese et al., 2016), type 2 diabetes (Fuchsberger et al., 2016), height (Marouli et al., 2017), myocardial infarction (Do et al., 2015) and others. While the designs and scope of sequencing for these studies vary, previous similar studies have routinely identified millions of genetic variants that were novel (at the time of publication). The targeted sequencing of 82 pharmacogenes using the PGRN-seq platform identified 48.5% novel variants (Bush et al., 2016), and a prior sequencing study of known pharmacogenes reported 90% novel variants (Nelson et al., 2012). The Exome Aggregation Consortium (ExAC), which compiled WES data from multiple studies reported 72% novel variants (Lek et al., 2016), and the UK10K study used WES and reported 57% novel variants (UK10K Consortium et al., 2015). As such, any sequencing-based study will likely report several million variants that are not previously described in the scientific literature. With no published information about these variants available, the genomics community has increasingly relied on computational approaches for predicting variant function (Cingolani et al., 2012; De Baets et al., 2012; Wang et al., 2010; Yourshaw et al., 2015).
A major goal of sequencing studies is to statistically examine the impact of low-frequency genetic variation on a trait of interest. Methods for the assessment of this rare-variant hypothesis now increasingly rely on biological information to group or bin variants together, improving the statistical power to detect an effect. Gene-based burden, collapsing and kernel-based tests are the most commonly applied (Bansal et al., 2010; Lee et al., 2012; Li and Leal, 2008; Liu and Leal, 2010; Madsen and Browning, 2009; Moutsianas et al., 2015; Neale et al., 2011; Price et al., 2010; Sun et al., 2013; Wu et al., 2011). In addition to grouping variants by gene, multiple modifications to this strategy have been proposed that incorporate the predicted impact or consequence of genetic variants on the molecular function of the gene being tested (Ng et al., 2009, 2010; Wu et al., 2011). Because of these technological and analytical advancements, bioinformatic annotation of variant function plays an increasingly critical role in the analysis of whole-genome and whole-exome sequence data.
Prior large-scale sequencing efforts have employed a variety of annotation strategies. The UK10K project (UK10K Consortium et al., 2015) from the Wellcome Trust Sanger Institute is annotated with RSIDs from dbSNP138 (Smigielski, 2000) and functional annotations through the Ensembl Variant Effect Predictor (VEP; version 75) (Yourshaw et al., 2015). The ExAC similarly used VEP (version 81), along with the Loss-of-Function Transcript Effect Estimator (LOFTEE) plugin to evaluate protein-truncating variants. They further annotated variant impact using Polymorphism Phenotyping version 2 (PolyPhen2), Scale-Invariant Feature Transform (SIFT) and Combined Annotation Dependent Depletion (CADD) scores (Adzhubei et al., 2010; Kircher et al., 2014; Kumar et al., 2009). Notably, these studies employed exome sequencing in their design, shifting the annotation focus onto coding variation.
In this work, we describe variant annotation efforts motivated by the Alzheimer’s Disease Sequencing Project (ADSP), a collaborative effort between the National Institutes on Aging and the National Human Genome Research Institute, along with members of the Alzheimer’s disease genetics research community, designed to study the genetics of late-onset Alzheimer’s disease (LOAD). The ADSP discovery-phase datasets consist of 578 individuals from 111 densely affected LOAD families selected for WGS as well as 5778 LOAD cases and 5136 controls selected for WES from the Alzheimer’s Disease Genetics Consortium (ADGC) and the neurology phenotype working group of the Cohorts for Heart and Aging Research in Genomic Epidemiology (CHARGE) consortium (Beecham et al., 2017). Analytical efforts within the ADSP are divided into multiple working groups focused on data flow, quality control (Malamon et al., 2016), structural variant calling, family-based analyses (Ahmad et al., 2016; Beecham et al., 2016; Jaworski et al., 2016), case/control analyses and protective variant analyses. The annotation working group is tasked with providing broad, consistent variant annotation resources for all workgroups, across all datasets and genomic builds, and with specific emphasis on functional effects of variants within AD-related tissues.
To date, most sequencing studies have generated ad hoc, minimal annotation sets, which provide insight into only basic biological function and largely ignores the biological complexity of tissue-specific effects variants may have. Furthermore, on a project-level, there has been no described attempt to generate and maintain a consistent set of comprehensive annotations as a resource for all analyses. In this work, we describe an in silico annotation approach, offering guidance and resources to other ADSP investigators, and providing a common base for testing functional hypotheses in their analyses. We provide a summary of annotated variant consequences, illustrate the impact of using a tissue-specific transcript reference set, examine the annotation impact of including regulatory elements and provide an overview of issues arising from an anticipated transition from build 37 to build 38.
2 Materials and methods
2.1 The Alzheimer’s Disease Sequencing Project and the annotation pipeline
Details of the sample selection criteria and AD phenotyping are described in detail elsewhere (Beecham et al., 2016, 2017). In brief, ∼1400 LOAD families were reviewed for potential inclusion in the project, excluding families with known Mendelian mutations for AD. Families were prioritized based on the number of affected individuals, the number of generations affected, age of onset and absence of apolipoprotein E (APOE) ε4 risk alleles. Cases met the National Institute of Neurological and Communicative Disorders and Stroke—the Alzheimer’s NINCDS-ADRDA (Alzheimer's Disease and Related Disorders Association) criteria for possible, probable or definite AD (McKhann et al., 1984). Case/control samples were selected from a pool of over 30 000 samples under a balanced risk/protection design; cases were selected with low a priori risk (younger and lacking APOE ε4 alleles), and control samples selected based on low rates of expected conversion to AD. Using these two sample sets, the ADSP pursued two complementary sequencing efforts—WGS on multiplex families, and WES on a large dataset of unrelated cases and controls.
Details of the sequencing, capture design and quality control procedures for the ADSP data are described elsewhere (Malamon et al., 2016) and here described briefly. Extracted genomic DNA was sent to one of three Large-Scale Sequencing and Analysis Centers for sequencing using Illumina WGS technology, the Broad Institute Genomics Service (Broad), the Baylor College of Medicine Human Genome Sequencing Center (Baylor) or the McDonnell Genome Institute at the Washington University in St. Louis (WashU). Resulting sequence reads were aligned to GRCh37 1000 Genomes reference (human_g1k_v37.fasta.gz within GATK resources) and genotype calling of both bi-allelic single nucleotide variants (SNVs) and insertion–deletion variants (indels) was performed centrally on the entire sample set using GATK-HaplotypeCaller and Atlas V2. The ADSP QC working group then applied pipeline-specific variant-level and sample-level quality control criteria, and a consensus call set was generated by including high-certainty genotype calls that were identical across the two calling pipelines. Multiple algorithms are also being applied to call structural variants from WGS data. As the ADSP progresses to the replication phase, sequencing centers are shifting their sequencing and alignment protocols to use GRCh38.
A visual overview of the ADSP annotation pipeline is shown in Figure 1. Variants (SNVs) are first annotated to all Ensembl transcripts, producing multiple possible functional consequence predictions per variant. Variant consequences are then ranked by a custom ranking process based on Ensembl’s severity ranking, but that up-weights consequences of protein-coding transcripts (to produce an overall most-damaging consequence per gene for each variant) relative to non-coding or nonsense mediated decay transcripts. We also produce rankings using tissue-specific transcripts based on RNA-sequencing isoform data (to produce a tissue-specific most-damaging consequence per gene for each variant). These variant annotations are released as flat-files allowing one variant to have multiple annotated consequences. Attributes that are specific to a single variant agnostic of transcript information, such as external allele frequency data, variant scores etc. are generated and stored as a single flat annotation (with one entry per variant). While the primary unit of analysis for ADSPs is currently SNVs, structural variants of various sizes are also being called for analysis and are processed by our annotation pipeline with some limitations [SPIDEX™ and Contextual Analysis of TF Occupancy (CATO) scores are not available for structural variants].
Fig. 1.
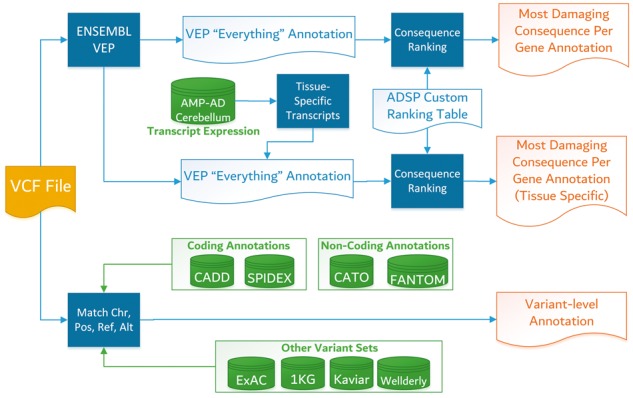
Overview of ADSP annotation pipeline. The process begins with VCF input (left). Solid square items represent pipeline workflow processes, cylinder items are external data sources, and open items are intermediate files or outputs (right)
2.2 Comparisons to other variant sets
For the purposes of both validating variant calling, and to annotate known variants with additional frequency information, we accessed multiple sources of allele frequency information. We report minor allele frequencies (MAF) for variants called within two major genotyping projects, the 1000 Genomes Project (Abecasis et al., 2012) [including AFR (African), AMR (American), ASN (Asian) and EUR (European) populations] and the NHLBI-ESP [AA (African-American) and EA (European-American) populations]. Together, these two sources reflect exome variation and low coverage sequencing of the remainder of the genome. We also included variant information from the ExAC representing exome variants called from ∼60 000 samples.
We accessed additional variant allele frequencies from the Known Variants (Kaviar) database (Glusman et al., 2011), comprised of SNVs, small insertions and deletions, and complex variants discovered in humans. It contains 162 million SNV sites, of which 25 million were not reported in dbSNP, and data from 35 projects spanning 77 781 individuals (13.2 K whole genome, 64.6 K exome). The database also includes 50 million short indels and substitutions from a subset of the data sources. Kaviar excludes cancer genomes but includes some data from cell lines and individuals affected by disease.
Given the importance of age on AD phenotypes, we also accessed WGS data from the Wellderly study (Erikson et al., 2016). The Wellderly study investigates a cohort of elderly individuals with an age range of 80–105 years and who have no diagnosed chronic medical diseases. Using genomic sequencing, the whole genomes of 600 participants were analyzed and correlated with genetic data collected by Inova Translational Medicine Institute (ITMI) from 1507 adults, representing the general population.
2.3 Variant consequence prediction and tissue-specific consequences
The starting point of our annotation strategy, VEP (Yourshaw et al., 2015), overlays variant positions with extensive resources from the Ensembl database, and algorithmically assigns a predicted consequence to a variant based on where it falls with genes, transcripts and protein sequence, and further assigns a Sequence Ontology (SO) term (Mungall et al., 2002) for every variant consequence. Variant consequences are reported with respect to each transcript and protein within the Ensembl database, meaning that a single variant can have multiple consequences, relative to the multiple distinct transcripts it affects. Additional identifiers are reported from various data sources, including from dbSNP (Smigielski, 2000), consensus coding sequence (CCDS) (Pruitt et al., 2009), Uniprot (Magrane and Consortium, 2011) and HGVS (den Dunnen et al., 2016).
Because multiple variant consequences are reported for each transcript/protein affected by a variant, Ensembl VEP provides an option (‘–per_gene’) to generate a ‘most damaging consequence’ for each gene–variant relationship. Using this option, when a variant overlaps multiple possible transcripts for a gene, the consequences are ranked according to multiple criteria within the VEP logic, including the canonical status of the transcript, an Ensembl estimate of transcript support level, the biological type of transcript (preferring protein-coding transcripts) and translated transcript length.
For the specific purposes of ADSP analyses, we constructed a custom ranking table (Supplementary Table S1) that down-weights transcripts undergoing nonsense mediated decay and RNA-based transcripts. Using this approach, we generate both full variant annotation and a ‘most damaging consequence’ annotation. To provide a tissue-specific set of variant annotations, we accessed RNA-seq based transcript expression data from a study of 276 samples of temporal cortex and 275 samples of cerebellum (Allen et al., 2016), generated as part of the Accelerating Medicines Partnership for Alzheimer’s Disease (AMP-AD). Normalized transcripts were accessed from the AMP-AD Portal (AMPAD Knowledge Portal, 2016; Hodes and Buckholtz, 2016). Based on prior assessments of RNA-seq data (Hebenstreit et al., 2011), transcripts were considered ‘highly expressed’ within a tissue if the average normalized transcript count >1 (corresponding to log2 > 0).
2.4 Additional annotations for coding variants
VEP also provides SIFT and PolyPhen predictions for each variant. These scores assess the impact of amino acid substitution based on sequence homology and the physical properties of amino acids (Kumar et al., 2009) and impact on structure and function of a human protein (Adzhubei et al., 2010). We also employ external scoring metrics including CADD (Kircher et al., 2014) and SPIDEX (Xiong et al., 2015). These metrics gauge how damaging a variant might be, and thus whether the variant would be a potential candidate for subsequent investigation.
The CADD score (Kircher et al., 2014) evaluates the deleteriousness of SNVs as well as indels in the human genome. CADD is based on allelic diversity, pathogenicity of both coding and non-coding variants, experimentally measured regulatory effects, and quantitatively prioritizes variants across a wide range of functional categories, effect sizes and genetic architectures. While CADD was designed to provide uniform variant pathogenicity scoring across both coding and non-coding regions, some comparisons indicate that CADD may be best suited for scoring coding variants (Shihab et al., 2015). CADD also relies on evolutionary conservation as a predictive feature, and it is unclear the extent to which risk alleles for a late-onset condition like AD will be conserved. The CADD score is presented on a PHRED-based scale, with scores from 0 to 20 generally considered as non-deleterious and scores >20 generally considered as deleterious, with an accuracy of above 99.0% (the variant is amongst the top 1% of deleterious variants).
SPIDEX (Xiong et al., 2015) assesses whether a SNV causes a dysregulation of a splicing event. The score covers all synonymous, missense and nonsense exonic SNVs, as well as intronic SNVs that are in proximity of splice junctions. It evaluates exons on RefSeq transcripts for predefined features and uses a prediction model to infer whether the exon was spliced into the transcript given the reference genome and the given variant with respect to 16 human tissues. The SPIDEX scores exhibit substantial predictive performance, especially for deleterious mutations, such as intronic mutations that are far from splice sites. SPIDEX scores are available as transformed z-scores, with values >3 indicating a high likelihood of splicing.
2.5 Additional annotations for non-coding variants
Unlike coding variants, VEP provides only minimal annotation of non-coding variants, indicating only intron-exon boundaries or overlap with a known regulatory feature, often a sequence motif or epigenetic state. We expanded this set of annotations to include expressed enhancers and predictions of transcription factor occupancy genome-wide.
Using capped analysis of gene expression (CAGE) data, we identified expressed enhancer elements from the FANTOM5 project (Andersson et al., 2014). Elements were used from all available cellular contexts, and were matched (by the most relevant tissue) to expression quantitative trait loci (eQTL) associations from the genotype tissue expression (GTEx) project (Mele et al., 2015) (analysis by tissue v6) to identify enhancer–gene relationships. Because eQTL data were only used to establish a linkage between known enhancer elements and the genes they regulate, we used a nominal significance level (P < 0.05). After compiling data, we identified WGS-based variants that were in or within +/−500 bases from 20 220 enhancer elements and tied these elements to the genes they putatively impact.
We also included CATO scores (Maurano et al., 2015) to provide a recalibrated probability of affecting the binding of any transcription factor. CATO also provides a quantitatively ranked list of transcription factor families where binding might be altered. CATO scores can only be applied to variants in regulatory regions and therefore are only applicable to a specific subset of the ADSP data. CATO scores above 0.1 are generally considered indicative of variants that significantly alter transcription factor binding.
2.6 LiftOver-based annotation
Because of the multi-stage nature of the ADSP, the project data will migrate to build 38 between the discovery and replication phases. This migration will raise many issues, most imminently, how to compare statistical results from the discovery phase (build 37) to those of the replication phase (build 38). Variants mapped within build 37 were transitioned to build 38 using LiftOver, part of the UCSC Genome Browser toolset (Karolchik et al., 2007). For known variants (those with RSIDs), the resulting LiftOver build 38 coordinates were compared to the build 38 coordinates from the Ensembl Variant database (version 80), which were mapped to build 38 using the Ensembl pipeline.
Variants called by the ADSP QC working group were assigned unique variant identifiers consisting of chromosome, position, reference allele, alternate allele and genomic build. Additional variant identifiers (such as reference sequence RS numbers) are assigned as part of our annotation process from external data sources, including Ensembl (version 80) and dbSNP (build 144). To facilitate the comparison of statistical results and to support annotation-based replication analyses, we have also constructed a single unique variant index to identify variants in a build-agnostic manner.
3 Results
3.1 Allelic discovery in the ADSP
At the completion of the Discovery Phase of the ADSP, a total of 578 individuals from 111 families were whole-genome sequenced, and 10 913 unrelated cases and controls were whole-exome sequenced. An overview of variant annotations and frequencies is shown in Table 1. Following QC, WGS generated 27 896 774 called variants, with just over 5 million novel variants (18.16%) not previously reported by dbSNP (b144) or ExAC (v0.3). The majority of variants (84%) are annotated as intronic or intergenic. Based on Ensembl VEP, variants were annotated to an average of 3.5 features, including transcripts and regulatory motifs. Crude allele frequency estimates (not accounting for family structure) show the majority of identified variants are rare (MAF < 0.01) with ∼25% observed on only one or two chromosomes. Compared to other published studies of exome-sequence variants, we observe a larger number (22.4%) of common variants (MAF > 0.05).
Table 1.
Overview of ADSP variant annotations
| Whole exome (case/control) | Whole genome (family-based) | |||
|---|---|---|---|---|
| Variants called | 1 586 703 | — | 27 896 774 | — |
| Variants annotated | 1 586 703 | — | 27 674 996 | — |
| Variants unannotated | 0 | — | 221 778 | — |
| Variants in ExAC v0.3 | 933 318 | 58.82% | 361 205 | 1.29% |
| Variants in dbSNP | 936 417 | 59.02% | 22 837 563 | 81.86% |
| Variants in ClinVar | 17 860 | 1.13% | 10 960 | 0.04% |
| Variants in Wellderly | 163 733 | 10.31% | 10 304 395 | 36.93% |
| Novel variants | 608 092 | 38.32% | 5 065 664 | 18.16% |
| Average transcripts per variant | 7.75 | — | 3.494 | — |
| AF>0.05 | 35 377 | 2.23% | 6 247 716 | 22.40% |
| 0.01<AF< 0.05 | 20 566 | 1.30% | 4 795 467 | 17.19% |
| Two observations<AF<0.01 | 1 000 280 | 63.04% | 9 187 863 | 32.94% |
| Two observations | 152 770 | 9.63% | 3 554 970 | 12.74% |
| One observation | 377 555 | 23.79% | 4 110 758 | 14.74% |
In contrast, WES revealed 1 586 703 called variants, of which 38.32% were previously unreported. Over all variants, an average of 7.75 transcripts were impacted per variant, illustrating the enrichment of coding variants. The categories of predicted variant consequence are shown relative to the allele frequency spectrum of WES variants in Figure 2. The frequency spectrum of captured variants is heavily shifted toward low-frequency alleles (MAF < 0.01), with only 3.5% of variants having a larger frequency. We observe an expected enrichment for missense and synonymous variants relative to other consequence types. CADD scores are highest on average for stop-gained variants, followed by splicing-associated variants. There is also a notable relative lack of overlap with variants identified in the Wellderly cohort in the WES versus WGS, suggesting a relative lack of coding alleles in this successfully aged cohort.
Fig. 2.
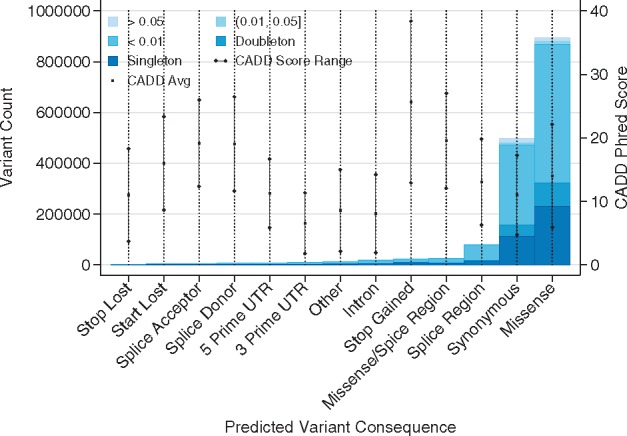
Allele frequency spectrum by variant annotation (whole-exome sequencing). Total variant counts from the ADSP WES case/control dataset are shown by VEP predicted consequence and dataset minor allele frequency (inset legend). CADD score averages (center point) ±1 SD are shown as embedded lines
3.2 Non-coding variant annotation
∼3% of WGS-identified variants are annotated to a regulatory region. Regulatory annotations are shown by variant frequency in Figure 3. VEP reported regulatory consequences for many variants, including 438 461 variants within a CTCF binding site, 295 603 variants within an open chromatin region, 707 302 within predicted enhancer regions, 437 642 within predicted promoter regions, 1 719 607 within predicted promoter flanking regions and 247 701 within transcription factor binding sites. Of these, variants within predicted promoter regions have the highest CADD scores (avg. 7.7, SD 4.98). In contrast, CATO score predictions of transcription factor occupancy are highest in transcription factor binding sites and CTCF binding sites, as expected (avg. 0.05, SD 0.06).
Fig. 3.
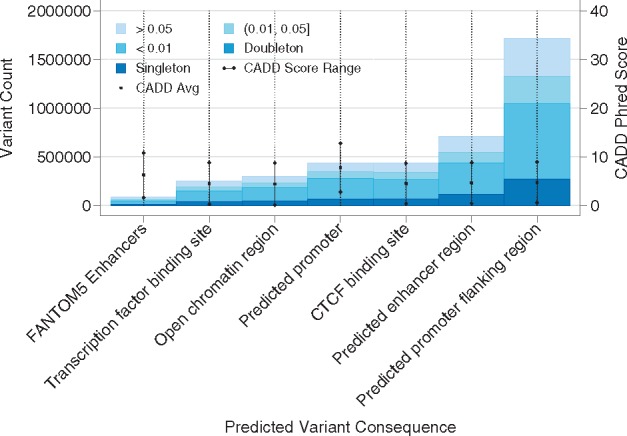
Allele frequency spectrum by regulatory annotation (whole-genome sequencing). Total variant counts from the ADSP WGS family-based dataset are shown by either VEP predicted regulatory consequence or FANTOM5 enhancer annotation, and crude minor allele frequency estimates (inset legend) from the dataset. CADD score averages (center point) ±1 SD are shown as embedded lines
We also expanded our annotation set by including regulatory enhancers identified from FANTOM5 and matched to nearby genes using eQTL from the GTEx) project (Mele et al., 2015). Mapping distant regulatory elements to the genes they regulate provides a biology-based means to include additional variants into a gene unit-based association test. Including FANTOM5-based enhancers, we annotate an additional 86 789 variants from the WGS dataset to 31 351 genes. Variants are an average of 380 KB (SD 298 KB) from the transcription start or end site when they fall outside gene bounds, and add an average of 35 variants to each gene-unit. Variants also have an average CADD score of 6.2 (SD 4.5), and an average CATO score of 0.042 (SD 0.048), showing similar properties to the VEP predicted promoter regions. Of these variants, 1576 have CADD scores >20 (indicating a predicted damaging impact), which likely influence 10 528 genes. In total, 1111 regulatory variants potentially impacting 8375 genes have CATO scores >0.2, indicating a high probability of transcription factor occupancy.
3.3 Tissue-specific transcript reference changes annotations
Given the relevance of brain tissues for AD risk, we examined the impact of selecting brain-specific transcript references on variant annotation. Using both the full transcript reference and a cerebellum-specific transcript reference, we generated a ‘most damaging consequence per gene’ for each variant. With the full Ensembl transcript set, 1 586 703 variants had 2 812 045 predicted consequences ultimately affecting 30 121 genes. In this context, the Ensembl definition of ‘gene’ includes immunoglobulin, RNA-based and pseudo genes.
Restricting annotations to only genes highly expressed in the cerebellum based on RNA-sequencing, we annotate 1 230 598 variants with 1 574 165 predicted consequences affecting 14 312 genes. The RNA-seq dataset notably reduced annotations to mostly (90.8%) protein-coding transcripts. Of variants annotated using both transcript references, 95% of variant annotations were identical, with 63 010 annotations (4%) having a different predicted consequence relative to cerebellum-specific transcripts. Figure 4 illustrates the change in variant consequence relative to total variant annotations. These differences were largely due to alternative splicing, with 27% annotated as intron variants. Most other changes are due to alternate transcription start sites, annotated as upstream gene variants (10.8%) and 5′-UTR variants (4%), and alternate transcription end sites, annotated as downstream gene variants (4.46%) and 3′-UTR variants (8.58%).
Fig. 4.
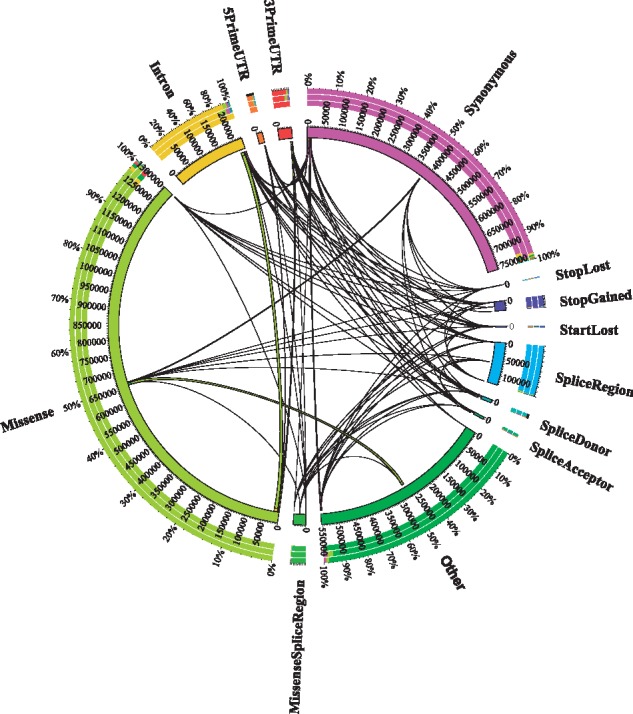
Transitions between WES annotation consequences when using full versus cerebellum-expressed transcript references. The total number of variant consequences from the ADSP WES case/control dataset is shown in the inner ring. Transitions between variant consequences when shifting from the full transcript set to cerebellum-expressed transcripts are shown via internal lines, with proportions shown in the outer ring. For example, the most common transition was from missense to intron due to differential splicing in the cerebellum
Because a likely application of variant annotations is to weight or prioritize variants for gene-based burden tests, we also examined the impact that transcript references have to the collection of consequences by gene. While only 4% of variant annotations are altered when using a cerebellum-based transcript reference, those annotations impact 4490 genes. Of the genes affected, 3973 (88.4%) contained at least one annotation with a different predicted impact on the gene function, indicating that for gene-based tests that use variant impact (such as loss-of-function analyses) may be significantly altered by selecting a tissue-specific transcript reference.
3.4 LiftOver accuracy assessments
We examined the impact of using LiftOver by first quantifying variants that are unmapped by the LiftOver process (only 148 from WES and 3831 from WGS), and by comparing the resulting GRCh38 coordinates for known variants (identified by RSIDs) to those reported in the Ensembl Build 38 database. From the WES data, 15 751 variants (1% of all mapped variants) showed discrepancy between the LiftOver coordinates and the Ensembl coordinates, with an average of 55 808 bases away from the Ensembl position. From the WGS data, this proportion slightly increased with 360 459 variants (1.29%) showing discrepancy with an average of 831 512 bases away from the Ensembl position. As expected from WES data, the majority of these coordinate mismatches affect missense (53.3%) and synonymous (33.58%) variants. Within the WGS data, most variants are intronic (46.63%) and intergenic (29.39%), with a small number of downstream (6.625) and upstream variants (8.72%).
4 Discussion
A growing list of annotation resources are now available for the prioritization and filtering genomic variants. Due to the density of available data, a key hurdle of sequencing projects is to precisely define a priori what annotation resources will be used to test various functional hypotheses within the data. In this paper, we describe a variant annotation pipeline developed for the ADSP, and the resulting annotations for over 30 million distinct variants, over 5 million of which are novel. As expected, the vast majority of variants identified are low-frequency events, with WES of AD cases and controls identifying mostly missense and synonymous variants, and WGS of AD-affected family members identifying intergenic, intronic and regulatory variants. While the general practice in genomic analysis is to assume a single, most-damaging biological consequence per variant, it is important to note that variants have a variety of effects across biological contexts—94% of all annotated WES variants impact two or more transcripts. Due to tissue-specific splicing and expression, this implies that no variant has a singular effect.
As others have noted (Frankish et al., 2015), the choice of transcript reference can have a significant impact on predicted variant consequences, however this work explores changes to the global transcript reference set (Ensembl versus RefSeq). Given the specific relevance of the central nervous system for AD pathogenesis, we explored how tissue-specific splicing changes variant annotation. Restricting annotations to transcripts within tissues of interest (cerebellum and temporal cortex) showed only a modest change to individual variant annotations; however, these changes can have a large impact on the downstream gene-based analyses that use them. With nearly one-fourth of protein-coding genes harboring variants that change their consequence and impact, statistical analyses using tissue-specific annotation could result in dramatically different association test results. Generating a definitive conclusion on what is ‘expressed’ in any given tissue however is difficult, and introduces new algorithm thresholds that may influence the resulting annotation.
Applying regulatory annotations from the FANTOM5 project in conjunction with eQTL data from the GTEx project provides a tissue-specific set of long-range enhancers tied to the genes they potentially regulate. Including these annotations for variants identified in WGS of families extends the traditional concept of gene-based unit tests to include variants within their regulatory elements, adding on average 35 variants to each gene-unit. Average CADD scores for FANTOM5 enhancer elements are increased relative to other regulatory annotations, and incorporating these along with promoter elements should greatly improve the interpretation of regulatory rare-variant hypothesis tests.
Ideally, all annotation resources would be regenerated for GRCh38, however this would require extensive effort to reconstitute the enormous training data resources for prediction algorithms such as CADD. Anticipating the need to use LiftOver for GRCh37-mapped annotation resources, we explored how well LiftOver mapped our own variants into GRCh38 by comparing the coordinates of known variants to the GRCh38 version of Ensembl. While only a fraction of a percentage of variants were unmapped by the LiftOver process, roughly 1% of known variants had discrepant positions between LiftOver and Ensembl. The majority of these were localized to chromosome 6, likely owing to the complexity of the major histocompatibility complex region, but also to chromosomes 15 and 17. These mapping errors were not insignificant, with LiftOver coordinates an average of 50 KB from the reported Ensembl position. This result indicates that while LiftOver is an important stop-gap approach for mapping annotation resources into GRCh38, post-hoc checks for annotation accuracy will be needed to ensure that the biological implications of GRCh38 variants are properly portrayed, and whenever possible, resources constructed based on GRCh38 should be used instead.
All together, we show that annotation is more than ever a critical component of genetic data analysis. Regardless of the annotation strategy employed, it is critical to be aware that variant annotation injects biological assumptions into the statistical analysis of genomic data. Providing a uniform set of annotation resources for all ADSPs will ease comparisons between analyses and informs the interpretation of results.
Funding
A detailed acknowledgment of all funding sources supporting this work is available in the Supplementary Information.
Conflict of Interest: none declared.
Supplementary Material
References
- Abecasis G.R. et al. (2012) An integrated map of genetic variation from 1,092 human genomes. Nature, 491, 56–65. [DOI] [PMC free article] [PubMed] [Google Scholar]
- Adzhubei I.A. et al. (2010) A method and server for predicting damaging missense mutations. Nat. Methods, 7, 248–249. [DOI] [PMC free article] [PubMed] [Google Scholar]
- Ahmad S. et al. (2016) Genome-wide linkage analysis in Dutch families identifies novel candidate genes for Alzheimer’s disease In: 66th Annual Meeting of the American Society of Human Genetics, Vancouver, Canada. Abstract 1379, p. [Google Scholar]
- Allen M. et al. (2016) Human whole genome genotype and transcriptome data for Alzheimer’s and other neurodegenerative diseases. Sci. Data, 3, 160089.. [DOI] [PMC free article] [PubMed] [Google Scholar]
- AMPAD Knowledge Portal (2016) MayoRNAseq - syn5550404.
- Andersson R. et al. (2014) An atlas of active enhancers across human cell types and tissues. Nature, 507, 455–461. [DOI] [PMC free article] [PubMed] [Google Scholar]
- Bansal V. et al. (2010) Statistical analysis strategies for association studies involving rare variants. Nat. Rev. Genet., 11, 773–785. [DOI] [PMC free article] [PubMed] [Google Scholar]
- Beecham G.W. et al. (2016) Whole-genome sequencing in familial late-onset Alzheimer’s disease identifies TTC3 and FSIP2 as putative risk loci In: 66th Annual Meeting of the American Society of Human Genetics, Vancouver, Canada. Abstract 402, p. [Google Scholar]
- Bush W.S. et al. (2016) Genetic variation among 82 pharmacogenes: the PGRNseq data from the eMERGE network. Clin. Pharmacol. Ther., 100, 160–169. [DOI] [PMC free article] [PubMed] [Google Scholar]
- Cingolani P. et al. (2012) A program for annotating and predicting the effects of single nucleotide polymorphisms, SnpEff: sNPs in the genome of Drosophila melanogaster strain w1118; iso-2; iso-3. Fly (Austin), 6, 80–92. [DOI] [PMC free article] [PubMed] [Google Scholar]
- De Baets G. et al. (2012) SNPeffect 4.0: on-line prediction of molecular and structural effects of protein-coding variants. Nucleic Acids Res., 40, D935–D939. [DOI] [PMC free article] [PubMed] [Google Scholar]
- den Dunnen J.T. et al. (2016) HGVS recommendations for the description of sequence variants: 2016 update. Hum. Mutat., 37, 564–569. [DOI] [PubMed] [Google Scholar]
- Do R. et al. (2015) Exome sequencing identifies rare LDLR and APOA5 alleles conferring risk for myocardial infarction. Nature, 518, 102–106. [DOI] [PMC free article] [PubMed] [Google Scholar]
- Erikson G.A. et al. (2016) Whole-genome sequencing of a healthy aging cohort. Cell, 165, 1002–1011. [DOI] [PMC free article] [PubMed] [Google Scholar]
- Frankish A. et al. (2015) Comparison of GENCODE and RefSeq gene annotation and the impact of reference geneset on variant effect prediction. BMC Genomics, 16, S2.. [DOI] [PMC free article] [PubMed] [Google Scholar]
- Fuchsberger C. et al. (2016) The genetic architecture of type 2 diabetes. Nature, 536, 41–47. [DOI] [PMC free article] [PubMed] [Google Scholar]
- Genovese G. et al. (2016) Increased burden of ultra-rare protein-altering variants among 4,877 individuals with schizophrenia. Nat. Neurosci., 19, 1433–1441. [DOI] [PMC free article] [PubMed] [Google Scholar]
- Glusman G. et al. (2011) Kaviar: an accessible system for testing SNV novelty. Bioinformatics, 27, 3216–3217. [DOI] [PMC free article] [PubMed] [Google Scholar]
- Hebenstreit D. et al. (2011) RNA sequencing reveals two major classes of gene expression levels in metazoan cells. Mol. Syst. Biol., 7, 497. [DOI] [PMC free article] [PubMed] [Google Scholar]
- Hodes R.J., Buckholtz N. (2016) Accelerating medicines partnership: Alzheimer’s disease (AMP-AD) knowledge portal aids Alzheimer’s drug discovery through open data sharing. Expert Opin. Ther. Targets, 20, 389–391. [DOI] [PubMed] [Google Scholar]
- Jaworski J. et al. (2016) Coding and non-coding variants in known Alzheimer’s candidate genes co-segregate with Late-Onset Alzheimer’s disease (LOAD) in the Alzheimer Disease Sequencing Project genome sequence data. In: 66th Annual Meeting of the American Society of Human Genetics, Vancouver, Canada. Abstract 399, p. [Google Scholar]
- Karolchik D. et al. (2007) The UCSC Genome Browser Database: 2008 update. Nucleic Acids Res., 36, D773–D779. [DOI] [PMC free article] [PubMed] [Google Scholar]
- Kircher M. et al. (2014) A general framework for estimating the relative pathogenicity of human genetic variants. Nat. Genet., 46, 310–315. [DOI] [PMC free article] [PubMed] [Google Scholar]
- Kumar P. et al. (2009) Predicting the effects of coding non-synonymous variants on protein function using the SIFT algorithm. Nat. Protoc., 4, 1073–1081. [DOI] [PubMed] [Google Scholar]
- Lee S. et al. (2012) Optimal unified approach for rare-variant association testing with application to small-sample case-control whole-exome sequencing studies. Am. J. Hum. Genet., 91, 224–237. [DOI] [PMC free article] [PubMed] [Google Scholar]
- Lek M. et al. (2016) Analysis of protein-coding genetic variation in 60, 706 humans. Nature, 536, 285–291. [DOI] [PMC free article] [PubMed] [Google Scholar]
- Li B., Leal S.M. (2008) Methods for detecting associations with rare variants for common diseases: application to analysis of sequence data. Am. J. Hum. Genet., 83, 311–321. [DOI] [PMC free article] [PubMed] [Google Scholar]
- Liu D.J., Leal S.M. (2010) A novel adaptive method for the analysis of next-generation sequencing data to detect complex trait associations with rare variants due to gene main effects and interactions. PLoS Genet., 6, e1001156.. [DOI] [PMC free article] [PubMed] [Google Scholar]
- Madsen B.E., Browning S.R. (2009) A groupwise association test for rare mutations using a weighted sum statistic. PLoS Genet., 5, e1000384.. [DOI] [PMC free article] [PubMed] [Google Scholar]
- Magrane M., Consortium U. (2011) UniProt Knowledgebase: a hub of integrated protein data. Database (Oxford), 2011, bar009.. [DOI] [PMC free article] [PubMed] [Google Scholar]
- Malamon J. et al. (2016) Post-variant calling quality control (QC) pipeline and multi-pipeline genotype consensus caller for large-scale whole genome and whole exome sequencing studies In: 66th Annual Meeting of the American Society of Human Genetics, Vancouver, Canada. Abstract 1693, p. [Google Scholar]
- Marouli E. et al. (2017) Rare and low-frequency coding variants alter human adult height. Nature, 542, 186–190. [DOI] [PMC free article] [PubMed] [Google Scholar]
- Maurano M.T. et al. (2015) Large-scale identification of sequence variants influencing human transcription factor occupancy in vivo. Nat. Genet., 47, 1393–1401. [DOI] [PMC free article] [PubMed] [Google Scholar]
- McKhann G. et al. (1984) Clinical diagnosis of Alzheimer’s disease: report of the NINCDS-ADRDA Work Group under the auspices of Department of Health and Human Services Task Force on Alzheimer’s Disease. Neurology, 34, 939–944. [DOI] [PubMed] [Google Scholar]
- Mele M. et al. (2015) The human transcriptome across tissues and individuals. Science, 348, 660–665. [DOI] [PMC free article] [PubMed] [Google Scholar]
- Moutsianas L. et al. (2015) The power of gene-based rare variant methods to detect disease-associated variation and test hypotheses about complex disease. PLoS Genet., 11, e1005165.. [DOI] [PMC free article] [PubMed] [Google Scholar]
- Mungall C. et al. (2002) The Sequence Ontology: a tool for the unification of genome annotations. Genome Biol., 3, research0081.1. [DOI] [PMC free article] [PubMed] [Google Scholar]
- Neale B.M. et al. (2011) Testing for an unusual distribution of rare variants. PLoS Genet., 7, e1001322.. [DOI] [PMC free article] [PubMed] [Google Scholar]
- Nelson M.R. et al. (2012) An abundance of rare functional variants in 202 drug target genes sequenced in 14,002 people. Science, 337, 100–104. [DOI] [PMC free article] [PubMed] [Google Scholar]
- Ng S.B. et al. (2009) Targeted capture and massively parallel sequencing of 12 human exomes. Nature, 461, 272–276. [DOI] [PMC free article] [PubMed] [Google Scholar]
- Ng S.B. et al. (2010) Exome sequencing identifies the cause of a Mendelian disorder. Nat. Genet., 42, 30–35. [DOI] [PMC free article] [PubMed] [Google Scholar]
- Price A.L. et al. (2010) Pooled association tests for rare variants in exon-resequencing studies. Am. J. Hum. Genet., 86, 832–838. [DOI] [PMC free article] [PubMed] [Google Scholar]
- Pruitt K.D. et al. (2009) The consensus coding sequence (CCDS) project: identifying a common protein-coding gene set for the human and mouse genomes. Genome Res., 19, 1316–1323. [DOI] [PMC free article] [PubMed] [Google Scholar]
- Shihab H.A. et al. (2015) An integrative approach to predicting the functional effects of non-coding and coding sequence variation. Bioinformatics, 31, 1536–1543. [DOI] [PMC free article] [PubMed] [Google Scholar]
- Smigielski E.M. et al. (2000) dbSNP: a database of single nucleotide polymorphisms. Nucleic Acids Res., 28, 352–355. [DOI] [PMC free article] [PubMed] [Google Scholar]
- Sun J. et al. (2013) A unified mixed-effects model for rare-variant association in sequencing studies. Genet. Epidemiol., 37, 334–344. [DOI] [PMC free article] [PubMed] [Google Scholar]
- UK10K Consortium K. et al. (2015) The UK10K project identifies rare variants in health and disease. Nature, 526, 82–90. [DOI] [PMC free article] [PubMed] [Google Scholar]
- Wang K. et al. (2010) ANNOVAR: functional annotation of genetic variants from high-throughput sequencing data. Nucleic Acids Res., 38, e164–e164. [DOI] [PMC free article] [PubMed] [Google Scholar]
- Wu M.C. et al. (2011) Rare-variant association testing for sequencing data with the sequence kernel association test. Am. J. Hum. Genet., 89, 82–93. [DOI] [PMC free article] [PubMed] [Google Scholar]
- Xiong H.Y. et al. (2015) RNA splicing. The human splicing code reveals new insights into the genetic determinants of disease. Science, 347, 1254806. [DOI] [PMC free article] [PubMed] [Google Scholar]
- Yourshaw M. et al. (2015) Rich annotation of DNA sequencing variants by leveraging the Ensembl Variant Effect Predictor with plugins. Brief. Bioinform., 16, 255–264. [DOI] [PMC free article] [PubMed] [Google Scholar]
Associated Data
This section collects any data citations, data availability statements, or supplementary materials included in this article.