

Abstract
Motivation
The three-dimensional organization of chromatin plays a critical role in gene regulation and disease. High-throughput chromosome conformation capture experiments such as Hi-C are used to obtain genome-wide maps of three-dimensional chromatin contacts. However, robust estimation of data quality and systematic comparison of these contact maps is challenging due to the multi-scale, hierarchical structure of chromatin contacts and the resulting properties of experimental noise in the data. Measuring concordance of contact maps is important for assessing reproducibility of replicate experiments and for modeling variation between different cellular contexts.
Results
We introduce a concordance measure called DIfferences between Smoothed COntact maps (GenomeDISCO) for assessing the similarity of a pair of contact maps obtained from chromosome conformation capture experiments. The key idea is to smooth contact maps using random walks on the contact map graph, before estimating concordance. We use simulated datasets to benchmark GenomeDISCO's sensitivity to different types of noise that affect chromatin contact maps. When applied to a large collection of Hi-C datasets, GenomeDISCO accurately distinguishes biological replicates from samples obtained from different cell types. GenomeDISCO also generalizes to other chromosome conformation capture assays, such as HiChIP.
Availability and implementation
Software implementing GenomeDISCO is available at https://github.com/kundajelab/genomedisco.
Supplementary information
Supplementary data are available at Bioinformatics online.
1 Introduction
The three-dimensional (3D) conformation of chromatin defines a network of physical interactions among genomic loci, including regulatory elements such as gene promoters, distal enhancers and insulators (Krijger and de Laat, 2016). Thus, 3D chromatin architecture plays a key role in gene regulation and cellular function. Changes in 3D chromatin architecture at multiple scales, ranging from large-scale rearrangement of compartments and topologically associating domains (TADs) to rewiring of enhancer–promoter interactions, are associated with dynamic cellular processes such as differentiation (Dixon et al., 2015; Fraser et al., 2015) and reprogramming (Beagan et al., 2016; Krijger and de Laat, 2016), as well as disease (Gröschel et al., 2014; Lupiáñez et al., 2015).
The last decade has witnessed a revolution in high-throughput sequencing-based assays and imaging techniques to map 3D chromatin architecture at multiple scales and resolutions, providing new insights into spatial genome organization (Schmitt et al., 2016). The sequencing-based methods (referred to as 3C-seq experiments) for assaying 3D chromatin architecture, such as 3C (Dekker et al., 2002), 4C (Simonis et al., 2006; Zhao et al., 2006), 5C (Dostie et al., 2006), Hi-C (Lieberman-Aiden et al., 2009), Capture Hi-C (Mifsud et al., 2015), ChIA-PET (Fullwood et al., 2009) and HiChIP (Mumbach et al., 2016), are all variations of the chromosome conformation capture technique. In a Hi-C experiment, genome-wide interactions are mapped by ligating proximal fragments followed by deep sequencing. The result of such an experiment is a genome-wide contact map, which is a matrix with a sequencing readout of the contact frequency for every pair of genomic loci.
A number of computational methods have been designed to normalize (Hu et al., 2012; Imakaev et al., 2012; Knight and Ruiz, 2013; Servant et al., 2015; Yaffe and Tanay, 2011) and extract statistically significant contacts from the different types of 3D chromatin conformation assays (Ay et al., 2014; Cairns et al., 2016; Carty et al., 2017; Mifsud et al., 2017; Ron et al., 2017). However, principled methods for systematic comparisons of 3D contact maps are equally important and form a core component of two key analyses. First, as an essential quality control tool, it is useful to quantify the concordance of replicate experiments. This is particularly relevant because it is a common practice to pool reads across biological replicates of a 3C-seq experiment before downstream analyses. Significant differences between the pooled replicates could result in suboptimal or misleading downstream results. Second, understanding and quantifying similarity between replicates is also an essential step in differential analysis, where the goal is to reliably identify statistically significant differences between contact maps in different biological conditions. Differences between conditions can only be trusted if they exceed the differences between biological replicates.
Experimentally derived contact maps exhibit certain properties that are distinct from other types of functional genomic data. First, contact maps explicitly encode the adjacency matrix of a multi-scale, modular network consisting of large-scale compartments, TADs, CTCF/cohesin mediated loops and potentially transient interactions between other types of elements (Schmitt et al., 2016). Second, the contact frequency between a pair of loci is strongly dependent on their linear genomic distance (Ay et al., 2014; Dekker et al., 2002; Duan et al., 2010) and affected by additional biases such as restriction fragment size, GC content and mappability (Cournac et al., 2012; Hu et al., 2012; Imakaev et al., 2012; Schmitt et al., 2016; Yaffe and Tanay, 2011). Third, the resolution of a contact map defined in terms of the size (in nucleotides) of the interacting loci is often a free parameter and heuristically determined based on the depth of sequencing (Rao et al., 2014). Finally, the noise associated with estimates of contact frequencies is also strongly associated with sequencing depth. These properties necessitate the development of new computational methods specifically suited for analysis of Hi-C data.
Statistical measures that have been developed to quantify the reproducibility of one-dimensional functional genomics assays, such as ChIP-seq, DNA methylation and RNA sequencing, cannot be trivially applied to 3D contact maps. For instance, simple correlation measures, which are most frequently used as measures of reproducibility (Rao et al., 2014), do not correctly capture the reproducibility of Hi-C data (Yang et al., 2017; Yardımcı et al., 2017). This is partly because these simple correlation measures consider each entry in a contact map as an independent measurement, thereby ignoring the rich connectivity and dependence structure in 3D contact maps. More sophisticated reproducibility measures have recently been introduced including comparison of eigenvectors (Yan et al., 2017) and a stratified correlation coefficient (Yang et al., 2017) and these methods alleviate many of the problems with traditional correlation.
In this work, we introduce DIfferences between Smoothed COntact maps (GenomeDISCO), a computational framework for quantifying reproducibility or concordance of contact maps from 3C-seq experiments. We represent a contact map as a network or graph, where nodes are genomic loci and edges are weighted proportional to appropriately normalized contact frequency between a pair of loci (nodes). We denoise the contact maps using random walks on the graph, followed by comparison of the resulting smoothed contact maps. We use systematic simulations to calibrate the method, showing its ability to detect artificially introduced noise, differences in distance dependence curves and differences in structural properties of contact maps. We then apply GenomeDISCO and other related approaches to the largest existing collection of Hi-C experiments (Rao et al., 2014) and benchmark their performance on a comparison of replicate experiments and experiments from different cell types. We also show that GenomeDISCO easily generalizes to other types of 3C-seq assays, such as HiChIP. We provide an efficient implementation of our method as well as comprehensive analysis reports and visualizations in a user-friendly software package at https://github.com/kundajelab/genomedisco. GenomeDISCO is also included in the 3D genome analysis suite recommended by the encyclopedia of DNA Elements consortium at https://github.com/kundajelab/3DChromatin_ReplicateQC (Yardımcı et al., 2017).
2 Materials and methods
2.1 A graph representation of chromatin contact maps
We represent a contact map as a graph or network of interactions between genomic loci, with adjacency matrix . Each node in the network is a genomic locus (segment) of a specified resolution or size (in nucleotides). The weight of each edge is a normalized, experimentally derived contact frequency between a pair of nodes and . In this work, we normalize the contact map using the sqrtvc normalization (for additional discussion of normalization methods compatible with GenomeDISCO, refer to the Supplementary Methods) and convert it to a transition probability matrix, such that all rows sum to 1. This transition matrix is the weighted adjacency matrix A used in the analyses in this study. We ignore interchromosomal interactions and hence represent all chromosomes as independent graphs.
2.2 Motivation for our concordance score
A concordance score that aims to estimate the global similarity between a pair of contact maps must account for the specific properties of experimentally derived contact maps. First, contact maps contain structural features that manifest at different scales, such as large-scale compartments, sub-Mb scale TADs and sub-TADs that manifest as densely connected diagonal blocks and CTCF/cohesin mediated loops observed as focal points of enriched contacts. Thus, an ideal concordance score would be able to measure similarity across multiple scales. Second, genome-wide contact maps such as those from Hi-C experiments measure a very large space of possible contacts and hence require deep sequencing (> billion reads) for reliable estimates of contact frequency. Due to cost and material constraints, typical Hi-C datasets are sequenced at significantly lower coverage [e.g. 100 M reads (Lajoie et al., 2015)]. These undersampled datasets exhibit a large proportion of contacts with low observed counts with high variance (Carty et al., 2017) including some contacts with 0 observed counts, a phenomenon known as stochastic dropout. To address this issue, we propose a denoising approach to smooth contact maps by leveraging random walks on the contact map graph, before comparing these maps.
2.3 The GenomeDISCO score for estimating the concordance of contact maps
We estimate concordance between a pair of chromatin contact maps, and , as follows (Fig. 1A).
Fig. 1.
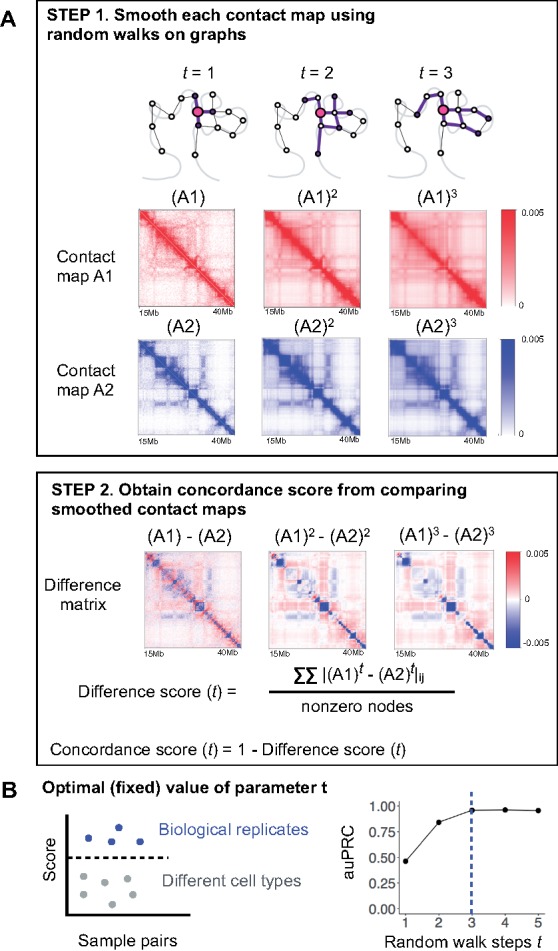
Overview of GenomeDISCO. (A) GenomeDISCO consists of two steps. The first step in comparing two contact maps, and , consists of smoothing each contact map using random walks. Depicted are the smoothed contact maps, at different levels of smoothing controlled by the parameter , which specifies the number of steps of random walk used for denoising. The second step consists of computing a difference score between the smoothed contact maps, as a function of . (B) Procedure for identifying the optimal value for . We computed concordance scores for pairs of samples that are either biological replicates from the same cell type or pairs of samples from different cell types. We assume that the optimal value of will produce scores that can accurately classify pairs of samples into ‘biological replicates’ and ‘different cell types’. For each value of , we measure classification performance using the auPRC, finding =3 to be optimal
2.3.1 Equalizing sequencing depth
To avoid artificial differences due to sequencing depth (see Supplementary Fig. S2), we first equalize the sequencing depth of the pair of datasets to be compared by randomly subsampling the count matrix to the minimum depth of the two datasets.
2.3.2 Denoising contact maps using random walks
We denoise each contact map independently using random walks on the contact maps. For every pair of nodes and in a contact map, we ask the question: if we start a random walk at node based on the observed contact map transition probability matrix and allow the walk to take steps, what is the probability we will reach node ? If there are many high-probability paths in the network that connect node and node , it increases our confidence that nodes and are in contact. The probability of reaching node after a random walk of steps starting from node is the th entry of the matrix obtained by multiplying the transition probability matrix with itself times, i.e. . We define the optimal value for the steps parameter for Hi-C data, as the one that maximizes the ability of the concordance score to distinguish between biological replicates and non-replicate reference datasets (See Section 2.4 for details).
2.3.3 Computing the difference between denoised contact maps
The denoised versions of contact maps and , after steps of random walk are and , respectively. We compute the difference between A1 and A2 as the L1 distance between the two denoised contact maps and , divided by the average number of non-zero nodes in the two original contact maps and :
Since each row of and sums to 1, the weighted degree (sum of weights of all edges to/from a node) of each node is 1. Hence, scores range from 0 to 2, with small values indicating high similarity.
2.3.4 Converting the difference to a concordance score
We define the concordance score as . The concordance scores range from −1 to 1, with larger values indicating greater similarity. We obtain a single genome-wide score as the average of the scores across all chromosomes.
2.4 Estimating the optimal number of random walk steps ()
The number of steps of the random walk on the contact map graph determines the amount of smoothing or denoising of a contact map. We define an optimal value of as one that would provide sufficient denoising so as to improve concordance between contact maps of replicate experiments while preserving differences between contact maps from distinct cellular contexts. We used a collection of high quality benchmark Hi-C datasets with replicate experiments from diverse human cell-lines (Rao et al., 2014) to optimize . Using half the experiments as a training set and the remaining half as a test set, we asked which value of leads to the optimal separation of biological replicates from non-replicate samples, as measured with the area under the precision-recall curve (auPRC). We found achieved the best performance on the training set (auPRC of 0.95, Fig. 1B), associated with an auPRC of 0.92 on the test set. The optimal value of identified using reference Hi-C datasets generalized to HiChIP data (see Fig. 4) and to Hi-C datasets from other species such as Drosophila [see (Yardımcı et al., 2017)]. It is possible that for other applications of GenomeDISCO, other values of may be optimal. In such cases, we suggest users perform a similar calibration experiment to identify the optimal value.
Fig. 4.
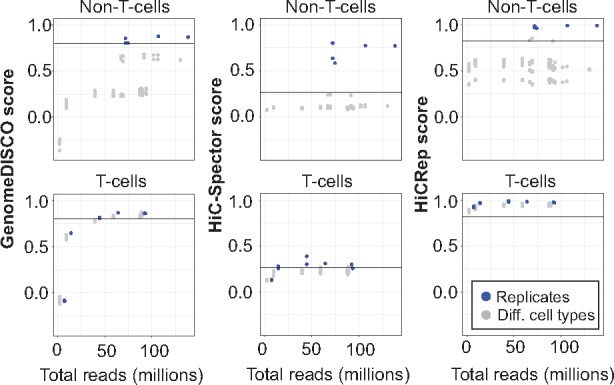
GenomeDISCO benchmarks on HiChIP data. A) Scores obtained on HiChIP data for GenomeDISCO, HiC-Spector and HiCRep. The scores are split into two categories: comparisons between T-cells and the remaining comparisons (labeled as “Non T-cells”). Scores of replicates are plotted offset by 5 million reads, to improve visibility of points that would otherwise overlap
3 Results
3.1 Benchmarking GenomeDISCO on simulated perturbations to 3C-seq datasets
We expect an effective concordance score for 3C-seq datasets to be sensitive to key types of noise and artifacts that typically affect these data (Supplementary Fig. S1).
We benchmarked the behavior of GenomeDISCO using it to compute concordance between a reference Hi-C contact map and a version of the map that is explicitly perturbed with different types and levels of simulated noise (See Supplementary Methods). We performed our analyses at 50 kb resolution, as this is a resolution frequently used in the analysis of Hi-C datasets. We compared GenomeDISCO to two other recently developed methods for estimating concordance of Hi-C data: HiCRep, which measures correlation of contacts stratified by distance (Yang et al., 2017), and HiC-Spector, which computes an eigendecomposition of the Laplacian of the graph, and then compares the L2 distance between eigenvectors of the two contact maps (Yan et al., 2017).
We examined the sensitivity of the concordance scores to perturbations that involve random dropout of edges and nodes as well as misalignment of domain boundaries in the perturbed contact map relative to the reference. Indeed, we found that concordance scores from all three methods decrease with increasing edge drop out (Fig. 2A), increasing node drop out (Fig. 2B) and increasing domain boundary misalignment (Fig. 2C, see Supplementary Methods).
Fig. 2.
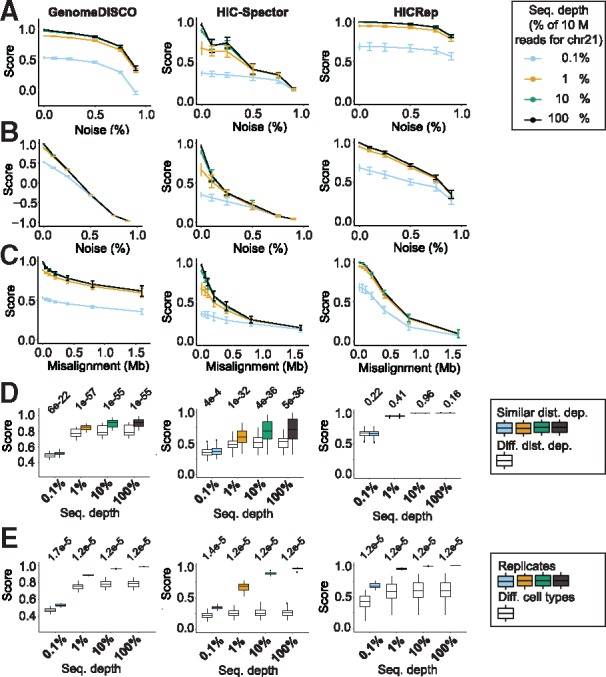
GenomeDISCO exhibits desired features for a reproducibility score. (A–D) Scores as a function of edge dropout (A), node dropout (B), domain boundary misalignment (C) and difference in distance dependence curves (D) for GenomeDISCO, HiC-Spector and HiCRep methods. (A)–(C) Error bars represent 1 SD from the mean score based on independent simulations across all cell types profiled in the work of Rao et al. (2014). (D) We split pairs of samples into ‘similar distance dependence’ and ‘different distance dependence’ using a threshold of 0.005 Jensen–Shannon divergence between the curves of the samples compared (see Supplementary Methods). (E) Results on simulations comparing replicates with non-replicates obtained from different cell types. (D) and (E) Values above the plots are P-values of a Mann-Whitney U test
Next, in order to understand the effect of sequencing depth of the contact maps, we repeated the above three perturbation analyses for reference and perturbed maps subsampled to four depths: 100, 10, 1, 0.1% of 10 million reads restricted to chromosome 21. As expected, we found that the GenomeDISCO score was the highest for the most deeply sequenced samples. Concordance scores dropped consistently with decreasing sequencing depth across all types and levels of perturbations (Fig. 2). The scores were found to plateau as the sequencing depth increased from 1 million to 10 million reads, which is expected since for a 50 kb resolution, one would need ∼0.8 million reads for chr21 (see Supplementary Methods).
Contact maps can also differ in their fundamental distance dependence curves that capture the probability of contact as a function of linear genomic distance. Distance dependence curves have been found to change due to cell cycle stage (Naumova et al., 2013; Nagano et al., 2017) or as a function of perturbation of proteins involved in chromatin 3D architecture, such as RAD21 knockout in yeast (Mizuguchi et al., 2014) or WAPL and SCC4 knockouts in human HAP1 cells (Haarhuis et al., 2017). Replicates from the same condition are often pooled, and if they have different distance dependence curves, the result will be an average that is not representative of either replicate. Hence, being sensitive to differences in distance dependence curves is a useful property of a concordance score.
We simulated pairs of contact maps from a common reference contact map by sampling reads according to two different distance dependence curves, obtained from Hi-C maps from pairs of different cell types (see Supplementary Methods). We split the pairs of contact maps into pairs with similar distance dependence curves and pairs with different curves (see Supplementary Methods) and compared the scores we obtained at different sequencing depths (as above) using all three methods. GenomeDISCO samples with different distance dependence curves obtain lower concordance scores. As in the other simulations, the margin between the two sets of pairs decreased as we decreased sequencing depth (Fig. 2D). HiC-Spector was also sensitive to differences in distance dependence curves, while HiCRep was not. GenomeDISCO had the best margins of separation at lower sequencing depths.
Finally, we asked whether pairs of simulated pseudo-replicates sampled from the same reference Hi-C map would be deemed more concordant than pairs of samples from different cell types. All three methods successfully discriminated the two sets of pairs with margins decreasing with decreasing sequencing depth (Fig. 2E).
3.2 Benchmarking GenomeDISCO on Hi-C datasets
We used more than 80 high quality Hi-C datasets from (Rao et al., 2014) spanning multiple human cell-lines (GM12878, HMEC, HUVEC, IMR90, K562, KBM7 and NHEK) to benchmark the behavior of our concordance score (Fig. 3, Supplementary Tables S1 and S2). Due to the lack of explicit ground truth about the nature of noise in real datasets, we evaluate the validity of the concordance score by expecting higher scores when comparing pairs of biological replicates of Hi-C data with similar distance-dependence characteristics as compared to scores obtained by comparing Hi-C datasets from different cell types. We focused our analysis on a subset of experiments defined as those done with in-situ Hi-C (see Supplementary Table S2).
Fig. 3.
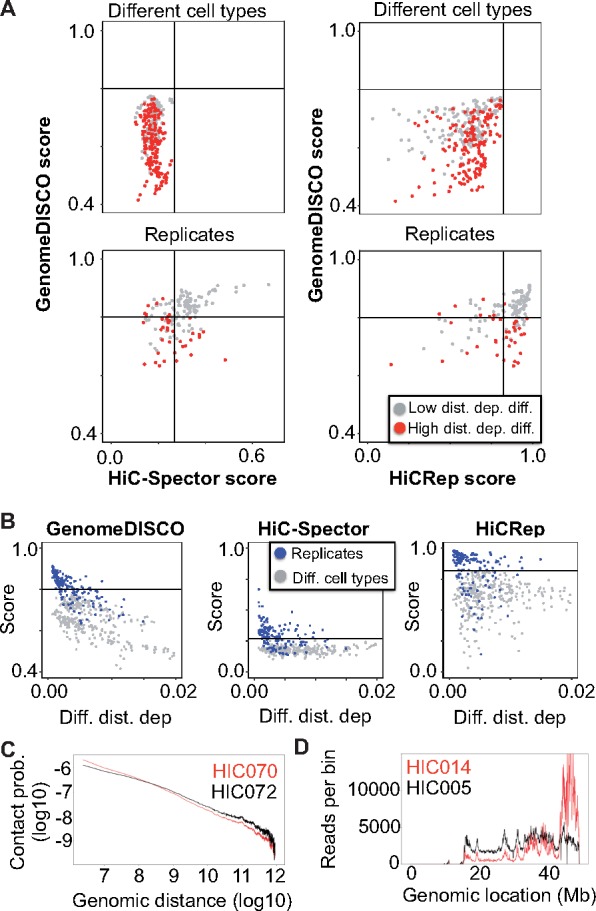
GenomeDISCO distinguishes biological replicates from nonreplicates, taking distance dependence curves into account A) Scatterplot of scores obtained with GenomeDISCO versus those obtained with HiCRep and HiC-Spector. For each of the three methods, we define a threshold that separates low-concordance from high-concordance pairs of samples. The threshold is chosen as the highest score obtained by a comparison between different cell types. GenomeDISCO largely agrees with the other methods. There is a subset of scores that GenomeDISCO selectively ranks as low-concordance, and those involve pairs of contact maps with large differences between their distance dependence curves. Comparisons are split into “Low distance dependence difference” and “High distance dependence difference” based on a threshold of 0.005 Jensen-Shannon divergence between the contact probability distributions of the matrices compared (see Supplementary Methods). B) Concordance scores as a function of difference in distance dependence functions. The difference is measured as the Jensen Shannon divergence between the contact probability distributions (see Supplementary Methods). C) Example of different distance dependence functions that GenomeDISCO deems non-concordant but HiCRep defines as concordant. D) Row sums for each genomic bin for sample HIC014 are non-uniform, compared to e.g. HIC005, at a similar sequencing depth of ∼300 million reads
Next, we used GenomeDISCO, HiCRep and HiC-Spector to compute concordance scores for all the pairs of biological replicates and pairs of samples from different cell types. Hierarchical clustering of the samples based on the matrix of all pairwise concordance scores revealed that samples from the same cell type cluster together, for all three methods (see Supplementary Fig. S5). For each method, we defined an empirical threshold for classifying sample-pairs into one of two categories labeled high concordance and low concordance. The threshold was determined as the highest score across all pairs of samples from different cell types, since we expect concordant biological replicates to be at least as concordant as samples from different cell types. We then analyzed the similarities and differences between the three methods in terms of their classification of the pairs of biological replicates. (Fig. 3A).
Out of 149 pairs of biological replicates in the test set, we found that the methods agreed across most samples (94/149 biological replicate pairs were classified consistently between GenomeDISCO and HiCRep and 102/149 between GenomeDISCO and HiC-Spector). For a small subset of replicate-pairs, HiCRep and/or HiC-Spector classified them as high concordance, while GenomeDISCO classified them as low concordance: of these 21/34 of the comparisons deemed concordant by HiCRep and 12/23 by HiC-Spector, the comparisons involved samples with large differences in distance dependence curves (difference in distance dependence curve higher than 0.005, a value that was found to distinguish pairs of biological replicates in the high-concordance class from those in the low-concordance class). For example, samples HIC070 and HIC072 (biological replicates for the K562 cell line) are classified as low concordance by GenomeDISCO (score 0.644) but classified as high-concordance by HiCRep (score 0.910). These samples have a marked difference in their distance dependence curves (ranked as the largest difference in distance dependence curve among all biological replicate pairs) (Fig. 3C). In fact, GenomeDISCO scores in general drop proportional to the difference in distance dependence curves between the pair of samples being compared (Fig. 3B). Finally, we find 18 cases ranked as non-concordant by both HiCRep and HiC-Spector but deemed concordant by GenomeDISCO. For 6/18 of these, the GenomeDISCO score is equal to the threshold concordance of 0.8. Similarly, there are 18 cases deemed concordant only by HiCRep and 7 deemed concordant only by HiC-Spector.
We also found that 18 replicate pairs were deemed low concordance by all three methods. In particular, in eight of these cases, replicate pairs classified as low concordance by all three methods involved sample HIC014 from the GM12878 cell type (specifically HIC014 versus any of HIC004, HIC006, HIC010, HIC018, HIC022, HIC038, HIC042 and HIC048). Upon closer inspection, we found that HIC014 exhibited an unusual pattern of uneven coverage across the genome (Fig. 3D), likely explaining the observed results.
Finally, we also used the Hi-C data to check whether GenomeDISCO is able to detect differences in protocols or restriction enzymes used for each experiment (see Supplementary Fig. S4). We found that GenomeDISCO scores are lower for comparisons between samples prepared with dilution Hi-C versus in situ Hi-C (Supplementary Fig. S4 A). This observation is expected because dilution Hi-C experiments capture more random ligations between nuclear and mitochondrial DNA than in-situ Hi-C (see (Rao et al., 2014)). We also found that GenomeDISCO scores are higher for experiments performed with the same enzyme, compared to different enzymes (Supplementary Fig. S4B).
3.3 Benchmarking GenomeDISCO on HiChIP data
We applied GenomeDISCO to a set of H3K27ac HiChIP datasets from (Mumbach et al., 2017), covering two to three replicates for seven cell types (GM12878, HCASMC, K562, My-La and three types of T-cells: Naïve, Th17 and Treg, see Supplementary Table S1). As for Hi-C, we binned the HiChIP reads at a resolution of 50 kb and normalized the contact maps using sqrtvc. We then ran GenomeDISCO on all pairwise comparisons and checked whether biological replicates are deemed more concordant than pairs of samples from different cell types. We found that GenomeDISCO scores correctly separate biological replicates from non-replicates, for the non-T-cell comparisons, using the same parameters as for Hi-C and the same threshold for defining concordance (from Fig. 3), suggesting that GenomeDISCO generalizes seamlessly to HiChIP data (Fig. 4). We obtained similar results for HiCRep and HiC-Spector. For the comparisons between T-cells, all three methods produced similar scores for both comparisons between biological replicates and those between different types of T-cells, with the biological replicates receiving the highest scores in almost all cases. Using the thresholds of concordance derived for Hi-C, we find that for GenomeDISCO, T-cell related comparisons pass the threshold above a sequencing depth of 50 million reads, while HiCRep deems all T-cell comparisons as concordant and HiC-Spector deems a smaller subset as concordant. Overall, we find that GenomeDISCO behaves as expected for HiChIP data, without any modifications to the method.
4 Discussion
Here, we present GenomeDISCO, a new approach specifically designed for evaluating concordance and reproducibility of chromatin contact maps. Our benchmarking experiments on simulated contact maps and high quality real Hi-C and HiChIP datasets, which include systematic comparisons to two other methods HiCRep and HiC-Spector, indicate that GenomeDISCO displays competitive accuracy in distinguishing biological replicates from different cell types with the desired sensitivity to sequencing depth, node and edge dropout noise, changes in domain boundaries and subtle differences in distance dependence.
GenomeDISCO introduces a novel approach of using random walks on the contact map graph for progressive smoothing and evaluation of concordance at multiple scales. A weighted graph is a natural representation of a chromatin contact map. A random walk on a contact map graph progressively upweights direct edges involving node pairs that have many high-weight indirect paths of progressively increasing lengths that connect the node pairs.
Furthermore, GenomeDISCO is sensitive to subtle differences in distance dependence curves. Since it is a common to pool multiple Hi-C replicates, it is essential to know if samples exhibit differences, so as to not eliminate signal during pooling, especially since in some cases variation in distance dependence curves is biologically meaningful.
On the other hand, two datasets can have different distance dependence curves but still be concordant in terms of enrichments of contacts when accounting for the different distance dependence function of each dataset. Thus, if one is interested in evaluating concordance of contact enrichment (e.g. as measured by methods that call significant contacts), then one can normalize the observed contact frequencies by the expected distance-dependent contact frequencies (which would correct for most differences in distance dependence) for the pair of contact maps before feeding them into GenomeDISCO. One can obtain these observed/expected ratios or associated q-values from Fit-Hi-C (Ay et al., 2014).
Furthermore, GenomeDISCO provides a variety of diagnostic analyses that are useful for digging deeper in the potential reasons for low concordance. The diagnostic analyses include the comparison of distance dependence curves and a difference matrix between smoothed contact maps (Figs 1 and 3).
Finally, what determines a good threshold for concordance of biological replicates? Based on our extensive analyses of simulated datasets and extensive collections of Hi-C data, we define an empirical GenomeDISCO score threshold of 0.8 at 50 kb resolution. We also provide a set of precomputed standards based on pseudo-replicates for frequently used resolutions, allowing a direct calibration of a given score to an upper bound.
While GenomeDISCO summarizes concordance in a single score, a future direction of research consists of developing methods that specifically focus on measuring concordance of distinct features of the contact map, such as TADs, compartments and loops. For cases where concordance is low, such methods will be instrumental to pinpoint the specific feature of the contact maps that accounts for the observed difference.
3D chromatin architecture is the next frontier in deciphering genome function. Ensuring high quality reproducible experiments is an essential part of this revolution in understanding chromatin architecture. GenomeDISCO is a user-friendly, efficient and accurate diagnostic tool for evaluating the reproducibility of 3D chromatin conformation capture experiments.
Supplementary Material
Acknowledgements
We would like to thank Michael Snyder, Jonathan Pritchard, Howard Chang, Michael Bassik, Avanti Shrikumar, Johnny Israeli and the Kundaje Lab for helpful discussions. We also thank Suhas Rao for clarifications related to the Hi-C datasets used and Anna Shcherbina and Chris Probert for help with visualization.
Funding
O.U. is supported by a Howard Hughes Medical Institute International Student Research Fellowship and a Gabilan Stanford Graduate Fellowship. A.K. is supported by NIH grant nos. [1DP2GM12348501, 3U41HG007000-04S1, 3R01ES02500902S1 and 1U01HG009431-01].
Conflict of Interest: none declared.
References
- Ay F. et al. (2014) Statistical confidence estimation for Hi-C data reveals regulatory chromatin contacts. Genome Res., 24, 999–1011. [DOI] [PMC free article] [PubMed] [Google Scholar]
- Beagan J.A. et al. (2016) Local genome topology can exhibit an incompletely rewired 3D-folding state during somatic cell reprogramming. Cell Stem Cell, 18, 611–624. [DOI] [PMC free article] [PubMed] [Google Scholar]
- Cairns J. et al. (2016) CHiCAGO: robust detection of DNA looping interactions in Capture Hi-C data. Genome Biol., 17, 127. [DOI] [PMC free article] [PubMed] [Google Scholar]
- Carty M. et al. (2017) An integrated model for detecting significant chromatin interactions from high-resolution Hi-C data. Nat. Commun., 8, 15454. [DOI] [PMC free article] [PubMed] [Google Scholar]
- Cournac A. et al. (2012) Normalization of a chromosomal contact map. BMC Genomics, 13, 436.. [DOI] [PMC free article] [PubMed] [Google Scholar]
- Dekker J. et al. (2002) Capturing chromosome conformation. Science, 295, 1306–1311. [DOI] [PubMed] [Google Scholar]
- Dixon J.R. et al. (2015) Chromatin architecture reorganization during stem cell differentiation. Nature, 518, 331–336. [DOI] [PMC free article] [PubMed] [Google Scholar]
- Dostie J. et al. (2006) Chromosome conformation capture carbon copy (5C): a massively parallel solution for mapping interactions between genomic elements. Genome Res., 16, 1299–1309. [DOI] [PMC free article] [PubMed] [Google Scholar]
- Duan Z. et al. (2010) A three-dimensional model of the yeast genome. Nature, 465, 363–367. [DOI] [PMC free article] [PubMed] [Google Scholar]
- Fraser J. et al. (2015) Hierarchical folding and reorganization of chromosomes are linked to transcriptional changes in cellular differentiation. Mol. Syst. Biol., 11, 852. [DOI] [PMC free article] [PubMed] [Google Scholar]
- Fullwood M.J. et al. (2009) An oestrogen-receptor-alpha-bound human chromatin interactome. Nature, 462, 58–64. [DOI] [PMC free article] [PubMed] [Google Scholar]
- Gröschel S. et al. (2014) A single oncogenic enhancer rearrangement causes concomitant EVI1 and GATA2 deregulation in leukemia. Cell, 157, 369–381. [DOI] [PubMed] [Google Scholar]
- Haarhuis J.H.I. et al. (2017) The cohesin release factor WAPL restricts chromatin loop extension. Cell, 169, 693–707.e14. [DOI] [PMC free article] [PubMed] [Google Scholar]
- Hu M. et al. (2012) HiCNorm: removing biases in Hi-C data via Poisson regression. Bioinformatics, 28, 3131–3133. [DOI] [PMC free article] [PubMed] [Google Scholar]
- Imakaev M. et al. (2012) Iterative correction of Hi-C data reveals hallmarks of chromosome organization. Nat. Methods, 9, 999–1003. [DOI] [PMC free article] [PubMed] [Google Scholar]
- Knight P.A., Ruiz D. (2013) A fast algorithm for matrix balancing. IMA J. Numer. Anal., 33, 1029–1047. [Google Scholar]
- Krijger P.H.L., de Laat W. (2016) Regulation of disease-associated gene expression in the 3D genome. Nat. Rev. Mol. Cell Biol., 17, 771–782. [DOI] [PubMed] [Google Scholar]
- Lajoie B.R. et al. (2015) The Hitchhiker’s guide to Hi-C analysis: practical guidelines. Methods, 72, 65–75. [DOI] [PMC free article] [PubMed] [Google Scholar]
- Lieberman-Aiden E. et al. (2009) Comprehensive mapping of long-range interactions reveals folding principles of the human genome. Science, 326, 289–293. [DOI] [PMC free article] [PubMed] [Google Scholar]
- Lupiáñez D.G. et al. (2015) Disruptions of topological chromatin domains cause pathogenic rewiring of gene-enhancer interactions. Cell, 161, 1012–1025. [DOI] [PMC free article] [PubMed] [Google Scholar]
- Mifsud B. et al. (2015) Mapping long-range promoter contacts in human cells with high-resolution capture Hi-C. Nat. Genet., 47, 598–606. [DOI] [PubMed] [Google Scholar]
- Mifsud B. et al. (2017) GOTHiC, a probabilistic model to resolve complex biases and to identify real interactions in Hi-C data. PLoS One, 12, e0174744.. [DOI] [PMC free article] [PubMed] [Google Scholar]
- Mizuguchi T. et al. (2014) Cohesin-dependent globules and heterochromatin shape 3D genome architecture in S. pombe. Nature, 516, 432–435. [DOI] [PMC free article] [PubMed] [Google Scholar]
- Mumbach M.R. et al. (2016) HiChIP: efficient and sensitive analysis of protein-directed genome architecture. Nat. Methods, 13, 919–922. [DOI] [PMC free article] [PubMed] [Google Scholar]
- Mumbach M.R. et al. (2017) Enhancer connectome in primary human cells identifies target genes of disease-associated DNA elements. Nat. Genet., 49: 1602. [DOI] [PMC free article] [PubMed] [Google Scholar]
- Nagano T. et al. (2017) Cell-cycle dynamics of chromosomal organization at single-cell resolution. Nature, 547, 61–67. [DOI] [PMC free article] [PubMed] [Google Scholar]
- Naumova N. et al. (2013) Organization of the mitotic chromosome. Science, 342, 948–953. [DOI] [PMC free article] [PubMed] [Google Scholar]
- Rao S.S.P. et al. (2014) A 3D map of the human genome at kilobase resolution reveals principles of chromatin looping. Cell, 159, 1665–1680. [DOI] [PMC free article] [PubMed] [Google Scholar]
- Ron G. et al. (2017) Promoter-enhancer interactions identified from Hi-C data using probabilistic models and hierarchical topological domains. Nat. Commun., 8, 2237. [DOI] [PMC free article] [PubMed] [Google Scholar]
- Schmitt A.D. et al. (2016) Genome-wide mapping and analysis of chromosome architecture. Nat. Rev. Mol. Cell Biol., 17, 743–755. [DOI] [PMC free article] [PubMed] [Google Scholar]
- Servant N. et al. (2015) HiC-Pro: an optimized and flexible pipeline for Hi-C data processing. Genome Biol., 16, 259.. [DOI] [PMC free article] [PubMed] [Google Scholar]
- Simonis M. et al. (2006) Nuclear organization of active and inactive chromatin domains uncovered by chromosome conformation capture-on-chip (4C). Nat. Genet., 38, 1348–1354. [DOI] [PubMed] [Google Scholar]
- Yaffe E., Tanay A. (2011) Probabilistic modeling of Hi-C contact maps eliminates systematic biases to characterize global chromosomal architecture. Nat. Genet., 43, 1059–1065. [DOI] [PubMed] [Google Scholar]
- Yan K.-K. et al. (2017) HiC-spector: a matrix library for spectral and reproducibility analysis of Hi-C contact maps. Bioinformatics, 33, 2199–2201. [DOI] [PMC free article] [PubMed] [Google Scholar]
- Yang T. et al. (2017) HiCRep: assessing the reproducibility of Hi-C data using a stratum-adjusted correlation coefficient. Genome Res., 27, 1939–1949. [DOI] [PMC free article] [PubMed] [Google Scholar]
- Yardımcı G. et al. (2017) Measuring the reproducibility and quality of Hi-C data. bioRxiv, 188. [Google Scholar]
- Zhao Z. et al. (2006) Circular chromosome conformation capture (4C) uncovers extensive networks of epigenetically regulated intra- and interchromosomal interactions. Nat. Genet., 38, 1341–1347. [DOI] [PubMed] [Google Scholar]
Associated Data
This section collects any data citations, data availability statements, or supplementary materials included in this article.