

Abstract
Neocortical vasoactive intestinal polypeptide (VIP) expressing cells are a diverse subpopulation of GABAergic interneurons issuing distinct axonal projections. They are known to inhibit other types of interneurons as well as excitatory principal neurons and possess a disinhibitory net effect in cortical circuits. In order to elucidate their targeting specificity, the output connectivity of VIP interneurons was studied at the subcellular level in barrel cortex of interneuron-specific Cre-driver mice, using pre- and postembedding electron microscopy. Systematically sampling VIP boutons across all layers, we found a substantial proportion of the innervated subcellular structures were dendrites (80%), with somata (13%), and spines (7%) being much less targeted. In layer VI, a high proportion of axosomatic synapses was found (39%). GABA-immunopositive ratio was quantified among the targets using statistically validated thresholds: only 37% of the dendrites, 7% of the spines, and 26% of the somata showed above-threshold immunogold labeling. For the main target structure “dendrite”, a higher proportion of GABAergic subcellular profiles existed in deep than in superficial layers. In conclusion, VIP interneurons innervate non-GABAergic excitatory neurons and interneurons at their subcellular domains with layer-dependent specificity. This suggests a diverse output of VIP interneurons, which predicts multiple functionality in cortical circuitry beyond disinhibition.
Keywords: cortical circuit, electron microscopy, GABA, immunogold labeling, vasoactive intestinal polypeptide
Introduction
Inhibitory (i.e., GABAergic) interneurons represent only approximately 12–20% of the neocortical neuronal population, while they display a much greater phenotypic repertoire than the majority population being glutamatergic principal neurons. This is due to the heterogeneity of interneurons in terms of morphological, electrophysiological, and molecular properties (Markram et al. 2004; Ascoli et al. 2008; DeFelipe et al. 2013; Harris and Mrsic-Flogel 2013; Jiang et al. 2015; Tasic et al. 2016; Feldmeyer et al. 2017). Vasoactive intestinal polypeptide positive (VIP) interneurons, which account for around 12–17% of the interneuron population, belong to the 5HT3a-receptor expressing class of three basically non-overlapping populations of interneurons, with the other 2 classes being parvalbumin (PV) expressing and somatostatin (SOM) expressing interneurons (Rudy et al. 2011; Pfeffer et al. 2013; Staiger et al. 2015; Tremblay et al. 2016).
Although VIP expression marks a specific class of interneurons that does not overlap with the 2 major other subpopulations, as a class they are heterogeneous since they coexpress several molecular markers and thus partially overlap with other types of interneurons, e.g., calretinin (CR) or cholecystokinin (CCK) positive interneurons (Xu et al. 2010; Kubota et al. 2011; Cauli et al. 2014; Zeisel et al. 2015; He et al. 2016). VIP interneurons typically show a bipolar/bitufted dendritic morphology and are mainly located in layer II/III. However, also all other cortical layers contain bipolar/bitufted, tripolar, multipolar, or atypical VIP cells in rat (Bayraktar et al. 2000) as well as mouse (Prönneke et al. 2015) and probably most other species, including human (Lake et al. 2016). VIP cells in layer II/III send axon collaterals to deep layers besides the local innervation of their home layer whereas those in layers IV–VI largely restrict their axons to these deeper layers (Prönneke et al. 2015). Thus, VIP interneurons may regulate the circuitry of the entire cortical column at many different levels.
In recent years, several functional studies found strong connectivity between VIP interneurons and SOM-expressing Martinotti cells in various neocortical regions (Lee et al. 2013; Pfeffer et al. 2013; Pi et al. 2013; Fu et al. 2014; Zhang et al. 2014), as could have been predicted by earlier morphological studies (Staiger et al. 2004). VIP interneurons target GABA-positive dendrites, which was demonstrated by anti-GABA immunogold staining in hippocampus (Acsády et al. 1996), and thus considered as interneuron-specific interneurons (Klausberger and Somogyi 2008). VIP interneurons act in a disinhibitory manner on the principal neurons via the recruitment of a VIP-to-Martinotti cell circuit motif. This motif should release pyramidal neurons from inhibition by Martinotti cells at their distal dendritic tufts (Pfeffer 2014; Karnani et al. 2016; Walker et al. 2016). However, as a heterogeneous class, it seems unlikely that VIP interneurons regulate the whole cortical column by only one motif, being disinhibitory.
Beyond disinhibition, recent in vivo experiments showed a pull–push computation for VIP interneurons during arousal, which involves direct inhibition followed by disinhibition on pyramidal neurons in mouse frontal cortex (Garcia-Junco-Clemente et al. 2017). Such functional connectivity of VIP cells to local pyramidal neurons was previously demonstrated (which is often neglected) by paired recordings in mouse barrel cortex (S1) and primary visual cortex (V1), although the connectivity rate and strength were both lower than in VIP-to-SOM interneurons (Lee et al. 2013; Pfeffer et al. 2013). In addition, octuple recordings in mouse V1 showed both intralaminar and translaminar connections of specific subtypes of interneurons in layer II/III, which were partially identified as VIP interneurons, onto pyramidal cells in both layers II/III and V (Jiang et al. 2013, 2015). All this evidence suggests that besides the disinhibitory circuit motif, there exist other output connections of VIP cells in the cortical microcircuitry.
So far, morphological studies have quantified the connectivity between VIP interneurons and other types of interneurons and showed that it varied among different subcellular compartments and target cells (Staiger et al. 2004; Dávid et al. 2007; Hioki et al. 2013; Sohn et al. 2016). Studies on the output of the partially overlapping population of CR interneurons found differential innervation patterns throughout cortical layers of rodent and monkey V1: in superficial layers, they primarily inhibit interneurons, while in deep layers they preferentially inhibit pyramidal neurons (Meskenaite 1997; Gonchar and Burkhalter 1999). So far, a quantitative study, which regards both interneurons and excitatory neurons as putative targets of VIP neurons is still missing. Toward this aim, we used pre-embedding anti-YFP staining on sections of VIP-Cre/Rosa-YFP transgenic mice (Taniguchi et al. 2011) to visualize the entire population of VIP interneurons, and postembedding anti-GABA immunocytochemistry at the ultrastructural level (Ottersen 1987; Acsády et al. 1996; Staiger et al. 1996) to localize GABA. We further employed the receiver operating characteristic (ROC) curve to evaluate the sensitivity and specificity of anti-GABA staining and to obtain the GABA-immunopositive thresholds for different targeted structures. This allowed us to distinguish between excitatory and inhibitory target structures. We found that besides GABAergic interneurons, a substantial proportion of VIP boutons target GABA-immunonegative subcellular structures, and this targeting specificity is layer-dependent. To support this main finding, pyramidal neurons were retrogradely labeled by rabies virus and stained together with VIP interneurons by double immunostaining. Synapses on different subcellular domains of pyramidal cells were verified by correlated light and electron microscopy. Altogether, these results suggest multiple circuit motifs of VIP interneurons, which predict multiple functionality beyond disinhibition.
Materials and Methods
Animals, Perfusion, and Tissue Processing
We used 5 heterozygous, 4–6-month old male VIP-Cre/Rosa-YFP mice for quantitative immunoelectron microscopy and three adult (12 weeks old) VIP-Cre/tdTomato mice for double immunostaining. They were generated by crossing homozygous VIP-ires-Cre mice (VIPtm1(cre)Zjh, The Jackson Laboratory) with homozygous Ai3 mice (floxed YFP mice: B6.Cg-Gt(Rosa)26Sor-tm3(CAG-EYFP)Hze/J) and Ai9 mice (floxed tdTomato mice: B6.Cg-Gt(ROSA)26Sortm9(CAG-tdTomato)Hze/J), respectively (Madisen et al. 2010). All mice were bred at the animal facility of the University Medical Center Göttingen (Göttingen, Germany). The experimental procedures were performed in accordance with German laws on animal research (TierSchG und TierSchVersV 2013).
All mice were intraperitoneally injected with an overdose of ketamin and transcardially perfused. For VIP-Cre/Rosa-YFP mice, we used a slightly modified protocol of Sloviter et al. (1989). It started with 0.9% sodium chloride for 2 min, then acidic fixative (2% PFA, 1% GA, in sodium acetate buffer, pH 6.0) for 2 min, followed by basic fixative (2% PFA, 1% GA, in borate buffer, pH 8.5) for 60 min. In 3 VIP-Cre/tdTomato mice, the barrel cortex was injected with rabies virus SAD∆G-EGFP-(CVS-G) (Wickersham et al. 2007; Hagendorf and Conzelmann 2015). Injections of rabies virus (1 × 10⁷ infectious particles per ml) were made with a Nanoject III (Drummond Scientific). 50–100 nl of virus were injected 500 μm below the dura at + 3.25 mm lateral and −1.55 mm posterior to bregma. The virus indiscriminately infected all synaptic terminals present at the injection site and was retrogradely transported to the soma to eventually label the entire neuron in a Golgi-like manner with EGFP. Animals were kept in their home cages for 10 days after injection. The perfusion protocol was: 0.9% sodium chloride for 2 min, then fixative (4% PFA, 0.2% GA, in PB, pH 7.4) for 20 min, followed by 2 h postfixation in the same fixative. All mouse brains were collected, rinsed and stored in 0.1 M phosphate buffer (PB; pH 7.4) for sectioning.
The brains were cut into 50 μm-thick coronal sections with a vibratome (VT 1200 S, Leica, Germany) containing the barrel field from Bregma −1.06 mm to Bregma −1.94 mm. The sections were incubated in cryoprotectant (2% saccharose, 10% glycerol in 0.01 M PB) overnight at 4°C, and freeze–thawed over liquid nitrogen 3 times. Then they were rinsed first with 0.1 M PB and then with 0.05 M Tris buffer (TB; pH 7.6) and transferred to immunostaining.
Immunohistochemistry
Pre-embedding Anti-YFP Immunohistochemistry
The sections were incubated in the blocking solution with 0.25% BSA, 0.1 M DL-lysin, 10% normal goat serum in Tris-buffered saline (0.05 M TBS; pH 7.6) for 4 h at room temperature. To detect YFP, polyclonal rabbit anti-GFP (Invitrogen, A11122) was used as primary antibody and incubated at 1:1000 dilution for 72 h at 4°C. Secondary antibody was biotinylated goat anti-rabbit, 1:200 diluted in blocking solution, incubated overnight at 4°C. After rinsing with TBS, the sections were treated with avidin–biotin complex solution (ABC; Vector Laboratories, California), 1:400 diluted in TBS, overnight at 4°C. For visualization, they were incubated for 10 min in 0.05 M 3-3′ diaminobenzidine tetrahydrochloride (DAB; Sigma, Germany) diluted in TB, then 30% H2O2 (Merck, Germany) was added to a final concentration of 0.01%. The reaction lasted for 7–10 min until somata of VIP cells appeared black under the stereoscope. The sections were thoroughly rinsed in TB, followed by phosphate-buffered saline (PBS; pH 7.4).
Pre-embedding Anti-GABA Immunogold Labeling
Postembedding anti-GABA immunostaining was carried out with the modified protocol of Somogyi and Hodgson (1985). Nickel grids with ultrathin sections were pretreated with 1% periodic acid for 10 min for etching the osmium and 1% sodium periodate for 10 min for etching the resin. Immunoreaction was performed in a humid petri dish with grids being placed upside down on drops of reagents on parafilm. The grids were washed with distilled water for 3 × 3 min, followed by TBS (pH 7.4) for 3 min. For blocking, they were incubated with 1% ovalbumin in TBS for 30 min. Primary antibody was polyclonal rabbit anti-GABA (Sigma-Aldrich, A2052), diluted in TBS at 1:500. After 90 min incubation, grids were washed 4 × 5 min in TBS. Secondary antibody was 12 nm gold conjugated to goat anti-rabbit (Dianova; No. 111-205-144), diluted in TB (pH 7.4) at 1:40 with 1% BSA and 0.5% Tween 20. Grids were incubated for 90 min in a dark moist chamber and washed 3 × 5 min with distilled water. After that, the grids were contrast-stained with 10% uranyl acetate for 30 min and quickly rinsed 4 times in distilled water.
Pre-Embedding Double Immunocytochemistry
Double immunostaining procedure was modified from a previous study (Staiger et al. 2004). After incubation in a first blocking solution (0.25% BSA, 0.1 M DL-lysin, 10% normal horse serum in TBS) for 4 h at room temperature, mouse anti-RFP (Rockland, 200-301-379, 1:1000 diluted) and rabbit anti-GFP (Invitrogen, A11122, 1:1000 diluted) were used as primary antibodies to detect VIP cells and pyramidal cells retrogradely transduced after rabies virus injection, respectively. After 72 h incubation at 4°C and intensive rinsing in TBS, the sections were stained with biotinylated horse anti-mouse antibody (Vector Laboratories, California, 1:200 diluted) overnight at 4°C. After rinsing, they were incubated in avidin–biotin complex (1:400 diluted in TBS with 1% BSA) overnight at 4°C. After rinsing in TBS and TB (pH 8.2), DAB-nickel staining was carried out for visualizing VIP cells. The sections were pre-incubated in DAB-nickel solution (0.015% DAB, 0.4% ammonium nickel sulfate, diluted in TB pH 8.2) for 10 min, and then H2O2 was added to a final concentration of 0.005% to start the reaction. The reaction lasted for 3–5 min until somata of VIP cells appeared under the stereoscope. The sections were rinsed in TB (pH 8.2) and TBS (pH 8.2), and were then incubated in a second blocking solution (0.25% BSA, 0.1 M DL-lysin, 10% normal goat serum in TBS pH 8.2) for 2 h to start the second immunostaining. They were next stained with biotinylated goat anti-rabbit antibody (Vector Laboratories, California, 1:200 diluted) overnight at 4°C. After rinsing, they were incubated in avidin–biotin complex (1:400 diluted in TBS pH 8.2 with 1% BSA) overnight at 4°C. After rinsing in TBS (pH 8.2) and TB (pH 7.6), the sections were pre-incubated in DAB solution (0.5% DAB diluted in TB pH 7.6) for 10 min, and then H2O2 was added to a final concentration of 0.01% to the start reaction. The reaction lasted around 5 min to visualize retrogradely rabies-transduced pyramidal neurons. The double immunostaining ended with rinsing the sections in TB (pH 7.6) and PB (pH 7.4).
Electron Microscopy Sample Preparation
Osmification, Dehydration, and Embedding
The sections from VIP-Cre/YFP mice were treated with 0.5% osmium tetroxide in PBS for 1 h, and the ones from VIP-Cre/tdTomato mice with 0.25% osmium tetroxide (with 2.5% matured d-glucose in PB) for 1 h. After 3 × 15 min rinsing in PB, all sections were dehydrated and infiltrated with the protocol: 30% 5 min, 50% 5 min, 70% 30 min, 90% 10 min, 100% 10 min, isopropanol 10 min, propylene oxide 2 × 10 min, propylene oxide/epoxy resin (1:1) 60 min, epoxy resin overnight, and fresh epoxy resin 4 h. They were then flat-embedded in epoxy resin on glass slides covered by a piece of plastic film (Aclar) and polymerized in the oven for 2 days at 60°C.
Preparation of Sample Blocks for Ultramicrotomy
For the quantitative EM study, 2–3 sections from each VIP-Cre/YFP animal with good anti-YFP immunostaining were chosen for ultramicrotomy. The barrel field was detached using capsule blocks filled with pure epoxy resin. The block face was trimmed either into approximately 1200 μm × 300 μm trapezoid pyramids containing all cortical layers or into smaller ones of approximately 750 μm × 200 μm for serial sectioning, containing either superficial or deep layers. After trimming, the blocks were cut at 60–80 nm thickness on an ultramicrotome (Reichert Jung Ultracut, Leica, Germany). For large blocks, 2–3 consecutive ultrathin sections were mounted on a formvar-coated single-slot nickel grid; for small blocks, 5–6 serial ultrathin sections were mounted for each grid and in total around 25 serial sections were collected. All the nickel grids were stained with the anti-GABA immunogold procedure.
Imaging
Light Microscopic Imaging
Imaging was done after osmification and before ultramicrotomy. For whole population VIP cell imaging, we used a ×10 objective (NA = 0.30) of a light microscope (Axioskop; Zeiss; Germany). In order to have a homogeneous illumination across the sections, we used EnfuseGUI software to blend the images taken at different exposure times. The final image (Fig. 1A) was generated from 24 original images including 2 tiles, 6 exposure times and 2 planes of focus. Two focus planes were merged using minimum intensity projection algorithm (Fiji; Schindelin et al. 2012). For higher resolution VIP cell imaging (Fig. 1B,C), we used a ×40 objective (NA = 0.75) on an upright epi-fluorescence microscope (AxioImager.M2; Zeiss; Germany) and the virtual tissue acquisition mode of Neurolucida (MBF Bioscience; Colchester, VT). The generated stacks were also merged with the minimum intensity projection feature of Fiji.
Figure 1.

Light microscopic characterization of YFP-immunolabeled cells in the barrel cortex of the VIPcre-YFP mouse. (A) Distribution of the population of VIP cells in mouse barrel field shown in a 50 μm-thick, osmium-intensified and resin-embedded section. Most cells are located in superficial layers I–IV whereas much fewer are found in deep layers Va, Vb and VI. (B) Morphology of a cluster of bipolar VIP cells in layer II/III (left inset in A). (C) Multipolar VIP cell in layer Va (right inset in A). Arrows indicate primary dendrites. Scale bars = 100 μm in A; 10 μm in B, C.
Correlated Light and Electron Microscopy
Correlated light and electron microscopy was used to verify putative VIP synapses on pyramidal neurons (see Supplementary Fig. 4–5). Briefly, the labeled pyramidal neurons were imaged with a ×63 water immersion objective (NA = 1.2) on the epi-fluorescence microscope (see above section) and reconstructed using Neurolucida. During reconstruction, close spatial appositions as putative VIP synapses were marked. The sections were then trimmed into sample blocks containing the labeled pyramidal neurons (see EM Sample Preparation). Two micrometer-thick serial semithin sections were cut, transferred onto slides, and stained with Richardson's staining (1% Azure II, 1% Methylene blue, 1% Borax; Richardson et al. 1960) for 3 min. The putative VIP synapses were located in semithin sections and imaged at the light microscope using a ×40 objective. The semithin sections were then prepared into smaller sample blocks of approximately 700 μm × 300 μm trapezoid pyramids. 60–80 nm serial ultrathin sections were cut with 5–6 sections mounted onto formvar-coated single-slot copper grids. The grids were stained with 0.5% uranyl acetate for 30 min and 3% lead citrate for 4 min using a Leica EM AC20. After contrast staining, the grids were ready for EM observation.
Systematic Sampling of Axonal Boutons
A transmission electron microscope (LEO 906E; Zeiss, Germany) equipped with a wide-angle dual speed 2 K CCD camera (TRS, Germany) was used to observe and sample VIP boutons. We used a systematic sampling method and scanned all layers from a random start in layer I with an interval of 50 μm at low magnification (×2100). Higher magnification (×21 000) was used to check whether a VIP bouton forms synapse or not. Since VIP cells are interneurons (Rudy et al. 2011), they should form symmetric synapses and have three main characteristics: (i) a cluster of synaptic vesicles close to presynaptic membrane, (ii) parallel appositions between pre- and postsynaptic membranes and widening of the extracellular space at the putative synaptic cleft, and (iii) postsynaptic membrane thickening, although the feature is mostly very subtle in symmetric synapses. Consecutive sections were also checked for verifying a putative synapse.
For layer delineation we used the measured layer thickness described in Prönneke et al. (2015). In total, we collected 200 VIP boutons: layer I (n = 12), layer II/III (n = 74), layer IV (n = 45), layer V (n = 37), and layer VI (n = 32). Among them, 18 VIP boutons were checked by serial ultrathin sections for studying the presence of synaptic contacts. The postsynaptic targets were separated into three categories: dendrite, spine, and soma. Dendrites were recognized by containing mitochondria and microtubules. Spines were of smaller size and sometimes contained spine apparatus (smooth endoplasmic reticulum) but no mitochondria. Somata, regardless of the presence of nuclei, were identified by their specific morphology and content of organelles, like ribosomes, rough endoplasmic reticulum, and Golgi apparatus.
Data Analysis
Labeling of GABA-Positive and GABA-negative Profiles
In order to evaluate the anti-GABA staining, we first sampled different structurally defined putative subcellular profiles from interneurons and excitatory neurons as GABA-positive and GABA-negative samples, and calculated gold grain density of these profiles. The density was the number of gold grains over one profile divided by its area (μm2) (measured by Fiji). For GABA-positive profiles, we sampled 59 axonal terminals that formed symmetric synapses, 59 dendrites and 16 somata from interneurons. Interneuron somata were identified by having nuclear indentations. Interneuron dendrites were originating from such somata and had no appearance of spines. For GABA-negative profiles, we sampled 92 axonal terminals that formed asymmetric synapses, 80 spines, and 12 pyramidal cell somata. The density of interneuron dendrites and spines were plotted into histograms and fitted with log-normal and exponential distributions. The goodness of fit was tested with Chi-square test. Mann–Whitney U test was used to compare the density in pairwise between GABA-positive and GABA-negative profiles.
ROC Curves and GABA-immunopositive Thresholds
We used ROC curve (Fawcett 2006) to evaluate the anti-GABA staining specificity and sensitivity, and to determine the immunopositive thresholds for VIP bouton targets. Since dendrites were the main target of VIP interneurons (Acsády et al. 1996), we first generated the dendritic ROC curve using the labeling density of interneuronal dendrites and spines as putative positive and negative classes. The ROC curve was plotted by true positive rate (TPR) against false negative rate (FPR) using the ROCR package in R software (Sing et al. 2005). We also generated the somatic ROC curve for somatic targets of VIP boutons using the labeling density of interneuron versus pyramidal cell somata. The optimal cut-off points determined by the method ROC01 (closest point to (0,1)) were used for obtaining both dendritic and somatic immunopositive thresholds. The corresponding TPR (sensitivity), FPR (1-specificity), and areas under ROC (AUC) were calculated.
Comparing GABA Labeling Among Targeted Dendrites
For comparing GABA labeling among targeted dendrites across layers, we described the data (original and normalized gold grain density) in 25% Quartile (Q25), 50% Quartile (median), and 75% Quartile (Q75). Since the data did not follow a normal distribution, we used Kruskal–Wallis one-way analysis of variance (ANOVA) on ranks to test for a layer-dependent difference. Post hoc Dunn's test was used to compare differences between cortical layers, which was treated with Bonferroni correction due to multiple comparisons. Mann–Whitney U test was then used to compare the grouped normalized density between superficial and deep layers. All graphs and analysis were done using either Libreoffice calc or R software.
Results
Distribution and Morphology of VIP Interneurons at the Light Microscopic Level Suggests Specific and Comprehensive Labeling
Pre-embedding anti-YFP immunostaining was applied to label the entire population of VIP interneurons in the mouse barrel field. Across all mice used in this study (n = 5), the distribution of VIP neurons was similar, if not identical (Fig. 1A). Most of the cell bodies were located in superficial layers (I–IV) and only a few in deep layers (V and VI), which was consistent with previous findings in this mouse line (Prönneke et al. 2015). Thus, the staining probably visualized all VIP cell somata as well as their dendrites and axons in a Golgi-like manner. Importantly, in the neuropil dense punctate staining, suggestive of rich bouton labeling, was prominent throughout all layers at higher magnification (Fig. 1B,C). However, this needed to be proven by correlated light and electron microscopy (see below).
In accordance with previous classification (Bayraktar et al. 2000; Prönneke et al. 2015), a bipolar somatodendritic shape was most typical for VIP interneurons in layer II/III (Fig. 1B). Their somata were small and ovoid, giving rise to two primary dendrites that were oriented perpendicular to the pial surface (Fig. 1B). Multipolar VIP cells were far less prominent and usually found in deep layers (Fig. 1C). They possessed large, triangular or polygonal shaped somata with 4 or more primary dendrites extending in different directions. Their main axis was oblique to the pial surface (Fig. 1C). We also observed other somatodendritic types including single tufted, bitufted, modified bipolar, and atypical (e.g., horizontally distributed bipolar). We assume that our pre-embedding staining was thoroughly labeling all types of VIP cells and therefore enabled us to study their synaptic output properties without sample bias.
Correlated Light and Electron Microscopy Discloses Typical Features of VIP Somata, Dendrites, and Presynaptic Boutons
In our preparations, DAB precipitate was very intense and partially prevented detailed ultrastructural observations. Correlated light and electron microscopy, however, aided us in differentiating VIP profiles, especially large VIP boutons from dendritic varicosities of similar size. Individual 2 μm-thick semithin sections containing several VIP cell bodies as well as dendritic and axonal segments in superficial layers were contrasted with Richardson's staining which assisted the correlation process (Fig. 2A). Figure 2B shows the correlated ultrastructure of the somatodendritic domain of a layer II/III bipolar VIP cell (Fig. 2A, inset). The cytoplasm of the soma was darkly stained, leaving the nucleus unstained. The nucleus is indented (double arrows), a feature typical for GABAergic interneurons (Peters et al. 1991). On the light microscopic level, the axons appeared more curly and finer than the dendrites; the axonal boutons were roundish and smaller than the more fusiform-shaped dendritic varicosities (Fig. 2A,B). On the electron microscopic level, a cluster of unstained synaptic vesicles was visible in the axonal boutons, which accumulated near the active zone (Fig. 2C1–C8). This bouton was found in layer II/III and was followed in 9 serial ultrathin sections forming a symmetric synaptic junction in three of them (Fig. 2C4–C6).
Figure 2.

Ultrastructure of different subcellular compartments of VIP cells. (A, B) Correlative light and electron microscopic images of the soma and ascending primary dendrite of a bipolar VIP cell in layer II/III. The typical indentation of the nucleus is indicated by double arrow, single arrows show the same dendritic segment. (C1–8) Serial sections through a large, mitochondrium-containing VIP bouton clearly showing a synaptic specialization on a putative non-GABAergic dendrite (d1; white arrows show the active zone). d2 labels a putative GABAergic dendrite as gold grains accumulate over its mitochondria as well as cytoplasm (C7,8). Scale bars = 20 μm in A; 2 μm in B; 0.5 μm in C8 (applies to C1–7).
Through serial sectioning of 18 VIP boutons, we found that most of them formed symmetric synapses (90%, 16/18) on identified target structures. For 2 boutons no obvious synaptic contact was observed. In addition, most serially sectioned VIP boutons (87.5%, 14/16) formed only one synapse with one target whereas a few (12.5%, 2/16) formed 2 synapses on different targets. Synapses with an orientation of the cleft in parallel to or at a low angel with respect to the plane of sectioning are not easily identifiable (Kubota et al. 2009). This might have led to an underestimation of the synapse numbers formed by VIP boutons.
Establishing a Ground Truth for Postembedding Immunogold Labeling
In order to unequivocally identify the GABAergic postsynaptic targets of VIP cells, we established a quantitative method to evaluate the sensitivity and specificity of anti-GABA immunogold labeling. As a first step, the gold grain density of structurally identified putative GABA-positive and GABA-negative profiles was determined. GABA-negative profiles were asymmetric Type I presynaptic boutons (AT-I), pyramidal cell somata (PYR-SO), and spines (the overwhelming majority of which originates from dendrites of principal neurons). GABA-positive profiles were symmetric Type II presynaptic boutons (AT-II), interneuron somata (IN-SO) and dendrites (IN-D) in continuity with them. Labeling over different GABA-negative profiles was regarded as background for the different GABA-positive profiles as shown in Supplementary Figs. 2–3 and Supplementary Table 1. Instead of using excitatory neuron dendrites, labeling over spines was compared with the labeling over interneuron dendrites. This is because there was no difference of GABA labeling over spines and dendritic shafts of pyramidal cells. We found significantly higher gold grain density in each of the GABA-positive profiles compared with its “corresponding background” by Mann–Whitney U test (Fig. 3A; see Supplementary Table 1).
Figure 3.

Quantitative evaluation of anti-GABA immunostaining and generation of threshold for GABA-immunopositive dendrite. (A) Box plot of gold grain density (gold grains/μm2) of ultrastructurally defined GABA-positive (GABA+; red boxes; n = 134) and GABA-negative (GABA-; blue boxes; n = 184) profiles. Mann–Whitney U test shows significant differences in gold grain density between groups: At-I (n = 92) vs At-II (n = 59), S (n = 80) vs IN-D (n = 59), PYR-SO (n = 12) vs IN-SO (n = 16), At-II vs IN-D, At-II vs IN-SO (***P < 0.001), and At-I vs S (*, P = 0.05). (At-I: axonal terminal forming an asymmetric Type I synapse; At-II: axonal terminal forming a symmetric Type II synapse; S: spine; IN-D: interneuron dendrite; PYR-SO: pyramidal cell soma; IN-SO: interneuron soma). (B) Histograms of gold grain density of interneuron dendrites and spines. The two groups were taken as positive and negative classes for generating the classifier which was used for estimating immunopositive dendrites among VIP cell targets. (C) Histograms in (B) were fitted with log-normal distribution and exponential distribution. Goodness of fit was evaluated by Chi-square test. Since both P values (0.40, 0.68) are much higher than 0.05, the two distributions fit well the empirical datasets. The threshold is the optimal cut-off point (dashed line). If gold grain density of a targeted dendrite is above or below threshold, it will be classified as immunopositive or immunonegative, respectively. (D) Empirical dendritic ROC curve plotted by using the dataset in (B). The ordinate (right) illustrates the color coding of cut-off points which are displayed on the colorized ROC curve. The optimal cut-off point 11.1 gold grains/μm2 was found by using the method ROC01 (closest point to (0,1)). It also generates high sensitivity, specificity and area-under-the-curve (AUC) values.
It should be noted, however, that the GABA labeling was not equally robust among GABA-positive subcellular compartments. Presynaptic inhibitory axonal terminals had a higher labeling density than dendrites (U = 2881, P < 0.001) and somata (U = 838, P < 0.001); between dendrites and somata of interneurons there was no difference (U = 610.5, P = 0.07). In addition, there was a difference in background labeling: it was higher over excitatory axonal terminals than over spines (U = 4322, P = 0.05), which were not different from pyramidal cell somata (U = 606, P = 0.58).
The histograms of gold grain density of interneuron dendrites and spines showed that they were not normally distributed and had an overlapping region (Fig. 3B). In fact, they followed log-normal and exponential distributions, respectively, as shown by fitting corresponding functions to the original datasets (Fig. 3C). The goodness of fit was measured with Chi-square test for both distributions (interneuron dendrites: Chi-square = 3.94, df = 6, P = 0.68; spines: Chi-square = 4.03, df = 4, P = 0.40). Due to the small sample size, we did not fit the somatic labeling. The overlap of GABA-positive and GABA-negative labeling inevitably causes false positive and false negative measurements. Therefore, we used ROC curves to evaluate anti-GABA labeling to identify GABAergic targets of VIP cells. As described in more detail in the Methods section, dendritic and somatic ROC curves were generated directly from the experimental data. The area under the ROC curve was high for both curves (AUCDendrite = 0.93, Fig. 3D; AUCsoma = 0.82, Supplementary Fig. 1A). The dendritic threshold was determined to be 11.1 grains/μm2, with a probability of 0.16 to make a type I error (false positive rate, FPR) and with a probability of 0.14 to make a type II error (false negative rate, FNR). The somatic threshold was 8.5 grains/μm2, with probabilities of 0.17 for type I and 0.29 for type II errors, respectively. Accuracy was chosen as a second evaluation measurement for the ROC analysis. At the chosen thresholds, accuracy for both subcellular compartments was good (>0.8) (see Supplementary Fig. 1B). In summary, ROC curve analysis indicated a reliable performance of GABA labeling in GABAergic compartment identification, and thus the thresholds determined by the analysis were used to distinguish between GABAergic and non-GABAergic compartments among the targets of VIP boutons.
Quantifying Postsynaptic Targets of VIP Boutons Reveals a Clear Preference for Dendrites
In total we sampled 200 boutons: 12 in layer I, 74 in layer II/III, 45 in layer IV, 37 in layer V, and 32 in layer VI. The specific laminar distribution of this sample was inspired by soma localization as reported in our recent study (Prönneke et al. 2015). All of these boutons formed symmetric Type II synapses. Figure 4 details the proportion with which postsynaptic structures were targeted by VIP boutons and their distribution across cortical layers. Overall, the 200 VIP boutons formed 208 synapses. Of these, 80% (166/208) were on dendrites, 7% (15/208) on spines, and 13% (27/208) on somata. This confirms that neocortical VIP interneurons target mainly dendrites, like previously shown for the hippocampus (Acsády et al. 1996). In agreement with our results from serial sections, most VIP boutons formed one synapse, however, 8.5% (17/200) of the boutons had two targets. Most of the postsynaptic targets were innervated by a single VIP bouton whereas only 3% (7/208) targets were found to be decorated with either 2 or 3 VIP synapses in any single or serial ultrathin section. Such a multiple innervation usually occurred on somata.
Figure 4.

Fractions of postsynaptic targets of VIP boutons. VIP boutons target three subcellular structures, namely dendrites (blue; n = 166), spines (red; n = 15), and somata (yellow; n = 27). The presynaptic profiles are 200 VIP boutons collected across layers as shown to the left. Note that dendritic targets dominate in all layers.
When cortical layers were separated, we found a layer-dependent difference in the proportion of target structures (Fig. 4). In layer I, all 12 VIP boutons exclusively formed synapses with 14 dendritic targets. Layers II/III, IV and V showed a comparable distribution of postsynaptic subcellular structures. In layer II/III, the targets of VIP boutons amounted to 80% (62/77) for dendrites, 12% (9/77) for spines, and 8% (6/77) for somata. In layer IV, dendrites were the most frequently innervated subcellular profile (84%; 41 / 49). Innervation on spines and somata amounted to only 4% (2/49) and 12% (6/49), respectively. Similarly in layer V, 84% (32/37) of contacts were on dendrites whereas spines and somata both received presynaptic VIP boutons at a ratio of 8% only (3/37). Unlike the other layers, in layer VI, nearly 40% (12/31) of the VIP synapses were on somata, which was much higher than in all the other layers. Nevertheless, dendrites were still the major targeted profile (58%) (18/31). Only 3% (1/31) of the synapses were found on spines.
VIP Bouton Targeting Shows Layer-Selective Features
Using a threshold of 11.1 grains/μm2 as determined by closest point to (0,1) on the dendritic ROC curve, immunopositive rates were estimated for the dendrite and spine targets (Fig. 5A). We found that 37% of the dendrites innervated by VIP boutons were immunopositive when pooled over all cortical layers. As expected, most of the spines (93%) were immunonegative. Using a threshold of 8.5 grains/μm2 for somatic structures determined by the same method, we found that 26% of the targeted somata were immunopositive (Fig. 5A). For the main targets “dendrite”, the immunopositive rate was calculated for the individual layers (Fig. 5B): in layer I, only 29% of the targeted dendrites were immunopositive whereas in layers II/III and IV the ratio slightly increased to 34%, similar to layer VI (39%). In layer V this value showed a peak of 48%. For the somatic targets, the immunopositive rate also varied across layers: none in layer I, 17% (1/6) in layer II/III, 50% (3/6) in layer IV, 67% (2/3) in layer V and 8% (1/12) in layer VI. Due to the limited sample of axosomatic synapses, the targeting specificity onto interneuron somata needs to be scrutinized in future studies.
Figure 5.

GABA-labeling of the postsynaptic targets. (A) Majority of the targeted structures of VIP boutons are found to be immunonegative (GABA–). (B) Percentage of layer-specific immunopositive (GABA+) dendritic targets. Layers V and VI have the two highest immunopositive target rates. (C) Box plots of gold grain density of the VIP boutons targeting dendrites. Mann–Whitney U test shows a significant difference between superficial layers (layers I–IV) and deep layers (layers V–VI) with P value (superficial layers vs deep layers) < 0.001 and no significant difference (n.s.) within the superficial and deep layers. (D) Probability density distributions of the dataset in (C) by kernel density estimation. In superficial layers, distributions are more concentrated at around 1, which equals to background. In deep layers, however, distributions are more dispersed and most of the values are shifted to larger than 1, indicating that the labeling density in deep layers is higher than background.
Superficial Layers
Layer I: This layer houses numerous “top-down” inputs and the somata of several types of GABAergic interneurons. Thus, in the extensive neuropil, numerous gold-labeled structures were found (Fig. 6A). In layer I, a third of the targets were immunopositive dendrites (Fig. 6B) and two-thirds were immunonegative dendrites (Fig. 6C). From the sampled synapses, we did not find any VIP boutons targeting the cell bodies of GABAergic interneurons in layer I.
Figure 6.

Targets of VIP boutons in layer I. (A) Immunogold labeling of GABA in the neuropil of layer I. The labeled structures above threshold are an axon (a), two axonal terminals (at1, at2), and two dendrites (d1, d3); d2 is the unlabeled dendrite. (B) VIP bouton targets an immunonegative dendrite (d), which further receives an asymmetric axonal terminal (at). (C) VIP bouton targets an immunopositive dendrite (d). as: astrocytic profile. Scale bars = 0.5 μm in A–C.
Layer II/III: In this “associative” layer, we found the dendritic immunopositive rate was also only around one-third. Upon visual inspection, most of the targeted dendrites could already be differentiated by the gold grain labeling as immunonegative (Fig. 7A,B) and immunopositive ones (Fig. 7D,F). Serial sections of the targeted large-caliber immunonegative dendrite in Figure 7B showed a spine protrusion on the opposite side of the VIP synapse (data not shown). It had a vertical orientation, implying that it belonged to an apical dendrite of a pyramidal cell. Although there exist sparsely spiny GABAergic non-pyramidal cells in primary sensory cortex (DeFelipe et al. 2013), the very sparse gold labeling on the targeted spines (Fig. 7C) indicates that most of them come from non-GABAergic pyramidal cells. On targeted immunopositive dendrites, we usually found asymmetric excitatory synapses in the vicinity of symmetric VIP synapses (Fig. 7F). For the axosomatic innervation, VIP boutons targeted preferentially immunonegative neurons, which are likely to be layer II/III pyramidal neurons. This finding is supported by the axosomatic synapse found on the cell body of an identified layer II/III pyramidal neuron in separate correlated light and electron microscopic studies (see Supplementary Fig. 4).
Figure 7.

Targets of VIP boutons in layer II/III. (A) VIP bouton forms a symmetric synapse (white arrows) on an immunonegative dendrite (d). (B) Another symmetric synapse is formed on a thick immunonegative dendrite by a single VIP bouton. (C) VIP synapse on immunonegative spine (s). as: astrocytic process. (D) VIP bouton targets an immunopositive dendrite. (E, F) VIP bouton innervates a longitudinally cut small-caliber dendrite (d1); for the cross-sectional dendrite (d2), a synaptic cleft is not clear due to an oblique cutting angle. Both dendrites are immunopositive and receive asymmetric synapses (black arrows) from excitatory axonal terminals (at1, at2) in the vicinity. Scale bars = 0.5 μm in A–D, F; 1 μm in E.
Layer IV: In this major input layer of cortical columns, VIP boutons targeted mainly immunonegative dendrites (Fig. 8A1, A2, B) like in layer II/III. Small immunopositive dendrites (Fig. 8C) as well as spines and somata were innervated to a smaller extent. For the somatic innervation, GABAergic interneurons were targeted with an increasing ratio in layer IV as compared with layer II/III.
Figure 8.

Targets of VIP boutons in layer IV. (A1–2) Consecutive sections of a large VIP bouton making a symmetric synapse (white arrows) on an immunonegative dendrite (d). (B) VIP bouton forms two synapses on immunonegative dendrites (d1, d2). (C) A very small immunopositive dendrite is innervated by a VIP bouton and an excitatory axonal terminal (at) (black arrow). Scale bars = 0.5 μm in A–C.
Deep Layers
Layer V: This layer is considered to be the major output layer of the neocortex. It had the highest proportion of VIP boutons synapsing onto immunopositive dendrites. Compared with the labeling over spiny immunonegative dendrites (Fig. 9A1,A2), intensive labeling was found over the aspiny immunopositive dendrites (Fig. 9B1,B2,C). In addition, the somatic immunopositive ratio was also the highest among all cortical layers. Since layer V is the one most populated by Martinotti cells, which belong to the group of SOM expressing interneurons (Wang et al. 2004), the targeted immunopositive dendrites as well as somata might belong to Martinotti cells. Interestingly, correlated light and electron microscopic examination showed a synapse onto an identified layer VI pyramidal neuron at its distal apical dendritic domain, which might be a representative of the synapses onto immunonegative dendrites in layer V in the quantitative EM study (Supplementary Fig. 5). Similar to the finding in layer II/III, the targeted immunopositive dendrites in layer V tend to receive excitatory input beside the symmetric VIP synapses (Fig. 9C).
Figure 9.

Targets of VIP boutons in layer V. (A1–2) Consecutive sections show a VIP bouton which innervates an immunonegative dendrite (d; white arrows indicate the active zone). In (A1) the dendrite protrudes an elongated spine (s1). Right above there is an excitatory axospinous synapse and the postsynaptic density (black arrows in A1) has a perforation. (B) Consecutive sections show one large VIP bouton which forms a symmetric synapse with an immunopositive dendrite, densely labeled by gold grains. (C) VIP bouton targets an immunopositive dendrite which is also innervated by two excitatory axonal terminals in the vicinity (at1, at2). Scale bars = 0.5 μm in A–C.
Layer VI: Interestingly, in this “gain control” layer, as shown in Figure 10, somatic synapses were usually formed by more than one VIP bouton per soma, for both non-GABAergic principal cells (Fig. 10A,B1,B2) and GABAergic neurons (Fig. 10C,D1,D2). In contrast to layer V, the somatic immunopositive ratio was the lowest among cortical layers. This result indicates VIP interneurons preferentially target perisomatic regions of excitatory principal neurons in layer VI. Since layer VI has the morphologically most diverse principal neurons (Andjelic et al. 2009), it will be interesting to know which subtypes they innervate.
Figure 10.

Targets of VIP boutons in layer VI. (A) Low magnification image of a peripheral part of an excitatory cell soma surrounded by three VIP boutons (b1–b3) and three labeled axonal terminals (at1–at3). Puncta adherentes (white arrowheads) are differentiated from synaptic junctions (white arrows) as shown in the inset. (B1–2) Ultrastructure of somatic synapses formed by VIP bouton (b2) in (B1) and the labeled axonal terminal (at1) in (B2). (C) Low magnification image of an interneuron soma targeted by two VIP boutons (b1, b2), which enwrap a dendrite (d). Double arrows indicate indentations of the nucleus (ncl). (D1–2) Higher magnification images of two consecutive sections through the boutons in (C) showing the axosomatic synaptic junctions. cyt: cytoplasm. Scale bars = 2 μm in A; 0.5 μm in B1–2; 2.5 μm in C; 1 μm in D1–2.
Statistical Comparison of Superficial Versus Deep Layers
Since dendrites are the main structure targeted by VIP interneurons, we compared their GABA labeling across layers in order to test whether there is a layer-dependent difference in dendritic targeting. Supplementary Table 2 reports the first quartile (Q25), median, and third quartile (Q75) of the gold grain density. However, we did not find a significant difference in terms of the density distribution among the targeted dendrites across layers (Supplementary Fig. 1C,D; One-way ANOVA on ranks, H = 8.63, df = 4, P = 0.07). The reason is possibly due to variations in background labeling between different animals and experimental batches. To avoid the influence of these variabilities, we used normalized gold grain density instead of the original density. Normalization was performed for each staining by dividing the gold grain density of a targeted dendrite by the mean density of surrounding spines. Again Supplementary Table 2 shows the first quartile (Q25-N), median-N, and third quartile (Q75-N) of the normalized density. Similarly, one-way ANOVA on ranks test was used and we found a significant difference in terms of the distributions of the normalized density across layers (Fig. 5C,D; H = 21.28, df = 4, P < 0.001).
To further evaluate which specific layers caused this difference, we used a post hoc Dunn's test with Bonferroni correction to compare each layer. There was a highly significant difference between layers II/III and V (z = −3.77, P < 0.001) and layers II/III and VI (z = −3.12, P < 0.001). Between layers I and V, there was also a significant difference (z = −2.75, P = 0.03). For the rest of the layers, we did not find statistically significant differences. Furthermore, more targeted dendrites had high GABA labeling in deep than superficial layers when we compared the distributions of the grouped normalized density using Mann–Whitney U test (Fig. 5C,D; Usuperficial layers vs deep layers = 1608, P < 0.001). In addition, we did not find a difference in terms of GABA labeling over the sampled interneuron dendrites between superficial and deep layers (data not shown). Thus, these results indicate that VIP interneurons have a differential dendritic targeting property: compared with superficial layers, in deep layers a higher proportion of innervation is found on GABAergic than non-GABAergic dendrites.
VIP Bouton Targeting of Pyramidal Cells as Shown by Correlated Light and Electron Microscopy
Since the described data obtained by pre-embedding VIP staining and postembedding GABA immunolabeling did suggest that GABA immunonegative subcellular profiles represent the majority of VIP cell targets, we wanted to obtain direct morphological evidence for this innervation. We performed proof-of-principle experiments by stereotaxically injecting rabies virus of the SAD∆G-EGFP-(CVS-G) strain (Wickersham et al. 2007) into the barrel cortex and thus ipsilaterally labeling the population of short- and long-range projecting associative pyramidal cells (Larsen et al. 2007). Tissue more than 1 mm away from the injection site (but still within the confines of the barrel cortex, with few if any confounding retrogradely labeled GABAergic neurons being present) was analyzed. Since the pyramidal cells were labeled in a Golgi-like manner, it was easy to unequivocally identify them on the basis of their distinctive morphology, e.g., spine-rich apical and basal dendrites and pyramidal shaped cell bodies (see Supplementary Figs. 4–5).
The color-contrast between the DAB-nickel-labeled VIP boutons (blue-black) and the DAB-stained pyramidal cells (brown) was sufficient to map the location of all VIP boutons on the somatodendritic domain of one example cell in layer II/III (see Supplementary Fig. 4) and one in layer VI (see Supplementary Fig. 5). On the basis of optimal orientation of presynaptic bouton and postsynaptic compartment, to section the synaptic cleft in an orthogonal (and thus unambiguous) manner, we selected a somatic synapse on the layer II/III pyramidal cell (see Supplementary Fig. 4) and a dendritic synapse on the layer VI pyramidal neuron for correlation in the electron microscope. These preliminary results motivate further studies to fully map the number and localization of VIP synapses on the pyramidal cells, in a subcellular manner (cf. Bloss et al. 2016).
Discussion
Recently, several in vivo studies showed that VIP interneurons play a critical role in regulating top-down control of sensory motor integration (Lee et al. 2013), reinforcement- or locomotion-induced gain control of sensory input (Pi et al. 2013; Fu et al. 2014) and working memory-guided behavior (Kamigaki and Dan 2017) in various cortical regions. One underlying microcircuit is a disinhibitory motif, which relies on the inhibition of inhibitory interneurons, preferentially SOM expressing Martinotti cells, and results in a selective increase of pyramidal neuron activity. However, the disinhibitory motif failed to explain all neuronal computations when studied under refined behavioral conditions (Pakan et al. 2016). Due to the diversity of the axonal innervation of VIP interneurons (Prönneke et al. 2015), it is unlikely to expect a singular VIP-to-Martinotti cell circuit. In fact, both in vivo and in vitro functional studies show that pyramidal neurons can be directly inhibited by VIP interneurons (Jiang et al. 2013; Lee et al. 2013; Garcia-Junco-Clemente et al. 2017; Pfeffer et al. 2013). In our quantitative immunoelectron microscopic study, we found that in the mouse barrel cortex, VIP interneurons target mainly dendrites, around two-third being non-GABAergic and only one-third being GABAergic. In addition, there is a layer-dependent targeting of VIP boutons on different subcellular compartments. Consistent with earlier anatomical study by Peters (1990), our study gives the first quantitative estimation of targeting specificity of neocortical VIP interneurons. The findings suggest multiple output circuits with multiple functionality of VIP neurons in local neural networks.
Technical Considerations
Pre-embedding Anti-YFP Staining
The morphology of VIP interneurons and their cortical distribution was consistent with previous studies in rodents (Bayraktar et al. 2000; Prönneke et al. 2015). Prönneke et al. (2015) recently confirmed the specificity and sensitivity of Cre expression in VIP cells of the VIP-ires-Cre driver mouse line, as proposed by Taniguchi et al. (2011). Therefore, our anti-YFP immunostaining in VIP-Cre-Rosa-YFP mice is very likely to detect the entire population of VIP cells in every cellular detail. Using an osmium-intensified DAB reaction, sections contained extensively stained subcellular structures, from which somata, dendrites and axons with their boutons could be easily discerned by correlated light and electron microscopy. Compared with previous work using non-genetic means (Acsády et al. 1996; Bayraktar et al. 2000), our staining yielded a complete visualization of axons and boutons. Even at the high concentration of fixative necessary to obtain a suitable GABA labeling efficiency, the antigenicity of YFP was well preserved and could be reliably detected by our pre-embedding anti-YFP staining protocol.
Postembedding Anti-GABA Immunogold Labeling
Anti-GABA immunogold labeling is sensitive to various factors of the histological procedure including fixative concentration, embedding material and antibody efficiency (Griffiths and Lucocq 2014). In order to label small molecules like GABA, it is necessary to use a sufficiently high concentration of glutaraldehyde (Bergersen et al. 2008). In our study, after increasing glutaraldehyde concentration to 1%, we achieved reliable GABA immunolabeling. Since our protocol used conventional dehydration and epoxy embedding, the labeling efficiency is not as high as obtained by freeze substitution and cryo-embedding (Bergersen et al. 2008). However, the conventional method maintains a better ultrastructure and thus allows for better identification of more delicate subcellular structures.
GABA Localization
Anti-GABA postembedding immunogold labeling has been used to localize GABAergic neurons in the central nervous system, and the GABA immunoreactivity is found over different subcellular compartments of GABAergic interneurons including cell bodies, dendrites, axons, and boutons (Somogyi and Hodgson 1985). Our study is the first to quantify the immunoreactivity over different subcellular compartments in mouse barrel cortex. Structures with the strongest labeling were axon terminals, which is consistent with previous findings (Storm-Mathisen et al. 1983; Bergersen et al. 2003). We detected a decrease in GABA immunoreactivity from axon terminals to dendrites, and further to somata. This decline is probably due to the active axonal transport of GABA from the soma to axon terminals where GABA is released during synaptic transmission. On dendrites, not only GABA but also GABA transporter 2 (GAT2) was found (Conti et al. 1999). Localization of GAT2 in dendrites indicates its involvement in transporting GABA from either the extracellular space or glial cells into dendrites. Dendritic GABA may act as a retrograde messenger and retrogradely regulate synaptic transmission (Zilberter et al. 1999). This may explain why interneuron dendrites show stronger GABA immunoreactivity than somata.
In our study, gold grains were most frequently attached to mitochondria of various subcellular compartments as was shown in previous studies using immunogold methods (Beaulieu et al. 1994; Collman et al. 2015). This is probably due to the GABA metabolism that requires GABA to be transferred into mitochondria to be incorporated into the tricarbonic acid cycle (Waagepetersen et al. 2003; Roth and Draguhn 2012). GABA immunoreactivity on subcellular compartments of non-GABAergic principal cells is considered as unspecific staining and served for background determination.
ROC Curve Analysis
Antibody–antigen affinity considerably effects immunogold labeling efficiency. Although the primary anti-GABA antibody was performing well in labeling GABAergic profiles (Bickford et al. 2008), we adopted the well-established ROC statistics, which evaluates sensitivity and specificity of the staining to obtain statistically validated thresholds for GABA-immunogold labeling of the VIP boutons’ targets. Although false positive rate (0.16) and false negative rate (0.14) were close to each other at the chosen threshold, there might be still an underestimation of immunopositive ratio among the targeted small-caliber dendrites because previous studies showed small-caliber dendrites of interneurons might not contain GABA or GABA immunoreactivity is too low to be detected (Beaulieu et al. 1994; Gonchar and Burkhalter 1999). However, since VIP interneurons were found to preferentially innervate the proximal dendrites of Martinotti cells and less likely innervated their distal dendrites (Muñoz et al. 2017), an underestimation of immunopositive ratio among small-caliber dendrites, if present, should not be the main reason for the relatively low interneuron targeting ratio. For somatic targets, at the chosen threshold, false positive rate is lower (0.17) than false negative rate (0.29). This might also result in a potential underestimation, which, however, should not affect the strength of the final conclusion.
Target Structure Distribution
Among the three different subcellular compartments of possible postsynaptic targets (dendrites, spines, and somata), dendrites are the main structures innervated across all cortical layers. This result is not surprising because many inhibitory interneurons innervate the dendritic shaft as their major target domain (Kubota et al. 2016). Interestingly, however, nearly 40% of the innervation in layer VI is onto the somatic region. A previous study showed for so-called perisomatic interneurons, like basket cells, that the axosomatic synapses comprise only 10–37% in rat frontal cortex (Kawaguchi and Kubota 1998). Thus, according to the target structure distribution, not all VIP interneurons should be considered as dendrite-targeting interneurons, at least not in layer VI, being partially in agreement with recent literature (He et al. 2016). Compared with the other two targets, there was rare innervation of spines, indicating that VIP interneurons are not spine-targeting interneurons. This would speak against VIP boutons being the primary substrate of experience-dependently remodeled inhibitory spine synapses, as recently demonstrated in the visual cortex (Villa et al. 2016).
GABAergic Versus Non-GABAergic Target Structures
We found that only 37% of the targeted dendrites belong to GABAergic neurons and most of the targeted dendrites should belong to non-GABAergic principal cells. This finding seems to be unexpected because electrophysiological data showed that VIP interneurons provide a much stronger inhibition to SOM interneurons than local pyramidal neurons and the connectivity ratio of VIP-to-pyramidal neurons is also much lower (around 12.5%) than that of VIP-to-SOM interneurons (63%) (Lee et al. 2013; Pfeffer et al. 2013). One explanation might be that VIP interneurons in barrel cortex preferentially innervate yet-to-be-determined subpopulations of pyramidal neurons and avoid the other subpopulations. The preferential innervation, if presents, can result in a low connectivity ratio when studied by paired recordings. However, for quantifying the number of synapses, the total number of synapses formed onto principal cells might be higher than onto interneurons since in neocortex approximately 80% of neurons are non-GABAergic principal cells and only approximately 20% are GABAergic interneurons. A recent study supports this hypothesis by showing a pull–push circuit computation in layer II/III of mouse prefrontal cortex, in which during arousal, activation of VIP interneurons decreased the activity of a subpopulation of pyramidal neurons via direct inhibition whereas it increased the activity of another subpopulation via disinhibition (Garcia-Junco-Clemente et al. 2017).
Another possible explanation could be that VIP interneurons preferentially inhibit layer V and mostly avoid layer II/III pyramidal neuron dendrites in mouse barrel cortex. Some innervated immunopositive dendrites clearly resembled apical dendrites of pyramidal neurons as they had a large caliber, spine protrusions, and a radial orientation. Functional studies showed that layer II/III interneurons inhibit the apical dendrites of layer V pyramidal neurons (Jiang et al. 2013). Unfortunately, we cannot provide direct morphological evidence for the precise origin of the immunonegative dendrites and which cell types they belong to, as it was not possible to fully reconstruct the dendrites in our large-sized serial ultrathin sections. However, the proof-of-principle VIP synapses onto different membrane domains of rabies virus-labeled pyramidal neurons partially compensates this drawback and opens an avenue to quantitatively analyze the layer-specific innervation of pyramidal cells by VIP boutons.
For the innervation of interneurons, proximal dendrites as well as somata are more likely to be targeted by VIP boutons (Dávid et al. 2007; Hioki et al. 2013; Muñoz et al. 2017). The targeted cell types could belong to both SOM and PV interneurons; however, we cannot differentiate them without further specific labeling. The neighboring excitatory synapses usually have a close geometric distance to the VIP synapses onto the targeted GABAergic dendrites. The cluster of excitatory and inhibitory synapses should let VIP interneurons efficiently attenuate the dendritic excitability of the targeted cells (Kubota et al. 2016). Interestingly, a novel type of PV expressing interneuron in layer VI has recently been described, which is a central node for gain control in visual processing (Bortone et al. 2014). It remains however to be shown whether VIP boutons directly synapse on this type of layer VI interneuron.
Layer-Dependent Targeting
We find that there is layer-dependent differential subcellular targeting of VIP boutons, suggesting that there is more than one motif recruiting VIP interneurons into local intra- and translaminar circuits of mouse barrel cortex. For the dendritic targeting, in layer II/III only around one-third of the targeted dendrites are immunopositive; while in layer V this ratio increases to nearly 50%. Considering the heterogeneity of axonal projection pattern of VIP cells in superficial layers (Prönneke et al. 2015), we suggest three output motifs in layer II/III (Fig. 11): innervation of local inhibitory interneurons, presumably Martinotti cells (most of which are SOM expressing interneurons) (Lee et al. 2013; Karnani et al. 2016; Walker et al. 2016; Muñoz et al. 2017); innervation of a subpopulation of local pyramidal cells (Caputi et al. 2009; Lee et al. 2013; Jiang et al. 2015); innervation of layer V pyramidal cells, mainly at their distal apical dendrites (Jiang et al. 2013; Kubota et al. 2016).
Figure 11.
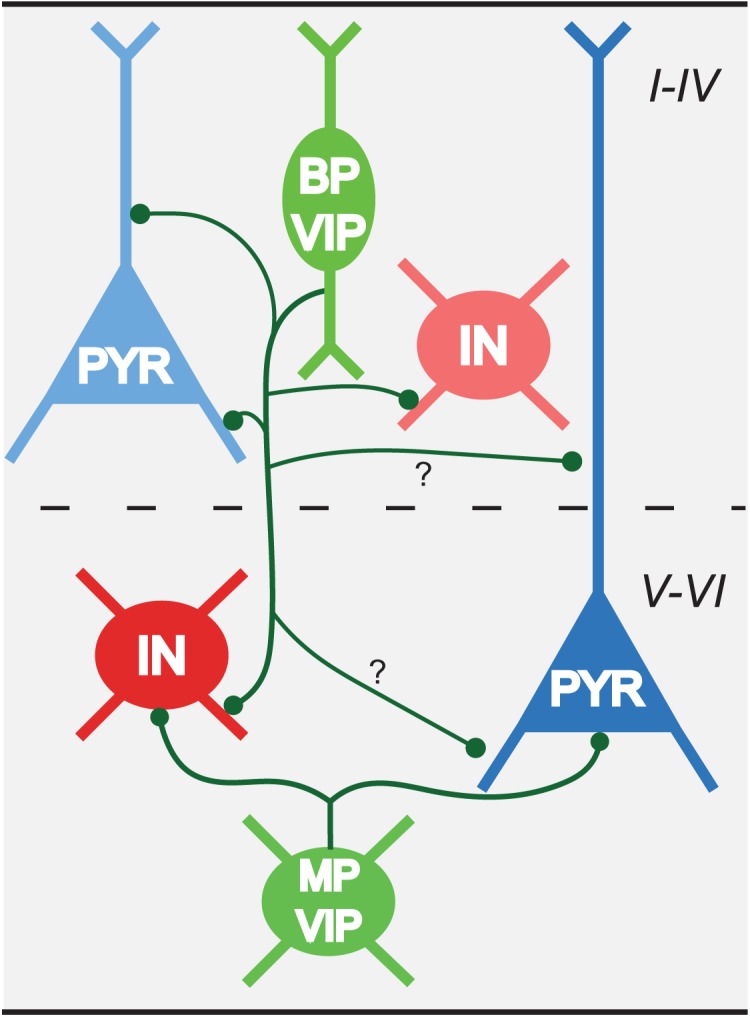
Hypothetical scheme of innervation patterns of VIP interneurons across cortical layers. A bipolar VIP neuron as the main subtype in superficial layers innervates dendrites of interneurons in all layers, in addition to subpopulations of local pyramidal cells. We hypothesize they also innervate dendrites of deep layer pyramidal cells (marked with question marks). The multipolar VIP interneurons in deep layers, some of which are likely small basket cells, preferentially form perisomatic synapses on both pyramidal cells and interneurons in deep layers. BP: bipolar; IN: interneuron; PYR: pyramidal cell; MP: multipolar.
In deep layers, with their specific set of GABAergic interneurons (Naka and Adesnik 2016), a substantial portion of VIP cells is morphologically distinct from superficial VIP cells, and their axons largely remain in deep layers (Prönneke et al. 2015). Since VIP interneurons of layer II/III also send a strong translaminar projection to deep layers, we cannot differentiate the output of deep layer VIP cells from that of the descending axonal collaterals of superficial VIP cells in our study. In deep layers, one output motif of VIP interneurons is onto dendritic domains of deep layer SOM interneurons (Fig. 11), as shown by functional connections (Walker 2016). The remaining innervated immunonegative dendrites might originate from layer V/VI pyramidal neurons (Fig. 11; Supplementary Fig. 5).
Previous studies on the partially overlapping population of CR interneurons by Gonchar and Burkhalter (1999) and Meskenaite (1997) in rat and monkey visual cortex also reported a layer-dependent targeting property. In deep layers, similar to VIP interneurons, most of the targets of CR interneurons are non-GABAergic somata, while CR interneurons have a higher targeting specificity on GABAergic dendrites in layer II/III compared with VIP interneurons. The lower interneuron-specific targeting in the present study is most likely caused by the axonal arbors of CCK expressing VIP interneurons. They at least partially are small basket cells, which target mainly the excitatory neurons at their perisomatic regions (Kawaguchi and Kubota 1996; Wang et al. 2002; Markram et al. 2004; Tremblay et al. 2016). They were found to exist in both upper layer II/III and deep layers using a newly generated VIP-Flp/CCK-Cre mouse line (He et al. 2016). For the VIP-ires-cre mice that we used, a group of layer VI multipolar VIP cells had an intralaminar axon spanning laterally that could resemble small basket cells (Bayraktar et al. 2000; Prönneke et al. 2015). Thus, in the simplified output scheme, this group is supposed to predominantly contribute to the perisomatic innervation of deep layer pyramidal neurons, especially the ones in layer VI (Fig. 11).
Significance and Perspective
The disinhibitory function of VIP interneurons was overemphasized in recent years and the direct inhibitory innervation of VIP interneurons on principal cells was disregarded, which however does exist in various cortical regions. Our study re-examined the targeting specificity of cortical VIP interneurons by unbiasedly studying their subcellular innervation in mouse barrel cortex. The findings not only gain insight into the complexity of local microcircuits, but also provide a fruitful model of structure–function relationships in cortical columns. Future studies at the quantitative level, on the subcellular innervation of VIP interneurons onto individual identified neurons, including both excitatory principal neurons and inhibitory interneurons, will clarify the details of VIP cell connectivity, thus finally gaining comprehensive insight into the workings of this once considered “enigmatic” population of GABAergic interneurons.
Supplementary Material
Notes
We thank Simona Hellbach for technical assistant. We also thank Dr Martin Möck for suggestions on statistics and critically reading the manuscript as well as all members of the Barrel Cortical Circuits group for fruitful discussions on quantification of the thresholding of GABA labeling. Thanks are due to Drs Csaba Dávid and Laszlo Acsády for initial help with postembedding immunostaining. Rabies virus was kindly provided by Klaus Conzelmann (Univ. Munich). Conflict of Interest: None declared.
Supplementary Material
Funding
The project was funded by DAAD (to X.Z.) and Deutsche Forschungsgemeinschaft (CRC 889, Subproject 7; to J.F.S.).
References
- Acsády L, Görcs TJ, Freund TF. 1996. Different populations of vasoactive intestinal polypeptide-immunoreactive interneurons are specialized to control pyramidal cells or interneurons in the hippocampus. Neuroscience. 73:317–334. [DOI] [PubMed] [Google Scholar]
- Andjelic S, Gallopin T, Cauli B, Hill EL, Roux L, Badr S, Hu E, Tamás G, Lambolez B. 2009. Glutamatergic nonpyramidal neurons from neocortical layer VI and their comparison with pyramidal and spiny stellate neurons. J Neurophysiol. 101:641–654. [DOI] [PMC free article] [PubMed] [Google Scholar]
- Ascoli GA, Alonso-Nanclares L, Anderson SA, Barrionuevo G, Benavides-Piccione R, Burkhalter A, Buzsáki G, Cauli B, DeFelipe J, Fairén A, et al. 2008. Petilla terminology: nomenclature of features of GABAergic interneurons of the cerebral cortex. Nat Rev Neurosci. 9:557–568. [DOI] [PMC free article] [PubMed] [Google Scholar]
- Bayraktar T, Welker E, Freund TF, Zilles K, Staiger JF. 2000. Neurons immunoreactive for vasoactive intestinal polypeptide in the rat primary somatosensory cortex: morphology and spatial relationship to barrel-related columns. J Comp Neurol. 420:291–304. [PubMed] [Google Scholar]
- Beaulieu C, Campistron G, Crevier C. 1994. Quantitative aspects of the GABA circuitry in the primary visual cortex of the adult rat. J Comp Neurol. 339:559–572. [DOI] [PubMed] [Google Scholar]
- Bergersen L, Ruiz A, Bjaalie JG, Kullmann DM, Gundersen V. 2003. GABA and GABAA receptors at hippocampal mossy fibre synapses. Eur J Neurosci. 18:931–941. [DOI] [PubMed] [Google Scholar]
- Bergersen LH, Storm-Mathisen J, Gundersen V. 2008. Immunogold quantification of amino acids and proteins in complex subcellular compartments. Nat Protoc. 3:144–152. [DOI] [PubMed] [Google Scholar]
- Bickford ME, Wei H, Eisenback MA, Chomsung RD, Slusarczyk AS, Dankowsi AB. 2008. Synaptic organization of thalamocortical axon collaterals in the perigeniculate nucleus and dorsal lateral geniculate nucleus. J Comp Neurol. 508:264–285. [DOI] [PMC free article] [PubMed] [Google Scholar]
- Bloss EB, Cembrowski MS, Karsh B, Colonell J, Fetter RD, Spruston N. 2016. Structured dendritic inhibition supports branch-selective integration in CA1 pyramidal cells. Neuron. 89:1016–1030. [DOI] [PubMed] [Google Scholar]
- Bortone DS, Olsen SR, Scanziani M. 2014. Translaminar inhibitory cells recruited by layer 6 cortico-thalamic neurons suppress visual cortex. Neuron. 82:474–485. [DOI] [PMC free article] [PubMed] [Google Scholar]
- Caputi A, Rozov A, Blatow M, Monyer H. 2009. Two calretinin-positive GABAergic cell types in layer 2/3 of the mouse neocortex provide different forms of inhibition. Cereb Cortex. 19:1345–1359. [DOI] [PubMed] [Google Scholar]
- Cauli B, Zhou X, Tricoire L, Toussay X, Staiger JF. 2014. Revisiting enigmatic cortical calretinin-expressing interneurons. Front Neuroanat. 8:52. [DOI] [PMC free article] [PubMed] [Google Scholar]
- Collman F, Buchanan J, Phend KD, Micheva KD, Weinberg RJ, Smith SJ. 2015. Mapping synapses by conjugate light-electron array tomography. J Neurosci. 35:5792–5807. [DOI] [PMC free article] [PubMed] [Google Scholar]
- Conti F, Zuccarello LV, Barbaresi P, Minelli A, Brecha NC, Melone M. 1999. Neuronal, glial, and epithelial localization of γ-aminobutyric acid transporter 2, a high-affinity γ-aminobutyric acid plasma membrane transporter, in the cerebral cortex and neighboring structures. J Comp Neurol. 409:482–494. [PubMed] [Google Scholar]
- Dávid C, Schleicher A, Zuschratter W, Staiger JF. 2007. The innervation of parvalbumin-containing interneurons by VIP-immunopositive interneurons in the primary somatosensory cortex of the adult rat. Eur J Neurosci. 25:2329–2340. [DOI] [PubMed] [Google Scholar]
- DeFelipe J, López-Cruz PL, Benavides-Piccione R, Bielza C, Larrañaga P, Anderson S, Burkhalter A, Cauli B, Fairén A, Feldmeyer D, et al. 2013. New insights into the classification and nomenclature of cortical GABAergic interneurons. Nat Rev Neurosci. 14:202–216. [DOI] [PMC free article] [PubMed] [Google Scholar]
- Fawcett T. 2006. An introduction to ROC analysis. Pattern Recogn Lett. 27:861–874. [Google Scholar]
- Feldmeyer D, Qi G, Emmenegger V, Staiger JF. 2017. Inhibitory interneurons and their circuit motifs in the many layers of the barrel cortex. Neuroscience. (in press) [DOI] [PubMed] [Google Scholar]
- Fu Y, Tucciarone JM, Espinosa JS, Sheng N, Darcy DP, Nicoll RA, Huang ZJ, Stryker MP. 2014. A cortical circuit for gain control by behavioral state. Cell. 156:1139–1152. [DOI] [PMC free article] [PubMed] [Google Scholar]
- Garcia-Junco-Clemente P, Ikrar T, Tring E, Xu X, Ringach DL, Trachtenberg JT. 2017. An inhibitory pull-push circuit in frontal cortex. Nat Neurosci. 20:389–392. [DOI] [PMC free article] [PubMed] [Google Scholar]
- Gonchar Y, Burkhalter A. 1999. Connectivity of GABAergic calretinin-immunoreactive neurons in rat primary visual cortex. Cereb Cortex. 9:683–696. [DOI] [PubMed] [Google Scholar]
- Griffiths G, Lucocq JM. 2014. Antibodies for immunolabeling by light and electron microscopy: not for the faint hearted. Histochem Cell Biol. 142:347–360. [DOI] [PMC free article] [PubMed] [Google Scholar]
- Hagendorf N, Conzelmann K-K. 2015. Recombinant fluorescent rabies virus vectors for tracing neurons and synaptic connections. Cold Spring Harb Protoc. 2015:pdb.top089391. [DOI] [PubMed] [Google Scholar]
- Harris KD, Mrsic-Flogel TD. 2013. Cortical connectivity and sensory coding. Nature. 503:51–58. [DOI] [PubMed] [Google Scholar]
- He M, Tucciarone J, Lee S, Nigro MJ, Kim Y, Levine JM, Kelly SM, Krugikov I, Wu P, Chen Y, et al. 2016. Strategies and tools for combinatorial targeting of GABAergic neurons in mouse cerebral cortex. Neuron. 91:1228–1243. [DOI] [PMC free article] [PubMed] [Google Scholar]
- Hioki H, Okamoto S, Konno M, Kameda H, Sohn J, Kuramoto E, Fujiyama F, Kaneko T. 2013. Cell type-specific inhibitory inputs to dendritic and somatic compartments of parvalbumin-expressing neocortical interneuron. J Neurosci. 33:544–555. [DOI] [PMC free article] [PubMed] [Google Scholar]
- Jiang X, Wang G, Lee AJ, Stornetta RL, Zhu JJ. 2013. The organization of two novel cortical interneuronal circuits. Nat Neurosci. 16:210–218. [DOI] [PMC free article] [PubMed] [Google Scholar]
- Jiang X, Shen S, Cadwell CR, Berens P, Sinz F, Ecker AS, Patel S, Tolias AS. 2015. Principles of connectivity among morphologically defined cell types in adult neocortex. Science. 350:aac9462. [DOI] [PMC free article] [PubMed] [Google Scholar]
- Kamigaki T, Dan Y. 2017. Delay activity of specific prefrontal interneuron subtypes modulates memory-guided behavior. Nat Neurosci. 20:854–863. [DOI] [PMC free article] [PubMed] [Google Scholar]
- Karnani MM, Jackson J, Ayzenshtat I, Sichani AH, Manoocheri K, Kim S, Yuste R. 2016. Opening holes in the blanket of inhibition: localized lateral disinhibition by VIP interneurons. J Neurosci. 36:3471–3480. [DOI] [PMC free article] [PubMed] [Google Scholar]
- Kawaguchi Y, Kubota Y. 1996. Physiological and morphological identification of somatostatin- or vasoactive intestinal polypeptide-containing cells among GABAergic cell subtypes in rat frontal cortex. J Neurosci. 16:2701–2715. [DOI] [PMC free article] [PubMed] [Google Scholar]
- Kawaguchi Y, Kubota Y. 1998. Neurochemical features and synaptic connections of large physiologically-identified GABAergic cells in the rat frontal cortex. Neuroscience. 85:677–701. [DOI] [PubMed] [Google Scholar]
- Klausberger T, Somogyi P. 2008. Neuronal diversity and temporal dynamics: the unity of hippocampal circuit operations. Science. 321:53–57. [DOI] [PMC free article] [PubMed] [Google Scholar]
- Kubota Y, Hatada SN, Kawaguchi Y. 2009. Important factors for the three-dimensional reconstruction of neuronal structures from serial ultrathin sections. Front Neural Circuits. 3:4. [DOI] [PMC free article] [PubMed] [Google Scholar]
- Kubota Y, Shigematsu N, Karube F, Sekigawa A, Kato S, Yamaguchi N, Hirai Y, Morishima M, Kawaguchi Y. 2011. Selective coexpression of multiple chemical markers defines discrete populations of neocortical GABAergic neurons. Cereb Cortex. 21:1803–1817. [DOI] [PubMed] [Google Scholar]
- Kubota Y, Karube F, Nomura M, Kawaguchi Y. 2016. The diversity of cortical inhibitory synapses. Front Neural Circuits. 10:27. [DOI] [PMC free article] [PubMed] [Google Scholar]
- Lake BB, Ai R, Kaeser GE, Salathia NS, Yung YC, Liu R, Wildberg A, Gao D, Fung HL, Chen S, et al. 2016. Neuronal subtypes and diversity revealed by single-nucleus RNA sequencing of the human brain. Science. 352:1586–1590. [DOI] [PMC free article] [PubMed] [Google Scholar]
- Larsen DD, Wickersham IR, Callaway EM. 2007. Retrograde tracing with recombinant rabies virus reveals correlations between projection targets and dendritic architecture in layer 5 of mouse barrel cortex. Front Neural Circuits. 1:5. [DOI] [PMC free article] [PubMed] [Google Scholar]
- Lee S, Kruglikov I, Huang ZJ, Fishell G, Rudy B. 2013. A disinhibitory circuit mediates motor integration in the somatosensory cortex. Nat Neurosci. 16:1662–1670. [DOI] [PMC free article] [PubMed] [Google Scholar]
- Madisen L, Zwingman TA, Sunkin SM, Oh SW, Zariwala HA, Gu H, Ng LL, Palmiter RD, Hawrylycz MJ, Jones AR, et al. 2010. A robust and high-throughput Cre reporting and characterization system for the whole mouse brain. Nat Neurosci. 13:133–140. [DOI] [PMC free article] [PubMed] [Google Scholar]
- Markram H, Toledo-Rodriguez M, Wang Y, Gupta A, Silberberg G, Wu C. 2004. Interneurons of the neocortical inhibitory system. Nat Rev Neurosci. 5:793–807. [DOI] [PubMed] [Google Scholar]
- Meskenaite V. 1997. Calretinin-immunoreactive local circuit neurons in area 17 of the cynomolgus monkey, Macaca fascicularis. J Comp Neurol. 379:113–132. [PubMed] [Google Scholar]
- Muñoz W, Tremblay R, Levenstein D, Rudy B. 2017. Layer-specific modulation of neocortical dendritic inhibition during active wakefulness. Science. 355:954–959. [DOI] [PubMed] [Google Scholar]
- Naka A, Adesnik H. 2016. Inhibitory circuits in cortical layer 5. Front Neural Circuits. 10:35. [DOI] [PMC free article] [PubMed] [Google Scholar]
- Ottersen OP. 1987. Postembedding light- and electron microscopic immunocytochemistry of amino acids: description of a new model system allowing identical conditions for specificity testing and tissue processing. Exp Brain Res. 69:167–174. [DOI] [PubMed] [Google Scholar]
- Pakan JM, Lowe SC, Dylda E, Keemink SW, Currie SP, Coutts CA, Rochefort NL. 2016. Behavioral-state modulation of inhibition is context-dependent and cell type specific in mouse visual cortex. Elife. 5:pii: e14985. [DOI] [PMC free article] [PubMed] [Google Scholar]
- Peters A. 1990. The axon terminals of vasoactive intestinal polypeptide (VIP)-containing bipolar cells in rat visual cortex. J Neurocytol. 19:672–685. [DOI] [PubMed] [Google Scholar]
- Peters A, Palay SL, Webster HD. 1991. The fine structure of the nervous system In: Neurons and their supporting cells. New York: Oxford University Press. [Google Scholar]
- Pfeffer CK, Xue M, He M, Huang ZJ, Scanziani M. 2013. Inhibition of inhibition in visual cortex: the logic of connections between molecularly distinct interneurons. Nat Neurosci. 16:1068–1076. [DOI] [PMC free article] [PubMed] [Google Scholar]
- Pfeffer CK. 2014. Inhibitory neurons: VIP cells hit the brake on inhibition. Curr Biol. 24:R18–R20. [DOI] [PubMed] [Google Scholar]
- Pi H-J, Hangya B, Kvitsiani D, Sanders JI, Huang ZJ, Kepecs A. 2013. Cortical interneurons that specialize in disinhibitory control. Nature. 503:521–524. [DOI] [PMC free article] [PubMed] [Google Scholar]
- Prönneke A, Scheuer B, Wagener RJ, Möck M, Witte M, Staiger JF. 2015. Characterizing VIP neurons in the barrel cortex of VIPcre/tdTomato mice reveals layer-specific differences. Cereb Cortex. 25:4854–4868. [DOI] [PMC free article] [PubMed] [Google Scholar]
- Richardson KC, Jarett L, Finke EH. 1960. Embedding in epoxy resins for ultrathin sectioning in electron microscopy. Stain Technol. 35:313–325. [DOI] [PubMed] [Google Scholar]
- Roth FC, Draguhn A. 2012. GABA metabolism and transport: effects on synaptic efficacy. Neural Plast. 2012. [DOI] [PMC free article] [PubMed] [Google Scholar]
- Rudy B, Fishell G, Lee S, Hjerling-Leffler J. 2011. Three groups of interneurons account for nearly 100% of neocortical GABAergic neurons. Dev Neurobiol. 71:45–61. [DOI] [PMC free article] [PubMed] [Google Scholar]
- Schindelin J, Arganda-Carreras I, Frise E, Kaynig V, Longair M, Pietzsch T, Preibisch S, Rueden C, Saalfeld S, Schmid B, et al. 2012. Fiji: an open-source platform for biological-image analysis. Nat Meth. 9:676–682. [DOI] [PMC free article] [PubMed] [Google Scholar]
- Sing T, Sander O, Beerenwinkel N, Lengauer T. 2005. ROCR: visualizing classifier performance in R. Bioinformatics. 21:3940–3941. [DOI] [PubMed] [Google Scholar]
- Sloviter RS, Valiquette G, Abrams GM, Ronk EC, Sollas AL, Paul LA, Neubort S. 1989. Selective loss of hippocampal granule cells in the mature rat brain after adrenalectomy. Science. 243:535–538. [DOI] [PubMed] [Google Scholar]
- Sohn J, Okamoto S, Kataoka N, Kaneko T, Nakamura K, Hioki H. 2016. Differential inputs to the perisomatic and distal-dendritic compartments of VIP-positive neurons in layer 2/3 of the mouse barrel cortex. Front Neuroanat. 10:124. [DOI] [PMC free article] [PubMed] [Google Scholar]
- Somogyi P, Hodgson AJ. 1985. Antisera to gamma-aminobutyric acid. III. Demonstration of GABA in Golgi-impregnated neurons and in conventional electron microscopic sections of cat striate cortex. J Histochem Cytochem. 33:249–257. [DOI] [PubMed] [Google Scholar]
- Staiger JF, Zilles K, Freund TF. 1996. Innervation of VIP-immunoreactive neurons by the ventroposteromedial thalamic nucleus in the barrel cortex of the rat. J Comp Neurol. 367:194–204. [DOI] [PubMed] [Google Scholar]
- Staiger JF, Masanneck C, Schleicher A, Zuschratter W. 2004. Calbindin-containing interneurons are a target for VIP-immunoreactive synapses in rat primary somatosensory cortex. J Comp Neurol. 468:179–189. [DOI] [PubMed] [Google Scholar]
- Staiger JF, Bojak I, Miceli S, Schubert D. 2015. A gradual depth-dependent change in connectivity features of supragranular pyramidal cells in rat barrel cortex. Brain Struct Funct. 220:1317–1337. [DOI] [PMC free article] [PubMed] [Google Scholar]
- Storm-Mathisen J, Leknes AK, Bore AT, Vaaland JL, Edminson P, Haug F-MŠ, Ottersen OP. 1983. First visualization of glutamate and GABA in neurones by immunocytochemistry. Nature. 301:517–520. [DOI] [PubMed] [Google Scholar]
- Taniguchi H, He M, Wu P, Kim S, Paik R, Sugino K, Kvitsani D, Fu Y, Lu J, Lin Y, et al. 2011. A resource of Cre driver lines for genetic targeting of GABAergic neurons in cerebral cortex. Neuron. 71:995–1013. [DOI] [PMC free article] [PubMed] [Google Scholar]
- Tasic B, Menon V, Nguyen TN, Kim TK, Jarsky T, Yao Z, Levi B, Gray LT, Sorensen SA, Dolbeare T, et al. 2016. Adult mouse cortical cell taxonomy revealed by single cell transcriptomics. Nat Neurosci. 19:335–346. [DOI] [PMC free article] [PubMed] [Google Scholar]
- Tremblay R, Lee S, Rudy B. 2016. GABAergic interneurons in the neocortex: from cellular properties to circuits. Neuron. 91:260–292. [DOI] [PMC free article] [PubMed] [Google Scholar]
- Villa KL, Berry KP, Subramanian J, Cha JW, Oh WC, Kwon HB, Kubota Y, So PTC, Nedivi E. 2016. Inhibitory synapses are repeatedly assembled and removed at persistent sites in vivo. Neuron. 89:756–769. [DOI] [PMC free article] [PubMed] [Google Scholar]
- Waagepetersen HS, Sonnewald U, Schousboe A. 2003. Compartmentation of glutamine, glutamate, and GABA metabolism in neurons and astrocytes: functional implications. Neuroscientist. 9:398–403. [DOI] [PubMed] [Google Scholar]
- Walker F, Möck M, Feyerabend M, Guy J, Wagener RJ, Schubert D, Staiger JF, Witte M. 2016. Parvalbumin- and vasoactive intestinal polypeptide-expressing neocortical interneurons impose differential inhibition on Martinotti cells. Nat Commun. 7:13664. [DOI] [PMC free article] [PubMed] [Google Scholar]
- Walker F. 2016. Functional connectivity of layer II/III and V GABAergic Martinotti cells in the primary somatosensory (barrel) cortex of mice [Doctoral dissertation]. Retrieved from http://hdl.handle.net/11858/00-1735-0000-0028-86C9-7
- Wang Y, Gupta A, Toledo-Rodriguez M, Wu CZ, Markram H. 2002. Anatomical, physiological, molecular and circuit properties of nest basket cells in the developing somatosensory cortex. Cereb Cortex. 12:395–410. [DOI] [PubMed] [Google Scholar]
- Wang Y, Toledo-Rodriguez M, Gupta A, Wu C, Silberberg G, Luo J, Markram H. 2004. Anatomical, physiological and molecular properties of Martinotti cells in the somatosensory cortex of the juvenile rat. J Physiol. 561:65–90. [DOI] [PMC free article] [PubMed] [Google Scholar]
- Wickersham IR, Lyon DC, Barnard RJO, Mori T, Conzelmann K, Young JAT, Callaway EM. 2007. Monosynaptic restriction of transsynaptic tracing from single genetically targeted neurons. Neuron. 53:639–647. [DOI] [PMC free article] [PubMed] [Google Scholar]
- Xu X, Roby KD, Callaway EM. 2010. Immunochemical characterization of inhibitory mouse cortical neurons: three chemically distinct classes of inhibitory cells. J Comp Neurol. 518:389–404. [DOI] [PMC free article] [PubMed] [Google Scholar]
- Zeisel A, Muñoz-Manchado AB, Codeluppi S, Lönnerberg P, Manno GL, Juréus A, Marques S, Munguba H, He L, Betsholtz C, et al. 2015. Cell types in the mouse cortex and hippocampus revealed by single-cell RNA-seq. Science. 347:1138–1142. [DOI] [PubMed] [Google Scholar]
- Zhang S, Xu M, Kamigaki T, Do JPH, Chang W-C, Jenvay S, Miyamichi K, Luo L, Dan Y. 2014. Long-range and local circuits for top-down modulation of visual cortex processing. Science. 345:660–665. [DOI] [PMC free article] [PubMed] [Google Scholar]
- Zilberter Y, Kaiser KMM, Sakmann B. 1999. Dendritic GABA release depresses excitatory transmission between layer 2/3 pyramidal and bitufted neurons in rat neocortex. Neuron. 24:979–988. [DOI] [PubMed] [Google Scholar]
Associated Data
This section collects any data citations, data availability statements, or supplementary materials included in this article.