

ABSTRACT
Fatty acids are among the most studied nutrients in human metabolism and health. Endogenous fatty acid status influences health and disease via multiple mechanisms at all stages of the life cycle. Despite widespread interest, attempts to summarize the results of multiple studies addressing similar fatty acid–related outcomes via meta-analyses and systematic reviews have been disappointing, largely because of heterogeneity in study design, sampling, and laboratory and data analyses. Our purpose is to recommend best practices for fatty acid clinical nutrition and medical studies. Key issues in study design include judicious choice of sampled endogenous pools for fatty acid analysis, considering relevant physiologic state, duration of intervention and/or observation, consideration of specific fatty acid dynamics to link intake and endogenous concentrations, and interpretation of results with respect to known fatty acid ranges. Key laboratory considerations include proper sample storage, use of sample preparation methods known to be fit-for-purpose via published validation studies, detailed reporting or methods to establish proper fatty acid identification, and quantitative analysis, including calibration of differential response, quality control procedures, and reporting of data on a minimal set of fatty acids to enable comprehensive interpretation. We present a checklist of recommendations for fatty acid best practices to facilitate design, review, and evaluation of studies with the intention of improving study reproducibility.
Keywords: meta-analysis, systematic review, experimental design, protocol, placebo, sample preparation, gas chromatography, fatty acid methyl esters, response factors
INTRODUCTION
Fatty acids are among the most studied nutrients and bioactive compounds. A 2017 PubMed search on the specific term “fatty acids” limited to human and clinical trials exceeded 24,000 hits. The intake of fatty acids influences all aspects of health and disease because of their diverse roles as structural lipids in every cell, signaling precursors, and as the major component of oily secretions on the skin and elsewhere. The rich preclinical literature developed in cells and animals on the metabolism, biochemistry, molecular biology, biophysics, and genetics of fatty acids indicates that the choice of dietary fats is a key modifiable factor determining proper development, and best health, through the life course.
Despite the dozens of peer-reviewed reports appearing weekly, standardization of the many parameters and considerations common to fatty acid studies has not been undertaken. Meta-analyses and systematic reviews have produced mixed results owing to heterogeneity between studies. Heterogeneity reflecting true physiologic or intervention differences is important in translating findings into recommendations and dietary guidance. Heterogeneity because of study design, fatty acid biochemical analysis, and reporting obscures true differences and reduces the strength of overall evidence. Therefore, the best practices currently described are intended to inform the design, implementation, and reporting of human clinical studies investigating fatty acid metabolism and function so that consistency and strength of the totality of evidence reflect physiologic rather than methodologic differences. Our goal here is to guide choices and recommend reporting standards that reveal issues that can lead to apparent but not real differences in outcomes, rather than to be all inclusive.
This article consists of 2 sections: a narrative discussing various considerations in the design and implementation of fatty acid studies, and a best practices recommendation list intended for use in planning, evaluating, and reporting studies in humans dealing with fatty acid analyses. The practices are based on the experiences of the coauthors, with input from fatty acid researchers worldwide who submitted comments.
Scope
The recommendations are meant to be adopted as appropriate by various stakeholders in fatty acid studies, whether researchers, reviewers, or readers, and are not intended to be prescriptive. The extent to which the recommendations should be applied depends directly on the specific issues investigated in each study. Principal investigators and their research team members are ultimately responsible for the design and conduct of studies, taking into account all factors relevant to the hypotheses or research questions to be investigated. Hundreds of fatty acids are present in human plasma, derived from diet and metabolism. Clearly, it is not possible to consider all issues relevant to all fatty acids in a limited document. The focus here is on fatty acids that have been of primary interest in clinical studies measuring circulating fatty acids with chain lengths from 14 to 24 carbons. This includes examinations of SFAs, MUFAs, and PUFAs, as well as long-chain PUFAs (≥20 carbons, ≥2 carbon-carbon double bonds) and highly unsaturated fatty acids (≥3 carbon-carbon double bonds, HUFAs).
We chose not to consider fatty acids with chain lengths of ≤12 carbons to avoid methodological issues particularly with regard to the volatility of fatty acid methyl esters (FAME) of these shorter chain fatty acids. In its initial study, the National Institutes of Standards and Technology (NIST) fatty acid quality assurance program (FAQAP), involving dozens of fatty acid analysis laboratories, used a similar range and reasoning, as outlined below. Subsequent studies revealed that a minority of laboratories report fatty acids with chain lengths of ≤12 carbons. Specific methods are required to avoid uncontrolled losses of short- (1) and medium-chain fatty (organic) acids (2), and would unnecessarily complicate the present document. However, the principles should be highly relevant to studies involving these fatty acids, as well as those with >24 carbons.
FATTY ACID TRIALS—THE INDEPENDENT VARIABLE
Although, chemically speaking, the term “fatty acid” refers to the free acid, the biomedical literature overwhelmingly uses the term to refer to fatty acyl or fatty ether species, as well as nonesterified fatty acids (NEFAs, also called “free fatty acids”), as a shorthand nomenclature to refer to all fatty acids liberated as a result of an acid or base lipolysis of a biological sample (3). Based on the clear chemical meaning of NEFA, the term “fatty acid” is best reserved for all acyl groups in a sample regardless of lipid class.
Fatty acids are endogenous biomolecules, macronutrients, and n–3 α-linolenic and n–6 linoleic acid are essential nutrients. As such, they differ from xenobiotics—drugs and toxins—which do not occur widely in humans. Without exception, endogenous compounds are handled by specific metabolic mechanisms that have evolved to regulate concentrations and distribution, and have required roles in healthy humans. Xenobiotics, in contrast, are optional compounds that are normally not at appreciable concentrations unless purposefully ingested. The term “drug” is also a regulatory term that is applied to fatty acids when they are an active ingredient component of a preparation that is approved via a drug regulatory scheme. We note, however, that this does not change the fundamental character of fatty acids as nutrients. As nutrients, the diverse and highly regulated character of fatty acids must be figured into any study design and interpretation, including, for instance, known concentration ranges in healthy populations, enzyme-mediated interconversions, and de novo versus exogenous origin.
Drugs undergo extensive preclinical formulation and testing for safety and efficacy prior to being permitted to be used in humans. Formulations in particular are carefully defined according to good manufacturing practice, requiring extensive documentation of starting materials, procedures for creating the specific drug, including all excipients, and specifications for allowed concentrations of components in the final drug. In contrast, studies of fatty acids in foods or supplements routinely rely on generic labeling information to define composition. Omission of the actual analysis of the test article, the target oil under investigation, for both quantity and quality of the putative active ingredients may be a major source of response variability.
Recommendation 1) Treatment fatty acids. All fatty acids in the food or supplements relevant to the issue under investigation must be analyzed and defined.
Rationale for choice of fatty acid pool
Numerous circulating fatty acid pools can be sampled, each with their own properties (4). When fatty acids are the primary outcome the pool must be specified prior to the study initiation for power calculations. In 2016, a global survey of n–3 fatty acids reported that ∼90% of studies concerned at least one of 3 blood pools: plasma total lipids (TLs), plasma phospholipids (PLs), and red blood cells (RBCs) (5). In recent years, total blood lipids derived from dried blood spots have become prominent for their simplicity of collection and storage. Each of these pools, however, has its inherent strengths and limitations, so the rationale for choosing the most appropriate pool should be based on the research design used and the specific question being asked. We discuss here the strengths and limitations of the blood pools, emphasizing the 3 most studied pools. We also discuss how to choose the blood pool in which the fatty acids will be analyzed based on the 3 main types of research designs and what type of question will be answered when analyzing the fatty acid profiles in these various pools.
Plasma TLs
The plasma TL pool has logistic advantages for fatty acid analysis, but can present challenges in interpretation. Specifically, plasma sample collection tends to be routine in clinical studies, and the fatty acids in the sample can be relatively stable. Plasma fatty acids are found in various pools, including NEFAs bound and unbound to albumin, and fatty acyls in complex (acylated) lipids of the lipoproteins. The bulk of the complex lipids consist of triacylglycerols (49%), PLs (24%), and cholesteryl esters (16%) (6), for which their proportion to each other can vary slightly based on the population (4). The triacylglycerol and cholesteryl ester pools have considerable influence on the plasma TL fatty acid composition. Plasma TLs tend to have n–6 linoleic acid (18:2n–6) as the dominant fatty acid, in excess of palmitic acid (16:0), and oleic acid (18:1n–9) tends to be more abundant than stearic acid (18:0) (Figure 1). The plasma TL fatty acid amounts can vary considerably compared with relevant mean treatment effects within and across individuals. These are largely owing to gene-diet and gene-environment influences on lipoproteins and the triacylglycerol pool, which include fasting or the sample timing relative to dietary intake, specifically the types and amounts of foods and/or supplements consumed, as well as genetic polymorphisms (7). Therefore, when using fatty acid data from plasma TLs, quantification of a comprehensive range of fatty acids is recommended to enable proper interpretation, as discussed below.
FIGURE 1.
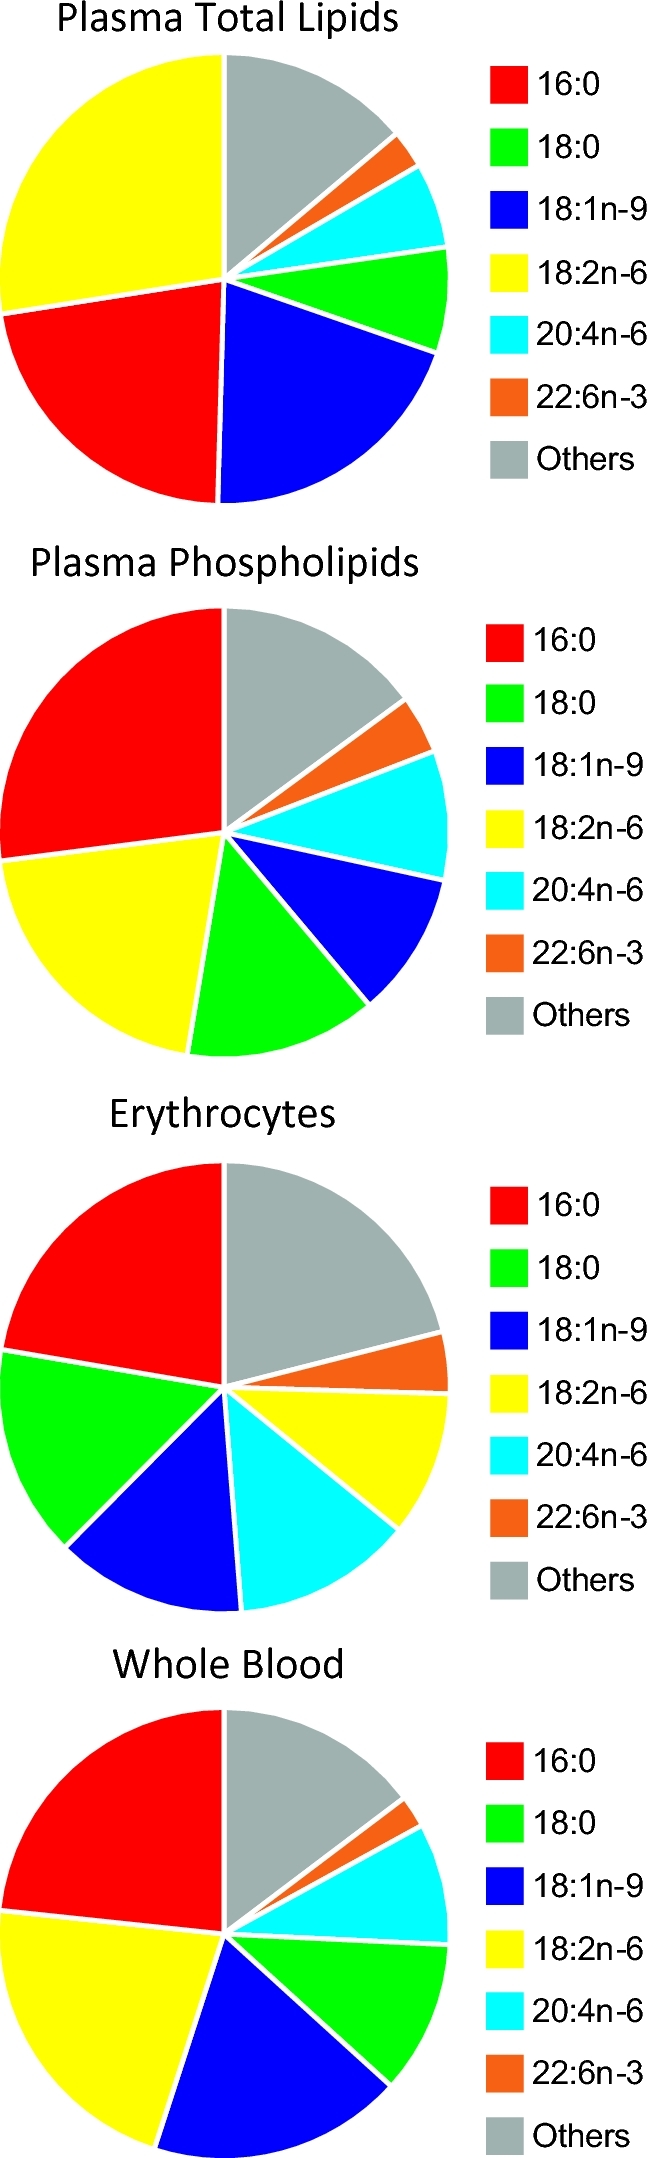
Major fatty acids according to blood lipid pools according to global data (5). Full fatty acid compositions are available in Supplemental Table 3.
Plasma PLs
Plasma PL fatty acid determinations take advantage of the availability and stability of plasma blood sample collections. The isolation and focus on the plasma PL pool eliminates the variability introduced by the transient postprandial triacylglycerol pool, and the resulting fatty acid composition is believed to better represent the cell membrane fatty acid composition. However, plasma PLs are more highly concentrated in phosphatidylcholines found in the lipid monolayer of lipoproteins, and as a result plasma PL measurements can be a biased view of the fatty acid composition of lipid bilayers. Specifically, phosphatidylethanolamine, a dominant PL of the inner bilayer (6), has a distinct fatty acid profile in various tissues (8–11). This results in plasma PLs tending to be higher in n–6 linoleic acid and lower in n–6 arachidonic acid (20:4n–6) than fatty acid compositions from sources with lipid bilayers (Figure 1). Logistically, the requirement for additional separation techniques, such as thin layer chromatography, preparative liquid chromatography, or solid phase extraction (12), can decrease analytical throughput, especially in very large sample sets. However, single-step selective lipid class extraction protocols using polar solvents (e.g., methanol) are available to isolate PLs and have high throughput potential (13).
Erythrocytes
Erythrocytes have a distinct advantage as the main blood pool with a lipid bilayer, with a more complete spectrum of PL classes, and therefore a fatty acid composition that may better reflect the cell membranes of biological tissues (4, 6). Erythrocyte TLs and fatty acid content are also relatively stable when compared with plasma (14), although this stability is often overestimated (see below). Sample collection, storage, and preparation of erythrocytes can, however, be problematic (15). Specifically, plasma and serum tend to be collected as the primary blood sample for clinical studies in general (16), although the heme content of erythrocytes can promote the oxidation of PUFAs unless preventative steps are taken (17). Erythrocyte lysis, extended extraction times, and reduced chloroform-methanol ratios, or the use of isopropanol rather than methanol, are needed to maximize erythrocyte lipid recovery (18, 19). Erythrocyte fatty acid profiles are often considered a better long-term marker of dietary fatty acid habits based on the life span of erythrocytes (20) and the half-life of fatty acids in erythrocytes as compared with serum cholesteryl esters (21). However, there is evidence that the half-life of palmitate is quite short in erythrocytes (<30 min for some acylated erythrocyte proteins, 7–9 h for erythrocyte PLs) (22). With fish oil feeding, EPA can increase more rapidly than erythrocyte turnover, within 4 wk and possibly as soon as 1 wk, whereas increases in DHA are subtle (23). In a sporadic fish oil supplementation trial mimicking UK fish intake patterns, the dose relationship of EPA in erythrocytes was also relatively weak (24). This is likely because of differences in the incorporation of EPA and DHA into lipid classes (phosphatidylcholine versus phosphatidylethanolamine) and/or sequestering into the outer versus inner membrane bilayers (25). It is important to note that the rapid incorporation of EPA into erythrocytes may result in the masking of nonadherence to long-term fish oil intervention when the only n–3 PUFA biomarkers that are monitored are sums or composites of different n–3 PUFAs, such as EPA + DHA (26). Overall in erythrocytes, because the PL concentration dominates over triacylglycerols, the fatty acid composition tends to have lower percentages of 18:2n–6, whereas stearic, oleic, arachidonic, and docosahexaenoic acids tend to be higher (Figure 1).
Other pools derived from whole blood
Fatty acids in other blood pools are also available, and their use may be warranted depending on the research goal and hypothesis (4). This includes lipid classes that can be isolated from plasma, such as the triacylglycerol and cholesteryl ester pools mentioned previously, but also the plasma NEFA pool. The fatty acid composition of these plasma lipid classes are not reported as often as those of plasma PLs when examining long-chain PUFAs (27), but the cholesteryl ester pool has been used in several studies examining saturates, monounsaturates and 18-carbon PUFAs (4, 28). However, unless a specific rationale is provided, reporting the fatty acid composition of cholesteryl esters is not advised since this pool is influenced by recent diet and fatty acyl substrate specificity of sterol O-acyltransferase, and in particular phosphatidylcholine-sterol O-acyltransferase (4). In addition, the fatty acid profile of other blood components, such as white blood cells and platelets, may be informative in certain situations (24, 27).
Whole blood
The use of whole blood sampling for fatty acid profiling is increasing (5). It has a distinct advantage in sample handling and processing as no separation is required, it is amenable to capillary blood collection (e.g., fingertip prick), and it can be collected and preserved as a dried blood spot. Whole blood is, however, a comprehensive sample in that the fatty acids of the various blood components contribute to the overall fatty acid composition (Figure 1). In addition to plasma and erythrocytes, lipid structures in the buffy coat, such as white blood cells and platelets, are included. This can be disadvantageous as information about the sampled blood pool of the fatty acids is lost, limiting interpretation. Therefore, whole blood fatty acid composition may be influenced by hematocrit or changes in white blood cell pools owing to infection, in addition to the changes in plasma lipoproteins outlined above.
Recommendation 2) Sampled pool. The rationale for the choice of blood pool should be stated and justified with respect to biological research question, taking into account logistic issues with respect to study design.
Randomized control trials
Randomized control trials (RCTs) are an intervention study design in which outcomes from participants in ≥1 treatment group are compared with those in a control group. Assignment of participants to treatment groups is random, with the person assigning individuals to treatments and/or the participants being masked (blinded) or open, depending on the hypothesis. RCTs, which are usually necessary to establish causality, vary in duration, from as short as 2 wk to as long as multiple years. As discussed below, equilibration times vary by pool and in some cases by fatty acids.
Length of treatment
When establishing a rationale for selecting the blood pool in which fatty acid concentrations should be evaluated, the length of treatment where dietary fat composition is altered should be carefully considered. Indeed, dietary fatty acid concentrations change at different rates in the various pools within the circulation.
Recommendation 3) Intervention length. Intervention length should be rationalized based on the hypothesis.
Rationales should refer specifically to whether the biological question responds on a short- or long-term basis. For instance, a short-term intervention might seek to rapidly alter postprandial lipemia, whereas a long-term intervention might seek to alter the whole-body status of PUFAs for studies of chronic disease. In the latter case, reference should be made to the known timing of the disease etiology as justification to avoid spurious nonsignificant results because the term of exposure is too brief.
Control/placebo oil
In all RCTs, examination of fatty acid profiles in the circulation is essential for assessment of both the degree of integrity of the experimental procedures and the compliance level of individual participants. It is important in such an evaluation to ensure that the oils chosen as treatments have an adequate span of fatty acid content in comparison with the control oil.
Ideally, the fatty acids of the control oil should mimic the common diet of the country where the trial is conducted unless the investigators are purposely manipulating the diet without use of a control, as would be the case with dietary fat replacement. Another point to consider in the rationale for choosing the appropriate control oil should be whether the participants have a special health condition, such as pregnancy, cardiovascular risk, or cancer. For instance, high intakes of n–6 linoleic acid directly suppress n–3 fatty acids at multiple levels (29, 30). Using placebo oils with PUFAs very different to the population background diet, richer in n–6 or n–3 PUFAs, may shift metabolism, depending on dose and duration. The background diet of the study population should be considered when inferring effects to other populations, and in many cases may restrict application of the findings of the intervention to that specific population. A background diet containing the fatty acid of research interest can also affect the sample size required to achieve meaningful results. The commercial availability of fatty acid supplements can also cause compliance issues in treatment and control groups (31).
Critical to deciding the fatty acid composition of a control oil is the question of fat substitution. When replacing one type of fat in the control for another type in the intervention, the nontrivial issue of whether there is any effect on health risk biomarkers because of the addition of the test or the removal of the control oil must be considered. For instance, a PUFA-rich fat intervention test would be expected to lower cholesterol relative to a saturated fat control beyond that attributable PUFA relative to a control PUFA or monounsaturated oil. A possible solution is to use a low-fat control, thus enabling the biological impact of the test fat in the intervention to be assessed without being confounded by the action of removing the control fat. However, in that instance, either the effects of the reduced energy level or the change owing to other macronutrients may confound the assessment of the direct effect of the test fat on the biomarker of interest. Therefore, this issue of substitution of certain bioactive fatty acids for others has to be carefully examined when designing a clinical study and interpreting its results.
Recommendation 4) Control composition. Control (comparator/placebo) doses should be chosen to be neutral with respect to the outcome, considering the known metabolism and concentrations of dietary fat with respect to the hypothesis and the study population.
Blood fatty acids differ in their response to dietary fatty acid intake. For essential fatty acids such as n–3 α-linolenic acid, total fatty acid profiles shift to reflect changes in intake in ways that can be useful. For instance, n–3 α-linolenic acid concentrations expressed as a percentage of total identified fatty acids increased >2-fold in humans following a controlled feeding period of 4 wk where >20 g/d n–3 α-linolenic acid was consumed (32). However, for n–6 linoleic acid, the percentage offsets in the circulating compartment were notably less (i.e., <10%) even after substantially higher n–6 fatty acid intakes, and for oleic acid–rich diets the offsets were even more modest (i.e., <5%) following dietary substitutions containing high oleic acid canola oil with as high as 72% oleic acid. This latter finding possibly reflects the nonessential nature of oleic acid; because this fatty acid is synthesized de novo, manipulation of its concentrations in plasma and tissues is more resistant to changes in intake.
Recommendation 5) Biological responsiveness. The responsiveness of the target fatty acid pools should be considered with respect to the chosen intervention doses and duration.
Ensuring adequate experimental execution and monitoring compliance
The responsiveness of circulating fatty acid concentrations to interventions varies according to the specific fatty acid structure. As a general rule, fatty acids that can be synthesized de novo from carbon sources producing acetate (endogenous) are more difficult to associate with dietary intake (exogenous) of the same fatty acids (4, 28, 33). Thus, most SFAs and MUFAs in blood tend to have weaker associations with and inconsistent correlations to dietary intakes. Fatty acids that are primarily sourced from the diet tend to show stronger associations between blood and diet concentrations. While this includes n–3 and n–6 PUFAs, it can also extend to other “unique” exogenous fatty acids, such as odd-chain, branched chain fatty acids, as well as fatty acids with trans- and conjugate bonds (4, 33). However, even with these dietary or “exogenous” fatty acids, the blood-diet relationship can be dictated by variation in endogenous fatty acid interconversion via C2 elongation, desaturation, and β-oxidation metabolism of the specific fatty acids of interest. For example, within the PUFA families, blood EPA and DHA correlate strongly with dietary intake of EPA and DHA, whereas n–6 arachidonic acid in blood and intake are less responsive (4), suggesting that other factors, such as intake of other dietary fatty acids (i.e., 18:2n–6) and metabolic flux, have significant influence on n–6 arachidonic acid blood status (33). Blood fatty acids may also provide insight into shifts in other macronutrient intakes, as increased n–7 fatty acids and decreased 18:2n–6 have been associated with low-fat/high-carbohydrate diets as they represent a shift toward increased endogenous or de novo fatty acid production (34).
Recommendation 6) Fatty acid dynamics. Dietary fatty acid exposure and implications for well-established principles of fatty acid metabolism must be taken into account for interpreting the diet-blood relationship.
For other types of interventions, such as with n–3 fatty acid supplementation, blood fatty acid concentration shifts should be used to confirm that the experimental protocol has been correctly deployed, as well as an estimate of subject compliance. However, a more in-depth benchmarking of anticipated shifts in the fatty acids of particular interest is required to best utilize this approach. In order to assess the utility of using circulating fatty acid concentrations as surrogates for ensuring experimental correctness and or compliance, it is necessary to explore what offsets would be expected in controlled dietary scenarios where specific fatty acid substitutions are made under compliance-assured conditions. Then, comparing observed offsets to what would be expected can inform investigators as to the degree of compliance of any particular participant in clinical trials.
An excellent example of the use of fatty acids to reflect protocol compliance is the case of DHA supplementation. In the absence of changes in other fatty acids, tissue DHA concentrations are largely governed by dietary intake as its synthesis from α-linolenic acid is low under the industrial food supply's dietary intake of competing linoleic acid (35, 36). Circulating DHA concentrations in plasma TLs, but not RBCs, increase swiftly after DHA supplementation; for instance, volunteers consuming 4 g/d of DHA-supplemented canola oil under compliance-controlled conditions showed an increase in plasma TL DHA concentration of well over 2-fold over 4 wk compared with the consumption of regular canola oil (32). The other means of raising circulating DHA—by lowering linoleic acid—is slow. Any instance in which DHA concentrations have moved in opposite directions between control and DHA supplementation phases indicates potential problems in treatment assignment, blood collection procedures, or subsequent experimentation stages. In instances of reverse responses of circulatory fatty acid concentrations to dietary treatment assignments, investigators should scrutinize protocol execution to identify errors. Other studies show consistent deflections in DHA concentrations in blood subsequent to n–3 fatty acid feeding (37).
Similarly, the sum of EPA and DHA concentrations in multiple circulating compartments in the blood has been used as a measure of compliance. Patterson et al. (38) demonstrated in a controlled supplement intervention study that the sum of EPA + DHA in plasma PLs, erythrocytes, and whole blood increases from 85% to 95% for every gram of EPA and DHA consumed over a negligible intake baseline. For intervention studies, available data suggest that certain fatty acid classes provide a better degree of representation of dietary intake shifts than do other classes, as discussed below. These data are at variance with reported shifts within RBCs and PL EPA and DHA concentrations within less well–controlled feeding studies, where the responses were generally more gradual with increasing intakes, particularly at higher concentrations of EPA and DHA consumption (38). From those anticipated responses, target threshold values can be set to identify and possibly exclude study participants whose circulating fatty acid profiles fail to meet those thresholds, as an indicator of poor compliance. The failure of an individual's circulating fatty acid concentration to meet an established threshold value is taken to imply that an inadequate proportion of the treatment fat was consumed. However, the degree of correspondence between circulating fatty acid concentrations and dietary intake will vary depending on the circulatory fatty acid compartment examined, whereby total circulating fatty acid concentrations would be expected to shift more rapidly over time relative to a more slowly turning over pool, such as erythrocytes.
Intent-to-treat and per-protocol analyses
A major source of heterogeneity among studies is perceived to be the de facto use of intent-to-treat (ITT) rather than per-protocol (PP) analysis, as well as imprecise application of the 2 approaches. Strictly interpreted, ITT analysis applies specifically to the entire treatment, for instance, an entire caplet, regardless of whether the active ingredient was delivered to the participant. For example, an n–3 fatty acid supplement contained in a gel capsule that prematurely breaks causing high levels of fishy burping could result in lower compliance in the experimental group and bias toward the null compared with a properly functioning capsule supporting higher compliance.
Trials of fatty acid intake accomplished with either foods or supplements are administered for the express purpose of altering the fatty acid profile of one or more endogenous tissues or fluids, usually intermediate to measuring a health outcome. During all trials, participants are consuming food with the target fatty acids and with other fatty acids that influence endogenous pools of fatty acids. Preparations that fail to sufficiently influence endogenous concentrations because, for instance, compliance is low influence the dependent outcomes. Xenobiotics are appropriately analyzed on an ITT basis because they are inherently medical treatments with medical indications. ITT applies to the entire good manufacturing practice defined treatment, and not exclusively to the test active ingredient. If no fatty acid measurements are made and a null result is found, the results cannot be ascribed to a failure of the test fatty acids to induce an effect, but only to the intervention as a whole. When no fatty acid measurements are made, such studies are particularly difficult to put into context of overall metabolism because changes in biological pools and biomarkers of compliance are undocumented. PP analysis, in contrast, can effectively ignore many details of the preparation and focus on establishing how changes in fatty acid concentrations in tissues correspond to changes in the health outcome. However, care must always be taken in interpreting any PP to avoid assigning significance to reverse causality. Treatment outcome may be correlated with compliant participants, who may be very different from noncompliant participants in any number of uncontrollable lifestyle factors, such as exercise, habitual diet, and smoking, and this may render any effects to be group differences not ascribable to the fatty acid intervention.
Recommendation 7) Data analysis principles. All fatty acid intervention trials should report ≥1 measure of fatty acid concentration within a specified biological compartment so as to enable analysis on both an ITT and a PP basis.
Nevertheless, the utility of using n–3 fatty acid concentrations in the circulating compartment as indicators of compliance is supported by these findings. Therefore, an important point here is that all RCTs should indicate how compliance was monitored. Additionally, other types of research designs, such as crossover or sequential study designs, exist which should use the same criteria as RCTs in selecting the most appropriate circulatory pool in which fatty acid profiles will be analyzed.
Recommendation 8) Fatty acid ranges. Intervention-based changes in circulating fatty acids should be compared with previous literature reports to establish that they fall into expected ranges.
Observational. Prospective cohort studies and cross-sectional studies
Prospective cohort studies and many cross-sectional studies, for practical reasons, obtain samples over extended time periods, collecting biological samples for subsequent banking, typically for several years, in freezers at −80°C. Often a general lack of information exists in publications about the timing between when the biological samples were collected and when the fatty acid profile analysis was performed on them. For instance, some samples collected in the 1990s could have been analyzed <2 y after collection even though the paper reporting the analysis was published in 2000; for other studies, the samples may have been collected as early as the 1990s but the fatty acid analyses were performed in 2010, hence leaving a large gap between collection of samples and their subsequent analyses. An important question becomes whether the quality of the sample persists after having been stored for so long and whether the data are accurate, particularly in the case of n–3 fatty acid concentrations. Storage conditions are particularly important because practical considerations often require wide variability between sample collection and analysis, as, for instance, for enrollment of participants or sample collection over many months. Details about storage temperature and duration are provided below.
Moreover, this type of study often reports dietary fat intake collected by dietary record or food frequency questionnaires. Some studies report dietary intakes in EPA + DHA evaluated from dietary recall or food-frequency questionnaire. In cross-sectional studies, circulating compartment fatty acid composition data can provide insight into habitual consumption patterns for dietary fats with far better accuracy than do dietary intake data. The substantial limitations of self-reported dietary intake assessment instruments have been identified by experts in that area (39). For instance, the EPA and DHA contents differ across fish species, and nearly always between farmed and wild fish (40, 41). In these types of studies, it is far more informative to look at fatty acid profiles within the circulating compartments rather than rely on the vagaries of recall methods and limitations of nutrient databases to identify dietary patterns of individuals.
The rationale for choice of blood sample must reflect fatty acid status over the relevant time period. A representative example of fatty acids in circulation reflecting patterns of intake for fat qualitatively is seen in the case of the ω-3 index, which is intended to serve as a barometer of n–3 fatty acid consumption. The ω-3 index calculates the sum of n–3 fatty acids, usually the addition of EPA and DHA concentrations, within the erythrocyte compartment, and has been substantiated as reflecting longer term intakes of dietary n–3 fat relative to other fatty acid species. Other instances of use of fatty acids in blood exist to quantitate the types of fatty acids consumed over the longer term. For instance, margaric acid concentrations have been used as a proxy for dairy fat consumption (42). However, logistics involved with blood sampling, handling, and storage may limit the availability or choice of type of blood samples. In some cases, it may be possible to translate fatty acid data from one blood fraction to an equivalent in another blood fraction (43), for instance, measuring RBC fatty acids and estimating fasting plasma fatty acid concentrations. Any such translation should be done with caution, and appropriate caveats should be considered. Such monitoring is useful to assess adequacy of intakes particularly for essential fatty acids, and especially in low-resource regions, where essential fat intakes, including n–3 fatty acids, appear insufficient (5).
Thus, considerable merit exists in identifying a suitable fatty acid blood compartment for assessment of nutritional status or recent intake concentrations in cross-sectional trials. An important consideration in both cross-sectional and prospective studies is to consider the use of circulating fatty acid concentrations as surrogates for fat intakes, but in the context of the limitation of interindividual variations. It has been shown that substantial variations exist not only in circulating fatty acid profiles across individuals, but also in their degree of responsiveness to dietary fat challenges. Some of this variability is random, but some can be ascribed to a range of factors, including baseline dietary patterns (4). This includes lifestyle behaviors such as smoking, alcohol, and physical activity (44–46), but also age (47), sex (48), and the increasingly recognized influence of genetics (49, 50). The role of genetic polymorphisms related to fatty acid interconversion, and ultimately concentrations in circulation, following dietary interventions has been demonstrated and is the focus of ongoing research (49–51). For EPA + DHA blood concentrations, fish and fish oil consumption accounts for an estimated 47% of variability, whereas other factors, such as age and smoking, account for ∼10% of variability combined (44). Analysis of the variation around EPA and DHA fatty acid measurements generally gives a CV of <5% (52).
Researchers should also be aware that biological ranges of fatty acids in the blood of humans have been established in many cases. These ranges should be used when interpreting the study results. For example, the ratio of EPA + DHA to total fatty acids ranges over ∼1–15 in various blood pools from populations across the globe according to a comprehensive literature review (5), which is similar to the range found in the erythrocytes of 160,000 participants determined in a single analytical laboratory (53). Failure to consider known ranges of fatty acid intake or concentrations in specific pools in populations can lead to speculation contradicted by known disease risk or prevalence.
Recommendation 9) Population and blood pool ranges. Levels of particular or summed fatty acids, such as n–3 fatty acids, are modified in specific populations and/or blood pools. These changes should be taken into account when interpreting the results.
SAMPLE COLLECTION PROCEDURES
Many sample collection conditions can influence the blood fatty acid profile, including but not limited to fasting or postprandial status, variations related to sex (e.g., menstrual cycle timing), dynamic effects related to diagnosed medical condition or syndrome and corresponding treatment therapy, recent alcohol, tobacco or drug use, and the blood sampling protocol itself (e.g., use of anticoagulants, use of antioxidants, length of handling time). Details of sample storage and archiving, including timing, freezing, and storage temperatures, should be reported. Special attention should be given to conditions that may cause PUFA oxidation, including the use of antioxidants and iron chelators intended to minimize the oxidation risk. Storage temperatures, freeze-thaw cycles, and oxygen exposure may all increase the oxidation risk. Numerous control points require special attention to ensure sample collection that minimizes alterations in the fatty acid profile during storage.
Participant metabolic state
Marked fatty acid shifts occur in the plasma in response to food intake. After food intake, the postprandial state is characterized by higher triacylglycerol (TG) concentrations in the plasma. Moreover, the postprandial state is more variable metabolically than the morning fasting state. Therefore, the postprandial stage is a transition stage and samples collected in this period should be avoided unless the investigators are purposely evaluating that specific stage, or unless a blood fraction or fatty acid pool that is relatively stable with regard to fatty acid (e.g., PLs) in the postprandial state is to be examined. The postprandial rise in plasma fatty acids studied with and without stable isotope labels show that concentrations remain elevated even at 4–6 h after the meal (54, 55). To accurately monitor TG concentrations, a fasting duration of 9–16 h has been recommended, during which only water is permitted (56). In addition, alcohol should not be consumed for 24 h before blood sample collection because it can increase TG concentrations (56). The fasting period, typically overnight, should then be 10–12 h. In contrast, if fatty acid profiles are evaluated in RBCs, strict guidelines for fasting may not be necessary. Also, certain fatty acids appear to be more resistant to postprandial effects. For example, n–3 PUFA status can be accurately assessed in postprandial samples in whole blood, plasma, or erythrocytes, depending on how the samples are analyzed and the data are expressed. For instance, the percentage of n–3 HUFA in total HUFA is more robust to transient changes in circulating postprandial fatty acids than other indexes or individual fatty acids as a percentage or concentration of total fatty acids (57).
Other conditions modifying blood lipid content in participants include: sex, age, diabetes or glucose intolerance, pregnancy or lactation, medication modifying blood lipid concentrations such as cholesterol- or TG-lowering drugs, obesity, athletes or highly active participants, menopause, and chronic or acute smoking (4, 44). For instance, smoking a single cigarette increases the metabolic rate of TG-rich lipoproteins (58).
Recommendation 10) Relevant physiologic state. Reports should outline medical, physiologic and behavioral conditions that may influence fatty acid target outcomes and discuss steps taken to minimize their effects.
Blood sample collection conditions
Biochemistry parameters are generally derived from measurements of serum or plasma. Blood collection parameters, such as participant posture, season of blood collection, and the duration of the tourniquet application, can cause shifts in cholesterol and TG pools (59, 60). Plasma samples have several advantages over serum samples, including obtaining the samples faster since there is no waiting for the blood to clot, and shorter centrifugation time since the centrifugation speed can be higher for plasma samples compared with serum samples (61). Plasma samples have been shown to have slightly lower concentrations of cholesterol than serum because of an osmotic effect of the anticoagulants extracting water from cellular contents (59). However, the fatty acid composition of serum and plasma has been shown to be remarkably similar when expressed as relative percentages of total fatty acids (62). The most popular vessels for collecting plasma are tubes loaded with EDTA, heparin, and citrate, and for collecting serum the most popular tubes are those coated with silica. Between blood sample collection and centrifugation, blood samples to be used for separating plasma from red cells should be kept on ice to avoid fatty acid hydrolysis from glycerolipids, a process that can result in artifactual change in the concentrations of NEFAs, and possibly PLs and TGs, in the plasma.
Sample storage
Appropriate storage of plasma or blood samples collected during an RCT, a cross-sectional study, or a prospective study is critical to preserve sample quality and to ensure an accurate measure of the fatty acid profile. Inappropriate storage conditions can lead to peroxidation of the fatty acids and the hydrolysis of fatty acids from PLs. In general, the presence of RBCs in a sample can increase the risk of oxidation. The stability of blood fatty acids during storage and possible mechanisms of fatty acid degradation have been reviewed recently (15). In general, PUFAs are susceptible to peroxidation because of the attack of free radicals. Free radical generation is increased with exposure to oxygen and the presence of iron (hemoglobin complex) in the samples. Peroxidation can be prevented or reduced through the addition of antioxidants (63) or chelating and/or cryopreserving agents (17), as well as the presence of other oxidizable compounds in the sample that may act as alternative targets, such as vitamin E and various proteins (64, 65).
Samples should be stored at −80°C to prevent oxidation of plasma PL PUFAs. This temperature prevents degradation of long-chain PUFAs in the PL fraction serum pool for ≥10 y (66). The fatty acid composition of plasma PLs is also stable for ≥1 y when stored at −20°C (67, 68). Surprisingly, there are no studies that have evaluated the stability of the fatty acid profile in plasma TL extracts. Therefore, it is difficult to make any recommendation with respect to number of years and storage temperature. However, Matthan et al. (66) performed fatty acid profile analyses in TGs, PLs, and cholesteryl esters in samples stored at −80°C and found that the fatty acid profile was stable for >10 y. Another group also analyzed the fatty acid profile in TGs, PLs and cholesteryl esters in plasma samples stored at −20°C for 3 y and they determined that PUFAs were stable for <3 y (67). Considering these caveats, and because there are no data per se on the stability of fatty acids in plasma TLs, fatty acids in plasma TL extract are considered stable for ≥10 y if stored at −80°C but are stable for <3 y if stored at −20°C. Plasma NEFAs are known to increase when stored at ≥−20°C as these temperatures do not appear to be cold enough to prevent phospholipase activity (69–71).
Compared with plasma fatty acid stability lasting for ≥10 y if stored at −80°C, RBC fatty acid stability is lower because RBC iron, when released, catalyzes long-chain PUFA oxidation (17). Therefore, specific considerations require attention when dealing with this lipid pool. For instance, fatty acids from RBC TLs that were stored at −20°C without any specific storage additive such as N2 or butylated hydroxytoluene (BHT) were stable for 13 d to <6 mo (63, 72, 73). Fatty acid stability was highly improved when RBCs were stored at −70°C without any added antioxidant agents (74). One study showed that fatty acids in RBC phosphatidylcholine were stable for >2 y if the RBCs were stored at −80°C (47). Studies using unwashed erythrocytes yielded results similar to studies that washed erythrocytes prior to storage (15). To maintain the stability of RBCs, investigators should consider adding an antioxidant such as BHT to stabilize RBC-containing samples. Therefore, storage temperature seems critical, especially for RBCs, for maintaining sample quality with respect to fatty acid content and prevention of oxidation. Storage also depends on the form of storage vehicle, with vials limiting oxygen exposure more reliably than paper; details are available elsewhere (75). Storage for weeks at −20°C (63) should be avoided for erythrocyte-containing samples to avoid iron release through hemolysis (17); samples stored at room temperature or 4°C are more stable.
Whole blood samples appear to be the less stable than plasma and RBC samples (15). The increased risk of PUFA losses in whole blood appears to be because of the water content in the samples, as RBCs diluted in saline are less stable than packed RBC samples (15), suggesting that the higher water content may increase the amount of freezing-induced hemolysis, which releases iron. Freezing-induced hemolysis appears to be responsible for the rapid decline in PUFAs in whole blood and RBC samples when they are stored at −20°C (17), as samples stored at room temperature and 4°C are more stable (75). Freezing-induced hemolysis also occurs at −80°C, but PUFA concentrations are relatively stable when compared with −20°C storage. It appears that −20°C storage is not sufficiently cold to prevent oxidative processes, as BHT can prevent much PUFA loss at −20°C (75). Cryopreservatives that protect against hemolysis and chelators that bind iron prevent PUFA losses at −20°C, but BHT appears to be the most effective single treatment (75). For whole blood stored as dried blood spots, the risk of oxidation is increased compared with storage in tubes as dried blood spots are exposed to atmospheric oxygen. Drying the blood spot thoroughly before low-temperature storage can prevent hemolysis and increase stability. However, BHT and/or other protective agents should be considered as they can extend PUFA stability in DBS under various conditions (15), including room-temperature storage (76).
Other storage conditions that should be considered include the size of the aliquot to be stored and freeze-thaw cycling. Smaller aliquots of samples have a greater surface area to volume ratio than larger aliquots, which increases the exposure to oxygen and results in more degradation (72). Freeze-thaw cycling of samples is largely believed to be detrimental, but this appears to be based on studies employing enzymatic assays to examine various clinical blood lipid classes such as cholesterol and TGs, and the findings are not consistent (77). Limited research exists probing the effects of freeze-thaw with subsequent fatty acid determinations by gas chromatography (GC); one of the few studies suggested that repeated freeze-thaw cycling had limited impact on lipid concentrations, including fatty acids, in unfractionated serum (77). However, sample handling should limit freeze-thaw and minimize the time a sample spends at temperatures above ultracold temperatures (<−50°C). Reference should be made to validation that the key fatty acids or indexes (e.g., %HUFA) are preserved under the conditions of storage.
Recommendation 11) Sample integrity during storage. Details of sampling and storage should be reported, including timing between sampling and analysis, storage temperature, duration, and any antioxidant/protectant used.
SAMPLE PREPARATION AND ANALYSIS
Lipid extraction
Methods of preparing samples for fatty acid analysis require a validation study prior to use. Traditionally, lipids were first extracted from a sample and then derivatized to FAME for improved response in a gas chromatograph (12). Lipid extraction can be tailored to sample type, but for blood samples, lipid extraction techniques that extract polar and nonpolar lipids, such as that of Folch et al. (78), and for samples with low lipid content, that of Bligh and Dyer (79), are common. Techniques designed to extract nonpolar lipids, such as those used to monitor the food supply, should be avoided or used with caution (18).
Derivatization of fatty acids
This sample preparation step typically requires some form of hydrolysis or transesterification of the fatty acids from complex lipids. While saponification with a strong base prior to esterification was once common, several transesterification protocols have been developed where the fatty acid methyl ester is formed during hydrolysis from the complex lipid. Base-catalyzed methylation procedures are not suitable for esterification of NEFAs or transesterification of amide linkages found in sphingolipids. Acid catalysis can drive esterification and transesterification reactions. While methanolic HCl and sulfuric acid in methanol can be used, the much harsher BF3 in methanol is commonly employed to speed up the reaction despite the increased potential for artifact generation. In addition, various one-step extraction and derivatization techniques such as those of Lepage and Roy and others (80–82) and no extraction, direction transesterification methods have often been used. In general, all chemical methods are specific to the analyte and to the chemical matrix. For example, water content can be critical in direct transesterification methods (83). Therefore, methods developed for fatty acids in one sample matrix (e.g., RBCs) are not applicable to fatty acids in another matrix (e.g., milk) without a specific validation study. Validation studies for the specific methods mentioned develop a set of chemical principles and report optimized parameters. Laboratories using any method should use proper quality control (QC) techniques upon first use to establish routine protocols on surplus samples prior to use of study samples. Applying an established method to a new sample matrix requires side-by-side, replicate preparation with an extensive set of internal standards to compare the accuracy and precision of the putative method with the established method. Specific principles are usually relevant to particular methods. For instance, the Bligh and Dyer (79) method requires a ternary mixture of chloroform, methanol, and water to achieve a single phase and highly effective extraction. Failure to achieve a single phase because of excess water in the sample causes the method to be very inefficient.
Recommendation 12) Fit-for-purpose sample preparation. The method used to extract fatty acids and derivatize fatty acids to FAME should be explicitly stated and reference to the original studies of their use should be cited.
FAME analysis
As noted above, the biomedical literature overwhelmingly uses the term “fatty acids” to refer to fatty acyl species as well as NEFAs, as a shorthand nomenclature to refer to all fatty acids liberated as a result of an acid or base lipolysis of a biological sample (3). Typically, fatty acids will be converted to their FAME derivatives for analytical purposes.
The classic and most widely used method for FAME analysis is GC coupled to either a flame ionization detector (GC-FID) or an electron ionization (formerly known as electron impact) ion source mass spectrometer (GC/MS). The FID inherently produces signal on an approximately per milligram basis, whereas GC/MS produces signal on a per mole basis. Importantly, the FID does not yield information on chemical structure. GC/MS yields structural information such as molecular mass (weight), but for FAME cannot locate the double bond position (84), and in many cases is ambiguous with respect to chain branching (85).
Neither electrospray MS/MS via liquid chromatography (LC)-MS/MS nor shotgun methods are preferred for fatty acid analysis because these approaches are not as specific or broadly applicable for fatty acids as GC. Because of the chemical properties of aliphatic hydrocarbon chains in mass spectrometers, double bond position and geometry (cis-trans) and chain branching are seldom captured in conventional LC-MS/MS analyses. Carbon and double bond numbers typically can consist of dozens of possible isomers and require information external to the sample to assign them to a structure (e.g., 22:6 is usually all-cis-4,7,10,13,16,19-docosahexaenoic acid). Moreover, LC-MS/MS generally requires isotopically labeled internal standards to enable acceptable quantitative analysis. Analysis over a range of 24 fatty acid features requires a similar set of isotopically labeled internal samples, which is seldom available.
Recommendation 13) Analytical chemical fidelity. Methods should be reported in sufficient detail to establish unequivocally fatty acid identity and resolution.
REPORTING
Relative versus absolute concentrations
Fatty acids are reported in 2 formats: relative and absolute.
Relative
Known as fatty acid profiling, the units are expressed as percentage by weight of total fatty acids, also known as weight-for-weight and abbreviated variously as “%, wt:wt” or “g/100 g”. Profile reporting is the most common means of expressing fatty acid data (5). Weight is the natural unit for a GC-FID analysis because the FID responds to the total C and H burned rather than the moles of each analyte eluting from the column. Importantly, this method is also natural for studies focused on competition between various fatty acids for access to metabolism such as transport proteins, esterification, and interconversion from one fatty acid to another.
Profile percentages tend to exhibit lower variability than absolute concentration (discussed below) and tend to be distributed normally, a statistical advantage. As a result, proposed blood biomarkers of n–3 PUFA status are typically relative percentages or ratios (14, 62, 86); concentrations of n–3 PUFAs without context are difficult to interpret because high concentrations could be a result of general lipemia rather than a specific increase in n–3 PUFAs. A recent systematic review of the blood fatty acid data of healthy adults across the globe revealed that 78% of the data were reported as weight percentage overall, with higher reporting percentages in the erythrocyte (91%), whole blood (92%), and plasma PL (83%) blood fractions (5).
Absolute
Expressing fatty acid concentrations in terms of concentration in a fluid (e.g., plasma) or tissue, for instance, as mg fatty acids/mL plasma, is appropriate when the goal is to establish the total available fatty acids. Importantly, in most biological systems, lipids are not dissolved but are maintained in suspension in various ways, as cells (e.g., RBCs), lipoproteins, or bound to transport proteins. Dissolution in aqueous solution implies a molecular dispersion, useful as a proxy for collision frequency, which enters into the reaction rate definition. Lipids in suspension are not molecular dispersions, and in their native environment where biology occurs (e.g., a membrane or the core of a lipoprotein particle) they are at a far higher concentration than in the bulk fluid or tissue. The concept of absolute concentration must therefore be understood as defining an average mass per unit fluid or tissue. Methods for measuring concentration do not inherently depend on measurement of a range of fatty acids; rather, they can be restricted to a single fatty acid.
Absolute fatty acid concentrations tend to result in greater intersubject variability, and are prone to multimodal distributions in blood and other tissues and fluids. In these cases, statistical analyses can be limited to nonparametric approaches or the data require transformation.
Both relative and absolute fatty acid measures are used for expressing fatty acid concentrations, their use depending on the nature of the specific issue considered. The choice of units influences the magnitude of the apparent changes (87), and can yield an apparent contradiction in final conclusions (88, 89). One of the many considerations involved in formulating a critical hypothesis at the heart of competing theories in equipoise and in designing a study to provide an unambiguous confirmation or refutation of the hypothesis is what units to use to express the outcome. The hypothesis and research questions in fatty acid studies should be formulated in sufficient detail to specify which units are relevant.
Recommendation 14) Fatty acid units. The rationale for primary reporting of fatty acid profile or absolute fatty acid concentration should be reported with respect to the hypotheses.
Combined with an independent measure of total fatty acids per unit fluid (e.g., milliliter of plasma) or tissue (e.g., g of muscle), all fatty acids can be converted to absolute concentration units. The percentage of total fatty acids normalizes to the total fat amount, which is often reflective of sampling (e.g., volume of plasma, number of cells) in a manner similar to normalization to protein for other analytes. Fatty acid profiling does not capture changes in the total fatty acid pool, for instance, when lipemia increases the total fatty acids per unit plasma. Decreases in a particular target fatty acid can be misleading under these circumstances when, for instance, the total fatty acid concentration increases but a target fatty acid decreases as a percentage of the total. As an example, long-chain PUFAs as a percentage of total fatty acids tend to be at higher concentration in plasma PLs than in plasma TGs (5, 90). Postprandial lipemia consisting primarily of TGs dramatically increases plasma total fat, reducing the percentage of PUFAs as a profile percentage but not reducing their concentration expressed as mg/dL plasma.
Recommendation 15) Data interconvertibility. Regardless of the choice of primary reporting method, all reports should include sufficient data to convert relative to absolute concentrations and vice versa.
Calculating total fatty acids for profiles
Surprisingly, no standardized list of fatty acids to be included in a “total fatty acids” sum is in use or, to our knowledge, proposed. The total fatty acids reported has largely been an arbitrary decision of the researcher and is seldom justified in reports. Concerns about concise reporting led to pressure from journal editors for truncated fatty acid composition tables, especially in the preweb era prior to the advent of supplementary data.
The recent systematic review of blood fatty acid composition of healthy adults across the globe (5) shows that 9.4 ± 5.8 fatty acids are reported. Surprisingly, >30% of the studies reported ≤5 fatty acids, with 2% of the studies reporting no individual fatty acids, but only composite scores (e.g., n–3 EPA + DHA). This variation in reporting is remarkable, particularly considering that the data were all generated by nominally similar analytical procedures—GC with a capillary column.
The fewer the fatty acids that are summed, the greater the apparent profile percentage of those reported. Researchers have employed 2 approaches for choosing fatty acids: 1) summing the total of identified fatty acids, and 2) summing the total of unidentified fatty acids. For the “identified fatty acids” approach, fewer fatty acids are typically summed, inflating the relative percentage of fatty acids reported. For the “unidentified fatty acids” approach, it is important to establish that the unidentified peaks are in fact fatty acids and not other lipids or contaminants such as cholesterol (91), phthalates (92), or BHT breakdown products (93). Either approach may depend on methodological details, such as type of capillary column (94) or technique used to prepare FAME (62).
In 2012, the NIST, along with the CDC and NIH's Office of Dietary Supplements, initiated the FAQAP to promote clinical comparability of analytical results (52). This was followed up by second and third exercises in 2015 (95) and 2016 (96) using a procedure generally referred to as a “round robin” or “ring test.” Several laboratories around the world received standard reference materials (SRMs) generated by NIST consisting of serum for fatty acid analysis. In the initial exercise, a preliminary list of 24 fatty acids was requested, although participants were asked to include any fatty acids that they typically report. The percentage of participating laboratories reporting each of these 24 fatty acids varied from 100% for 20:4n–6, 20:5n-3, and 22:6n-3 in all 3 exercises to 64%, 50%, and 33% for 22:1n–9 in exercise 1, 2, and 3, respectively (Supplemental Table 1). The reduced percentages in the reporting of common fatty acids in exercises 2 and 3 were because of the inclusion of a laboratory using targeted HPLC measurements, rather than comprehensive GC profiling. In addition, for exercises 2 and 3, participants were encouraged to include measurements of additional fatty acids, but the percentages of laboratories reporting any of these additional fatty acids were all <50% (Supplemental Table 2). As the FAQAP examined only serum, the reporting practices for fatty acids across blood fractions was examined in the global map database (5). The percentage of studies reporting mean relative percentage values of the 24 individual fatty acids identified by NIST were examined for the fatty acid compositions of 359 separate reports that presented data as relative percentages (Supplemental Table 3). The frequency of reporting for 22:1n–9 and 14:1n-5 was quite low (<10% in all blood fractions). The mean relative percentage contribution of 14:1n-5 was <0.04% for all blood fractions, whereas for 22:1n–9 it was 1.00% in plasma PLs.
The number of fatty acids that can be identified and quantified is dictated in part by capillary column choice. The use of a traditional polyethylene glycol capillary column and a biscyanopropyl column marketed for trans-fatty acid determinations for plasma profiling serves as an example (Table 1). The biscyanopropyl column enabled the quantification of 12 additional minor fatty acids (percentage contributions <0.15%). Based on reporting practices and relative percentage contribution to the total fatty acids, this working group categorized the fatty acids into categories primarily based on arbitrary abundance ranges (Table 1). The A category includes fatty acids with abundances >0.30% of total fatty acids, with some fatty acids known to be critical for interpreting metabolism (e.g., see Mead acid below). This list has 21 fatty acids, which sum to ≥95% of the total plasma fatty acids. To our knowledge, no external standard mixture currently exists with all 21 A fatty acids listed in Table 1. The B category includes 7 fatty acids with abundances typically between 0.10% and 0.30% of total fatty acids that can be detected on a general Carbowax column but may vary across blood pools. Finally, the C category includes fatty acids comprising <0.20% of the total and requires high-polarity columns for detection. While as many fatty acids as possible should be included in calculations of “total fatty acids,” it is important that the fatty acids in category A are reported to improve the consistency of relative percentage data. Any exceptions should be noted. For example, Mead acid (20:3n–9) is important in assessing essential fatty acid status and should be reported. If below the limit of detection or quantitation, as is common in populations with contemporary high dietary intakes of PUFAs such as 18:2n–6, it should be reported as such. Category B and C fatty acids will be important to specific cases and should be reported when relevant.
TABLE 1.
Fatty acids identified in SRM-2378-1 using various GC columns1
| Inclusion category2 | Polyethylene glycol (DB-FFAP) | Biscyanopropyl (SP-2560) | |
|---|---|---|---|
| 12:0 | B | 0.22 | 0.18 |
| 14:0 | A | 1.44 | 1.59 |
| 15:0 | B | 0.15 | 0.19 |
| 16:0 | A | 23.78 | 23.25 |
| 17:0 | B | 0.25 | 0.27 |
| 18:0 | A | 7.25 | 7.62 |
| 20:0 | B | 0.16 | 0.20 |
| 22:0 | A | 0.34 | 0.46 |
| 23:0 | B | 0.12 | 0.19 |
| 24:0 | A | 0.32 | 0.48 |
| 12:1 | C | 0.01 | 0.01 |
| 14:1 | C | 0.08 | 0.08 |
| 16:1n-7 | A | 1.59 | 1.58 |
| 18:1n-7 | A3 | 1.50 | 1.38 |
| 18:1n–9 | A | 17.14 | 17.28 |
| 20:1n–9 | B | 0.13 | 0.16 |
| 22:1n–9 | B4 | 0.05 | 0.07 |
| 24:1n–9 | A | 0.51 | 0.72 |
| 20:3n–9 | A5 | 0.05 | 0.05 |
| 18:2n–6 | A | 27.93 | 28.65 |
| 18:3n–6 | A | 0.33 | 0.37 |
| 20:2n–6 | A5 | 0.14 | 0.25 |
| 20:3n–6 | A | 0.86 | 0.97 |
| 20:4n–6 | A | 5.24 | 5.68 |
| 22:2n–6 | C | 0.04 | 0.08 |
| 22:4n–6 | A5 | 0.11 | 0.14 |
| 22:5n–6 | A5 | 0.08 | 0.12 |
| 18:3n–3 | A | 0.82 | 0.88 |
| 20:3n–3 | C | 0.04 | 0.02 |
| 20:5n–3 | A | 2.18 | 2.52 |
| 22:5n–3 | A | 0.59 | 0.65 |
| 22:6n–3 | A | 2.59 | 2.80 |
| 16:1t9 | C | 0.01 | |
| 18:1t6–8 | C | 0.04 | |
| 18:1t9 | C | 0.10 | |
| 18:1t10 | C | 0.11 | |
| 18:1t11 | C | 0.11 | |
| 18:1t12 | C | 0.08 | |
| 18:1t13 | C | 0.16 | |
| 18:1c12 | C | 0.11 | |
| 18:1c16 | C | 0.09 | |
| 18:2c9t12 | C | 0.11 | |
| 18:2t9c12 | C | 0.05 | |
| 18:2c9t11 CLA | C | 0.05 |
1Data presented as relative percentages of total fatty acids (%, wt:wt). CLA, conjugated linoleic acid; GC, gas chromatography; FID, flame ionization detector; RBC, red blood cell.
2Category definitions are: A, abundance >0.30% of total or, if below, of important physiologic relevance; B, abundance between 0.10 and 0.30% and detectable on a general Carbowax capillary GC column; C, low-abundance fatty acids typically requiring high-polarity GC columns for detection.
318:1n–7 can coelute with 18:1n–9 under certain GC-FID conditions and therefore should be reported as 18:1 to indicate a summation.
4Fatty acid included in category B based on abundance in RBCs.
5Fatty acid included in category A based on physiologic relevance rather than abundance.
The sum of the fatty acids in the various blood fraction profiles should reflect ≥95% of the total plasma fatty acids at minimum, with >97% being desirable. The mean number of reported fatty acids noted above, 9.4 ± 5.8, would not fit this criterion. Recognizing that an increase of 10% in many fatty acids is biologically important, the choice of base is clearly important for any particular study. Moreover, systematic reviews and meta-analyses would suffer substantial increases in uncertainty, which would bias toward the null result solely based on nonstandardized analysis. Additional fatty acids may need to be identified for other human tissue pools (e.g., skin) or foods.
Recommendation 16) Fatty acid base. The base of total fatty acids used in profile calculations should be specified, and the range of fatty acids marked in Table 1, particularly those in category A, should be reported to enable secondary calculations and interpretation.
Analytical chemical considerations
Response factors by equal weight external standard
Fatty acid profiles are panels of fatty acid measurements. Each measured fatty acid is an integrated peak area that must be calibrated in some way to yield interpretable results. The classic method for calibration is via response factors (97). Responses vary depending on instrument settings. In a classical GC-FID, the major variation is in the injector owing to differential loading of FAME onto the capillary column during split injection (98), with the detector responding similarly to each fatty acid according to its carbon and hydrogen content. Response factors are determined by preparing an external standard mixture of FAME all at equal weight, or known unequal weight, and applying a correction to the raw areas based on the differential response. Typically, a single fatty acid of strong intensity in the external standard and the samples, such as 16:0, will be chosen as a base. Alternatively, the instrument settings can be adjusted to yield equal raw areas across the range of relevant fatty acids, so that no correction is needed later. Area percentages are raw data. They are generally biased measures unless calibrated, and should not be reported as representative of fatty acid abundances (98).
For GC/MS, response factors are particularly critical because the response depends on the ionization and fragmentation behavior of each FAME and the ions chosen to quantify FAME. As a general rule, GC/MS is not recommended for quantitative analysis because the FID is a more stable and more linear detector.
Recommendation 17) Relative response calibration. In practice, response factors should be evaluated daily.
Internal standards
Internal standards are added quantitatively to a sample mixture to calibrate the signal at the step where addition occurs and for all subsequent steps. Their advantage is that they parallel the chemistry of the analyte, including losses, during all protocol steps. For water-soluble analytes, methods have been established for treating internal standards (IS) (99). However, for lipid analyses in biological mixtures, >1 phase is present in starting materials, thus the concentration of the IS is an unknown partitioned between the phases. Therefore, IS are not appropriate until lipid is extracted into a single phase unless the partitioning behavior of the IS in the specific protocol has been specifically examined. IS can be added when there is one phase in an extract mixture, such as the single-phase water:methanol:chloroform mixture of the Bligh and Dyer method (79), to evaluate the extraction and instrument response. The standard should be a fatty acid that is reliably found at negligible concentrations in the sample, appears at a retention time that is free of interferences, is added at a concentration to provide a peak height within the range of fatty acids to be calibrated, such as 5% of the total fatty acids or a ratio of 1:20, and may be added as a target lipid class (e.g., diacyl phosphatidylcholine) of interest to accurately track the behavior of the target analyte. If mass spectrometry is used, then an isotopically labeled species is appropriate, or possibly GC can be used to isolate deuterated FAME chromatographically. Depending on the target fatty acids and the questions being addressed, it is not always possible or desirable to add IS, and the fatty acid profile can stand on its own.
When appropriate, IS should be added quantitatively so that a calibration factor can be derived in the units of concentration per count, for instance milligrams of fatty acids per milliliter of FAME mixture per raw data count. These can then be applied to calibrated profile area percentages to determine concentrations of all FAME in the extraction mixture. Conversion factors to the sample sizes (e.g., milliliters) and customary units (milligrams of fatty acids per deciliter of plasma) yield the final results.
IS are not needed for all studies. Cases of complex FAME mixtures where there is no flat baseline to include IS, or those in which only fatty acid profiles are desired, need no IS, although all require response calibration from an external standard.
Recommendation 18) Internal standards. The rationale and procedure for IS should be reported, when used.
FAME separation and identification
Baseline separation is recognized as ideal for quantitative analysis; however, this is not possible when a large number of analytes exist in a complex mixture (100). GC parameters should be adjusted to enable baseline separation of target peaks, particularly those of low relative abundance, as well as symmetric peak shapes to enable accurate and precise area integration by conventional techniques.
Positive identification of FAME, including double-bond position and geometry, and chain branching, which excludes all but one correct structure, generally requires higher end equipment and methods than are available in most laboratories or can be justified for all samples. At a minimum, retention times and molecular weights should match those of genuine standards. Laboratories that do not have advanced methods should adhere carefully to sample types with a known pattern of FAME, for instance, the various blood lipid or lipoprotein groups or cell types. Non-FAME compounds eluting in FAME analyses include plasticizers, antioxidants and their reaction products, and peaks originating from unknown sources. All unknown peaks appearing in one or more chromatograms in a series should be evaluated as to whether they are FAME or not. Methods for estimating retention times, such as Kovats retention indexes, can be executed without access to mass spectrometry.
Recommendation 19) Fatty acid identity. The identity of all FAME must be established for accurate analysis, and the methods used must be reported in the paper or supplementary materials.
LC-MS
LC-MS/MS is the standard method for pharmaceutical analyses of drugs and metabolites. The recommendation for the methodology used for method validation and QC is long established (99). The rise of “omics” techniques and especially targeted analyte panels is analogous to the fatty acid profile used for decades by GC (3). Generally, high-performance methods are needed to provide similar specificity of qualitative analysis for structure, separation power, and quantitative analysis as high-resolution GC. LC-MS can also be used for analysis of intact glycerolipids, but is not recommended as a method to assess the overall fatty acid profile because of difficulties calibrating the vast number of chemically distinct species in a single biological sample. Hydrolyzed fatty acid LC analysis is analogous to FAME analysis by GC.
Recommendation 20) Comprehensive analysis. When LC-MS is necessary, panels of fatty acids encompassing at least the same range that are routine in GC should be analyzed qualitatively and quantitatively.
Method validation and QC
The validation and QC for laboratory fatty acid measurements may be established in part to be consistent with the validation principles for drugs, as stated in the Food and Drug Administration's Guidance for industry: bioanalytical method validation (101) and reported by Shah et al. (99). Analytical figures of merit include intra-day and inter-day precision, accuracy, linearity range, and should be established by appropriate working standards. Validation should be conducted when fatty acid analyses are new to a laboratory or when a method is modified in a chemical procedure such as a high-throughput assay, microwave irradiation, or instrumental parameters such as fast GC, and/or use of high-efficiency columns.
For assessment of accuracy, the results from the repeated measurements of same sample by the new laboratory or the new method will be compared with those by an established laboratory or one of the conventional methods (e.g., Folch, Bligh and Dyer, or Lepage and Roy).
Precision of concentration measurements (e.g., milligrams of fatty acids per milliliter of plasma) is acceptable at the ±15% CV level through the linear range and ±20% at the lowest level of quantification, as recommended for conventional measurements by Shah et al. (99). Precision for data expressed as percentage by weight should be considerably improved compared with these criteria (the descriptive words “improved” and “poorer” are used to refer to precision, rather than “lower precision”, which can be confused with a smaller SD, for instance), with major peaks (>3% of total fatty acids) having a CV of <5%. Precision for minor peaks is poorer and depends on the peak abundance. Precision and accuracy must be fit for purpose, where the hypothesis is stated a priori as a part of the study aims and will often be addressed implicitly in a power calculation. A reasonable reference point is the biological variability of the specific fatty acids in the population under study or the closest population for which data are available. For instance, the test-retest SD should be lower than the SD of the population.
Precision and lower limits of quantification are always functions of signal intensity. When injected masses or concentrations (depending on the technique) are unnecessarily low, precision is unnecessarily low and minor peaks can fall below quantifiable limits. Undetected fatty acids pose statistical dilemmas, as their treatment as missing values, or as zero, influences the outcome of statistical analysis (87). Care should be taken to ensure that all relevant peaks are on scale. Linearity should be established for specific instruments. A common solution to a limited linear dynamic range is to inject samples of different concentrations or quantities and bridge the data in the 2 chromatograms using intermediate intensity peaks that are on scale in both injections. Most reports record “not detected” or “trace” to reflect no signal or a signal below the quantifiable limit, respectively. It is far more useful to estimate, by similar detected or quantified signals, the ability of the protocol, including important but unreported details, like injected quantity and concentration, to detect particular low concentration fatty acids.
Recommendation 21) Minimal detectable limits. Limits of detection or lower limits of quantification should be reported when fatty acids are not detected or quantified.
QC should be conducted routinely for both chemical procedures and instrumental performance in all laboratories. One recommended QC standard sample is the certified NIST SRMs for fatty acid measurement containing high, middle, and low concentrations of fatty acids. Others can be laboratory working standards containing fatty acids within a close range of those in the samples of interest. The frequency of QC testing for fatty acid measurement will depend on the number of samples, such as adding one QC sample every 100 samples or one for each batch of high-throughput fatty acid assays. A QC test for instrument performance can apply the reference standard, either as single fatty acids or as a mixture of fatty acids of known weights for checking the retention time, resolution of peaks, and response factors. The frequency of this QC test should be on a regular basis (e.g., once every week or every 100 samples).
Laboratories are encouraged to participate in a quality assurance program, such as the NIST/NIH fatty acid Quality Assurance Program, on a regular basis, such as once every 6 y.
Recommendation 22) Quality control. Reports should specify the QC procedures used for sample analyses.
In conclusion, though fatty acid studies are among the most common in nutrition and biomedicine, their translation into recommendations is limited by heterogeneity and limited comparability owing to differences between studies in design, analysis, reporting, and interpretation. The contemporary trend of combining studies in systematic reviews and meta-analyses tends to include all studies fitting particular criteria. However, such reviews often only refer to outlines of published details. Peer-reviewed primary reports of clinical studies are more thorough in their vetting and reporting of statistics than in the many details specific to fatty acid metabolism and analysis. Careful attention to the many known details is expected to improve the accuracy and precision of results from study to study.
In the 1950s, the eminent chemist Irving Langmuir described a hallmark of scientific inquiry: “As measurements are refined, the signal rises out of the noise” (102). The converse is also true, that failure to carefully control known sources of random and systematic noise—unrefined measurements—swamps signals. In the case of fatty acid studies, those signals are biomarkers and health outcomes.
We offer in Table 2 the collected recommendations from this document that can serve study designers, principal investigators, researchers, reviewers, and readers. It is intended to serve as a checklist for publication of fatty acid studies on a clinical and experimental basis.
TABLE 2.
Checklist of Recommendations: Fatty Acid Best Practices, organized in order of appearance and grouped according to the major headings in the text1
| Fatty acid trials. The independent variable |
| 1) Treatment fatty acids. All fatty acids in the food or supplements relevant to the issue under investigation must be analyzed and defined. |
| 2) Sampled pool. The rationale for the choice of blood pool should be stated and justified with respect to the biological research question, taking into account logistic issues with respect to study design. |
| 3) Intervention length. Intervention length should be rationalized based on the hypothesis. |
| 4) Control composition. Control (comparator/placebo) doses should be chosen to be neutral with respect to the outcome, considering the known metabolism and concentrations of dietary fat with respect to the hypothesis and the study population. |
| 5) Biological responsiveness. The responsiveness of the target fatty acid pools should be considered with respect to the chosen intervention doses and duration. |
| 6) Fatty acid dynamics. Dietary fatty acid exposure and implications for well-established principles of fatty acid metabolism must be taken into account for interpreting the diet-blood relationship. |
| 7) Data analysis principles. All fatty acid intervention trials should report ≥1 measure of fatty acid concentration within a specified biological compartment so as to enable analysis on both an ITT and a PP basis. |
| 8) Fatty acid ranges. Intervention-based changes in circulating fatty acids should be compared with previous literature reports to establish that they fall into expected ranges. |
| Sample collection procedures |
| 9) Population and blood pool ranges. Levels of particular or summed fatty acids, such as n–3 fatty acids, are modified in specific populations and/or blood pools. These changes should be taken into account when interpreting the results. |
| 10) Relevant physiologic state. Reports should outline medical, physiologic and behavioral conditions that may influence fatty acid target outcomes and discuss steps taken to minimize their effects. |
| Sample preparation and analysis |
| 11) Sample integrity during storage. Details of sampling and storage should be reported, including timing between sampling and analysis, storage temperature, duration, and any antioxidant/protectant used. |
| 12) Fit-for-purpose sample preparation. The method used to extract fatty acids and derivatize fatty acids to FAME should be explicitly stated and reference to the original studies of their use should be cited. |
| 13) Analytical chemical fidelity. Methods should be reported in sufficient detail to unequivocally establish fatty acid identity and resolution. |
| Reporting |
| 14) Fatty acid units. The rationale for primary reporting of fatty acid profile or absolute fatty acid concentration should be reported with respect to the hypotheses. |
| 15) Data interconvertibility. Regardless of the choice of primary reporting method, all reports should include sufficient data to convert relative to absolute concentrations and vice versa. |
| 16) Fatty acid base. The base of total fatty acids used in profile calculations should be specified, and the range of fatty acids marked in Table 1, particularly those in category A, should be reported to enable secondary calculations and interpretation. |
| 17) Relative response calibration. In practice, response factors should be evaluated daily. |
| 18) Internal standards. The rationale and procedure for IS should be reported, when used. |
| 19) Fatty acid identity. The identity of all FAME must be established for accurate analysis, and the methods used must be reported in the paper or supplementary materials. |
| 20) Comprehensive analysis. When LC/MS is necessary, panels of fatty acids encompassing at least the same range that are routine in GC should be analyzed qualitatively and quantitatively. |
| 21) Minimal detectable limits. Limits of detection or lower limits of quantification should be reported when fatty acids are not detected or quantified. |
| 22) Quality control. Reports should specify the QC procedures used for sample analyses. |
1FAME, fatty acid methyl ester; IS, internal standards; ITT, intent-to-treat; LC, liquid chromatography; MS, mass spectrometry; PP, per protocol; QC, quality control.
Just as importantly, this set of recommendations may be considered a template for analogous studies in the contemporary “omics” fields in which large panels of analytes or analytical features are intended as indicators of phenotype. Fatty acid panels are among the first routinely measured and reported big data panels, with hundreds of studies published by 1960 (3) and at a pace accelerating through the years. The refinements of careful researchers over the decades should be built upon to enable the resolution of modern issues in the health sciences.
Supplementary Material
ACKNOWLEDGEMENTS
The authors thank the ILSI North American Lipid Committee for providing travel support to enable collaborative writing meetings and for facilitating input from fatty acid research experts worldwide. Special gratitude goes to Barbara Lyle, who served as the ILSI liaison and kept the project on track. The authors thank the input of the experts who provided suggestions on the first draft of the manuscript: Graham Burdge, Philip Calder, Kevin Fritsche, William Harris, David Klurfeld, David Ma, Michael McBurney, Ronald Mensink, Marion Neuhouser, Jack Odle, Marius Smuts, and Kuan-Pin Su. The content of the final publication is the responsibility of the authors.
The authors’ responsibilities were as follows—all authors: contributed original writing and approved the final version of the manuscript. All authors declare no conflicts of interest.
Notes
MP holds a new investigator salary award from the Canadian Institutes of Health Research and Fonds de recherche Québec-Santé. KS holds a Canada Research Chair in Nutritional Lipidomics and receives salary support from the Canada Research Chairs program. This work was supported (in part) by travel grants from the North American branch of the International Life Sciences Institute (ILSI NA). ILSI NA is a public, nonprofit foundation that provides a forum to advance understanding of scientific issues related to the nutritional quality and safety of the food supply by sponsoring research programs, educational seminars and workshops, and publications. It receives support primarily from its industry membership. ILSI NA had no role in the scope, drafting, review, or final approval of the manuscript. The opinions expressed herein are those of the authors and do not necessarily represent the views of ILSI.
Supplemental Tables 1–3 are available from the “Supplementary data” link in the online posting of the article and from the same link in the online table of contents at https://academic.oup.com/ajcn/.
Abbreviations used: BHT, butylated hydroxytoluene; FAME, fatty acid methyl esters; FAQAP, fatty acid quality assurance program; FID, flame ionization detector; GC, gas chromatography; HUFA, highly unsaturated fatty acid (≥3 carbon-carbon double bonds); IS, internal standards; ITT, intent-to-treat; LC, liquid chromatography; MS, mass spectrometer; NEFA, nonesterified fatty acid; NIST, National Institute of Standards and Technology; PL, phospholipid; PP, per protocol; QC, quality control; RBC, red blood cell; RCT, randomized controlled trial; SRM, standard reference material; TG, triacylglycerol, also known as triglyceride; TL, total lipid.
REFERENCES
- 1. Primec M, Micetic-Turk D, Langerholc T. Analysis of short-chain fatty acids in human feces: a scoping review. Anal Biochem 2017;526:9–21. [DOI] [PubMed] [Google Scholar]
- 2. van der Steege G, Muskiet FA, Martini IA, Hutter NH, Boersma ER. Simultaneous quantification of total medium- and long-chain fatty acids in human milk by capillary gas chromatography with split injection. J Chromatogr 1987;415(1):1–11. [DOI] [PubMed] [Google Scholar]
- 3. Brenna JT. Fatty acid analysis by high resolution gas chromatography and mass spectrometry for clinical and experimental applications. Curr Opin Clin Nutr Metab Care 2013;16(5):548–54. [DOI] [PubMed] [Google Scholar]
- 4. Hodson L, Skeaff CM, Fielding BA. Fatty acid composition of adipose tissue and blood in humans and its use as a biomarker of dietary intake. Prog Lipid Res 2008;47(5):348–80. [DOI] [PubMed] [Google Scholar]
- 5. Stark KD, Van Elswyk ME, Higgins MR, Weatherford CA, Salem N Jr. Global survey of the omega-3 fatty acids, docosahexaenoic acid and eicosapentaenoic acid in the blood stream of healthy adults. Prog Lipid Res 2016;63:132–52. [DOI] [PubMed] [Google Scholar]
- 6. Christie WW. Rapid separation and quantification of lipid classes by high performance liquid chromatography and mass (light-scattering) detection. J Lipid Res 1985;26(4):507–12. [PubMed] [Google Scholar]
- 7. Perez-Martinez P, Delgado-Lista J, Perez-Jimenez F, Lopez-Miranda J. Update on genetics of postprandial lipemia. Atheroscler Suppl 2010;11(1):39–43. [DOI] [PubMed] [Google Scholar]
- 8. Klem S, Klingler M, Demmelmair H, Koletzko B. Efficient and specific analysis of red blood cell glycerophospholipid fatty acid composition. PLoS One 2012;7(3):e33874. [DOI] [PMC free article] [PubMed] [Google Scholar]
- 9. Ma DW, Arendt BM, Hillyer LM, Fung SK, McGilvray I, Guindi M, Allard JP. Plasma phospholipids and fatty acid composition differ between liver biopsy-proven nonalcoholic fatty liver disease and healthy subjects. Nutr Diabetes 2016;6(7):e220. [DOI] [PMC free article] [PubMed] [Google Scholar]
- 10. Martinez M, Mougan I. Fatty acid composition of human brain phospholipids during normal development. J Neurochem 1998;71(6):2528–33. [DOI] [PubMed] [Google Scholar]
- 11. Rocquelin G, Guenot L, Astorg PO, David M. Phospholipid content and fatty acid composition of human heart. Lipids 1989;24(9):775–80. [DOI] [PubMed] [Google Scholar]
- 12. Christie WW. Lipid analysis: isolation, separation, identification and structural analysis of lipids. 3 ed Bridgwater (United Kingdom): The Oily Press; 2003. [Google Scholar]
- 13. Klingler M, Demmelmair H, Koletzko B, Glaser C. Fatty acid status determination by cheek cell sampling combined with methanol-based ultrasound extraction of glycerophospholipids. Lipids 2011;46(10):981–90. [DOI] [PubMed] [Google Scholar]
- 14. Harris WS, Von Schacky C. The Omega-3 Index: a new risk factor for death from coronary heart disease? Prev Med 2004;39(1):212–20. [DOI] [PubMed] [Google Scholar]
- 15. Metherel AH, Stark KD. The stability of blood fatty acids during storage and potential mechanisms of degradation: a review. Prostaglandins Leukot Essent Fatty Acids 2016;104:33–43. [DOI] [PubMed] [Google Scholar]
- 16. Tuck MK, Chan DW, Chia D, Godwin AK, Grizzle WE, Krueger KE, Rom W, Sanda M, Sorbara L, Stass S et al.. Standard operating procedures for serum and plasma collection: early detection research network consensus statement standard operating procedure integration working group. J Proteome Res 2009;8(1):113–7. [DOI] [PMC free article] [PubMed] [Google Scholar]
- 17. Metherel AH, Stark KD. Cryopreservation prevents iron-initiated highly unsaturated fatty acid loss during storage of human blood on chromatography paper at –20 degrees C. J Nutr 2015;145(3):654–60. [DOI] [PubMed] [Google Scholar]
- 18. Reed CF, Swisher SN, Marinetti GV, Eden EG. Studies of the lipids of the erythrocyte. I. Quantitative analysis of the lipids of normal human red blood cells. J Lab Clin Med 1960;56(2):281–9. [PubMed] [Google Scholar]
- 19. Rose HG, Oklander M. Improved procedure for the extraction of lipids from human eryhtrocytes. J Lipid Res 1965;6:428–31. [PubMed] [Google Scholar]
- 20. Shemin D, Rittenberg D. The life span of the human red blood cell. J Biol Chem 1946;166(2):627–36. [PubMed] [Google Scholar]
- 21. Katan MB, Deslypere JP, van Birgelen AP, Penders M, Zegwaard M. Kinetics of the incorporation of dietary fatty acids into serum cholesteryl esters, erythrocyte membranes, and adipose tissue: an 18-month controlled study. J Lipid Res 1997;38(10):2012–22. [PubMed] [Google Scholar]
- 22. Staufenbiel M. Fatty acids covalently bound to erythrocyte proteins undergo a differential turnover in vivo. J Biol Chem 1988;263(27):13615–22. [PubMed] [Google Scholar]
- 23. Metherel AH, Armstrong JM, Patterson AC, Stark KD. Assessment of blood measures of n–3 polyunsaturated fatty acids with acute fish oil supplementation and washout in men and women. Prostaglandins Leukot Essent Fatty Acids 2009;81(1):23–9. [DOI] [PubMed] [Google Scholar]
- 24. Browning LM, Walker CG, Mander AP, West AL, Madden J, Gambell JM, Young S, Wang L, Jebb SA, Calder PC. Incorporation of eicosapentaenoic and docosahexaenoic acids into lipid pools when given as supplements providing doses equivalent to typical intakes of oily fish. Am J Clin Nutr 2012;96(4):748–58. [DOI] [PMC free article] [PubMed] [Google Scholar]
- 25. Connor J, Pak CH, Zwaal RF, Schroit AJ. Bidirectional transbilayer movement of phospholipid analogs in human red blood cells. Evidence for an ATP-dependent and protein-mediated process. J Biol Chem 1992;267(27):19412–7. [PubMed] [Google Scholar]
- 26. Patterson AC, Metherel AH, Hanning RM, Stark KD. The percentage of DHA in erythrocytes can detect non-adherence to advice to increase EPA and DHA intakes. Br J Nutr 2014;111(2):270–8. [DOI] [PubMed] [Google Scholar]
- 27. Fekete K, Marosvolgyi T, Jakobik V, Decsi T. Methods of assessment of n–3 long-chain polyunsaturated fatty acid status in humans: a systematic review. Am J Clin Nutr 2009;89(6):2070S–84S. [DOI] [PubMed] [Google Scholar]
- 28. Baylin A, Campos H. The use of fatty acid biomarkers to reflect dietary intake. Curr Opin Lipidol 2006;17(1):22–7. [DOI] [PubMed] [Google Scholar]
- 29. Mohrhauer H, Christiansen K, Gan MV, Deubig M, Holman RT. Chain elongation of linoleic acid and its inhibition by other fatty acids in vitro. J Biol Chem 1967;242(19):4507–14. [PubMed] [Google Scholar]
- 30. Mohrhauer H, Holman RT. Effect of linolenic acid upon the metabolism of linoleic acid. J Nutr 1963;81:67–74. [DOI] [PubMed] [Google Scholar]
- 31. Yelland LN, Makrides M, McPhee AJ, Quinlivan J, Gibson RA. Importance of adequate sample sizes in fatty acid intervention trials. Prostaglandins Leukot Essent Fatty Acids 2016;107:8–11. [DOI] [PubMed] [Google Scholar]
- 32. Senanayake VK, Pu S, Jenkins DA, Lamarche B, Kris-Etherton PM, West SG, Fleming JA, Liu X, McCrea CE, Jones PJ. Plasma fatty acid changes following consumption of dietary oils containing n–3, n–6, and n–9 fatty acids at different proportions: preliminary findings of the Canola Oil Multicenter Intervention Trial (COMIT). Trials 2014;15:136. [DOI] [PMC free article] [PubMed] [Google Scholar]
- 33. Lands WE. Long-term fat intake and biomarkers. Am J Clin Nutr 1995;61(3 Suppl):721S–5S. [DOI] [PubMed] [Google Scholar]
- 34. King IB, Lemaitre RN, Kestin M. Effect of a low-fat diet on fatty acid composition in red cells, plasma phospholipids, and cholesterol esters: investigation of a biomarker of total fat intake. Am J Clin Nutr 2006;83(2):227–36. [DOI] [PubMed] [Google Scholar]
- 35. Plourde M, Cunnane SC. Extremely limited synthesis of long chain polyunsaturates in adults: implications for their dietary essentiality and use as supplements. Appl Physiol Nutr Metab 2007;32(4):619–34. [DOI] [PubMed] [Google Scholar]
- 36. Taha AY, Cheon Y, Faurot KF, Macintosh B, Majchrzak-Hong SF, Mann JD, Hibbeln JR, Ringel A, Ramsden CE. Dietary omega-6 fatty acid lowering increases bioavailability of omega-3 polyunsaturated fatty acids in human plasma lipid pools. Prostaglandins Leukot Essent Fatty Acids 2014;90(5):151–7. [DOI] [PMC free article] [PubMed] [Google Scholar]
- 37. Schuchardt JP, Ostermann AI, Stork L, Kutzner L, Kohrs H, Greupner T, Hahn A, Schebb NH. Effects of docosahexaenoic acid supplementation on PUFA levels in red blood cells and plasma. Prostaglandins Leukot Essent Fatty Acids 2016;115:12–23. [DOI] [PubMed] [Google Scholar]
- 38. Patterson AC, Chalil A, Aristizabal Henao JJ, Streit IT, Stark KD. Omega-3 polyunsaturated fatty acid blood biomarkers increase linearly in men and women after tightly controlled intakes of 0.25, 0.5, and 1 g/d of EPA + DHA. Nutr Res 2015;35(12):1040–51. [DOI] [PubMed] [Google Scholar]
- 39. Dhurandhar NV, Schoeller D, Brown AW, Heymsfield SB, Thomas D, Sorensen TI, Speakman JR, Jeansonne M, Allison DB, Energy Balance Measurement Working Group Energy balance measurement: when something is not better than nothing. Int J Obes (Lond) 2015;39(7):1109–13. [DOI] [PMC free article] [PubMed] [Google Scholar]
- 40. Lundebye AK, Lock EJ, Rasinger JD, Nostbakken OJ, Hannisdal R, Karlsbakk E, Wennevik V, Madhun AS, Madsen L, Graff IE et al.. Lower levels of Persistent Organic Pollutants, metals and the marine omega 3-fatty acid DHA in farmed compared to wild Atlantic salmon (Salmo salar). Environ Res 2017;155:49–59. [DOI] [PubMed] [Google Scholar]
- 41. Mahaffey KR. Fish and shellfish as dietary sources of methylmercury and the omega-3 fatty acids, eicosahexaenoic acid and docosahexaenoic acid: risks and benefits. Environ Res 2004;95(3):414–28. [DOI] [PubMed] [Google Scholar]
- 42. Chowdhury R, Warnakula S, Kunutsor S, Crowe F, Ward HA, Johnson L, Franco OH, Butterworth AS, Forouhi NG, Thompson SG et al.. Association of dietary, circulating, and supplement fatty acids with coronary risk: a systematic review and meta-analysis. Ann Intern Med 2014;160(6):398–406. [DOI] [PubMed] [Google Scholar]
- 43. Stark KD, Aristizabal Henao JJ, Metherel AH, Pilote L. Translating plasma and whole blood fatty acid compositional data into the sum of eicosapentaenoic and docosahexaenoic acid in erythrocytes. Prostaglandins Leukot Essent Fatty Acids 2016;104:1–10. [DOI] [PubMed] [Google Scholar]
- 44. Block RC, Harris WS, Pottala JV. Determinants of blood cell omega-3 fatty acid content. Open Biomark J 2008;1:1–6. [DOI] [PMC free article] [PubMed] [Google Scholar]
- 45. Flock MR, Skulas-Ray AC, Harris WS, Etherton TD, Fleming JA, Kris-Etherton PM. Determinants of erythrocyte omega-3 fatty acid content in response to fish oil supplementation: a dose-response randomized controlled trial. J Am Heart Assoc 2013;2(6):e000513. [DOI] [PMC free article] [PubMed] [Google Scholar]
- 46. Stark KD, Beblo S, Murthy M, Whitty JE, Buda-Abela M, Janisse J, Rockett H, Martier SS, Sokol RJ, Hannigan JH et al.. Alcohol consumption in pregnant, black women is associated with decreased plasma and erythrocyte docosahexaenoic acid. Alcohol Clin Exp Res 2005;29(1):130–40. [DOI] [PubMed] [Google Scholar]
- 47. Hodson L, Skeaff CM, Wallace AJ, Arribas GL. Stability of plasma and erythrocyte fatty acid composition during cold storage. Clin Chim Acta 2002;321(1-2):63–7. [DOI] [PubMed] [Google Scholar]
- 48. Giltay EJ, Gooren LJ, Toorians AW, Katan MB, Zock PL. Docosahexaenoic acid concentrations are higher in women than in men because of estrogenic effects. Am J Clin Nutr 2004;80(5):1167–74. [DOI] [PubMed] [Google Scholar]
- 49. Gillingham LG, Harding SV, Rideout TC, Yurkova N, Cunnane SC, Eck PK, Jones PJ. Dietary oils and FADS1-FADS2 genetic variants modulate [13C]alpha-linolenic acid metabolism and plasma fatty acid composition. Am J Clin Nutr 2013;97(1):195–207. [DOI] [PubMed] [Google Scholar]
- 50. Plourde M, Vohl MC, Vandal M, Couture P, Lemieux S, Cunnane SC. Plasma n–3 fatty acid response to an n–3 fatty acid supplement is modulated by apoE epsilon4 but not by the common PPAR-alpha L162V polymorphism in men. Br J Nutr 2009;102(8):1121–4. [DOI] [PubMed] [Google Scholar]
- 51. Kothapalli KS, Ye K, Gadgil MS, Carlson SE, O'Brien KO, Zhang JY, Park HG, Ojukwu K, Zou J, Hyon SS et al.. Positive selection on a regulatory insertion-deletion polymorphism in FADS2 influences apparent endogenous synthesis of arachidonic acid. Mol Biol Evol 2016;33(7):1726–39. [DOI] [PMC free article] [PubMed] [Google Scholar]
- 52. Schantz MM, Powers CD, Schleicher R. Interlaboratory analytical comparison study of total fatty acid concentrations in human serum: results for Exercise 01: QA12FASER01. Gaithersburg (MD): NISTIR; 2013. [Google Scholar]
- 53. Harris WS, Pottala JV, Varvel SA, Borowski JJ, Ward JN, McConnell JP. Erythrocyte omega-3 fatty acids increase and linoleic acid decreases with age: observations from 160,000 patients. Prostaglandins Leukot Essent Fatty Acids 2013;88(4):257–63. [DOI] [PubMed] [Google Scholar]
- 54. Plourde M, Chouinard-Watkins R, Rioux-Perreault C, Fortier M, Dang MTM, Allard M-J, Tremblay-Mercier J, Zhang Y, Lawrence P, Vohl M-C et al.. Kinetics of 13C-DHA before and during fish-oil supplementation in healthy older individuals. Am J Clin Nutr 2014;100(1):105–12. [DOI] [PubMed] [Google Scholar]
- 55. McCloy U, Ryan MA, Pencharz PB, Ross RJ, Cunnane SC. A comparison of the metabolism of eighteen-carbon 13C-unsaturated fatty acids in healthy women. J Lipid Res 2004;45(3):474–85. [DOI] [PubMed] [Google Scholar]
- 56. Simundic AM, Cornes M, Grankvist K, Lippi G, Nybo M. Standardization of collection requirements for fasting samples: for the Working Group on Preanalytical Phase (WG-PA) of the European Federation of Clinical Chemistry and Laboratory Medicine (EFLM). Clin Chim Acta 2014;432:33–7. [DOI] [PubMed] [Google Scholar]
- 57. Metherel AH, Buzikievich LM, Charkhzarin P, Patterson AC, Peel AC, Howorth AM, Kishi DM, Stark KD. Omega-3 polyunsaturated fatty acid profiling using fingertip-prick whole blood does not require overnight fasting before blood collection. Nutr Res 2012;32(8):547–56. [DOI] [PubMed] [Google Scholar]
- 58. Zaratin AC, Bertolami MC, Faludi AA, Rocha JC, Nunes VS, Nakandakare ER, Quintao EC, de Faria EC. Acute in vivo chylomicron metabolism and postalimentary lipoprotein alterations in normolipidemic male smokers. Clin Chim Acta 2001;305(1–2):99–105. [DOI] [PubMed] [Google Scholar]
- 59. Cooper GR, Myers GL, Smith SJ, Schlant RC. Blood lipid measurements. Variations and practical utility. JAMA 1992;267(12):1652–60. [PubMed] [Google Scholar]
- 60. Statland BE, Winkel P. Variations of cholesterol and total lipid concentrations in sera of healthy young men. Differentiating analytic error from biologic variability. Am J Clin Pathol 1976;66(6):935–43. [DOI] [PubMed] [Google Scholar]
- 61. Sacchetto E, Ali D, Dumontet E, Le Carrer D, Orsonneau JL, Delaroche O, Bigot-Corbel E. [Influence of anticoagulant on the plasma level of fifteen biochemical parameters.] Ann Biol Clin (Paris) 2014;72(3):337–50. [DOI] [PubMed] [Google Scholar]
- 62. Armstrong JM, Metherel AH, Stark KD. Direct microwave transesterification of fingertip prick blood samples for fatty acid determinations. Lipids 2008;43(2):187–96. [DOI] [PubMed] [Google Scholar]
- 63. Magnusardottir AR, Skuladottir GV. Effects of storage time and added antioxidant on fatty acid composition of red blood cells at –20 degrees C. Lipids 2006;41(4):401–4. [DOI] [PubMed] [Google Scholar]
- 64. Halliwell B, Chirico S. Lipid peroxidation: its mechanism, measurement, and significance. Am J Clin Nutr 1993;57(5 Suppl):715S–24S; discussion 24S–25S. [DOI] [PubMed] [Google Scholar]
- 65. van den Berg JJ, Op den Kamp JA, Lubin BH, Roelofsen B, Kuypers FA. Kinetics and site specificity of hydroperoxide-induced oxidative damage in red blood cells. Free Radic Biol Med 1992;12(6):487–98. [DOI] [PubMed] [Google Scholar]
- 66. Matthan NR, Ip B, Resteghini N, Ausman LM, Lichtenstein AH. Long-term fatty acid stability in human serum cholesteryl ester, triglyceride, and phospholipid fractions. J Lipid Res 2010;51(9):2826–32. [DOI] [PMC free article] [PubMed] [Google Scholar]
- 67. Salo MK, Gey F, Nikkari T. Stability of plasma fatty acids at –20 degrees C and its relationship to antioxidants. Int J Vitam Nutr Res 1986;56(3):231–9. [PubMed] [Google Scholar]
- 68. Rogiers V. Stability of the long chain non-esterified fatty acid pattern in plasma and blood during different storage conditions. Clin Chim Acta 1978;84(1-2):49–54. [DOI] [PubMed] [Google Scholar]
- 69. Fox H, Ross BM, Tocher D, Horrobin D, Glen I, St Clair D. Degradation of specific polyunsaturated fatty acids in red blood cells stored at –20 degrees C proceeds faster in patients with schizophrenia when compared with healthy controls. Prostaglandins Leukot Essent Fatty Acids 2003;69(5):291–7. [DOI] [PubMed] [Google Scholar]
- 70. Hazlewood GP, Dawson RM. A phospholipid-deacylating system of bacteria active in a frozen medium. Biochem J 1976;153(1):49–53. [DOI] [PMC free article] [PubMed] [Google Scholar]
- 71. Kramer JM, Hulan HW. A comparison of procedures to determine free fatty acids in rat heart. J Lipid Res 1978;19(1):103–6. [PubMed] [Google Scholar]
- 72. Pottala JV, Espeland MA, Polreis J, Robinson J, Harris WS. Correcting the effects of –20 degrees C storage and aliquot size on erythrocyte fatty acid content in the Women's Health Initiative. Lipids 2012;47(9):835–46. [DOI] [PubMed] [Google Scholar]
- 73. Di Marino L, Maffettone A, Cipriano P, Celentano E, Galasso R, Iovine C, Berrino F, Panico S. Assay of erythrocyte membrane fatty acids. Effects of storage time at low temperature. Int J Clin Lab Res 2000;30(4):197–202. [DOI] [PubMed] [Google Scholar]
- 74. Stanford JL, King I, Kristal AR. Long-term storage of red blood cells and correlations between red cell and dietary fatty acids: results from a pilot study. Nutr Cancer 1991;16(3-4):183–8. [DOI] [PubMed] [Google Scholar]
- 75. Metherel AH, Aristizabal Henao JJ, Stark KD. EPA and DHA levels in whole blood decrease more rapidly when stored at –20 degrees C as compared with room temperature, 4 and –75 degrees C. Lipids 2013;48(11):1079–91. [DOI] [PubMed] [Google Scholar]
- 76. Liu G, Muhlhausler BS, Gibson RA. A method for long term stabilisation of long chain polyunsaturated fatty acids in dried blood spots and its clinical application. Prostaglandins Leukot Essent Fatty Acids 2014;91(6):251–60. [DOI] [PubMed] [Google Scholar]
- 77. Zivkovic AM, Wiest MM, Nguyen UT, Davis R, Watkins SM, German JB. Effects of sample handling and storage on quantitative lipid analysis in human serum. Metabolomics 2009;5(4):507–16. [DOI] [PMC free article] [PubMed] [Google Scholar]
- 78. Folch J, Lees M, Sloane Stanley GH. A simple method for the isolation and purification of total lipides from animal tissues. J Biol Chem 1957;226:497–509. [PubMed] [Google Scholar]
- 79. Bligh EG, Dyer WJ. A rapid method of total lipid extraction and purification. Can J Biochem Physiol 1959;37(8):911–7. [DOI] [PubMed] [Google Scholar]
- 80. Lepage G, Roy CC. Direct transesterification of all classes of lipids in a one-step reaction. J Lipid Res 1986;27:114–20. [PubMed] [Google Scholar]
- 81. Araujo P, Nguyen TT, Froyland L, Wang J, Kang JX. Evaluation of a rapid method for the quantitative analysis of fatty acids in various matrices. J Chromatogr A 2008;1212(1-2):106–13. [DOI] [PMC free article] [PubMed] [Google Scholar]
- 82. Bailey-Hall E, Nelson EB, Ryan AS. Validation of a rapid measure of blood PUFA levels in humans. Lipids 2008;43(2):181–6. [DOI] [PubMed] [Google Scholar]
- 83. Stark KD. Omega 3 and omega 6 fatty acids. Handbook of analysis of active compounds in functional foods. Boca Raton (FL): CRC Press; 2012:725–46. [Google Scholar]
- 84. Van Pelt CK, Brenna JT. Acetonitrile chemical ionization tandem mass spectrometry to locate double bonds in polyunsaturated fatty acid methyl esters. Anal Chem 1999;71(10):1981–9. [DOI] [PubMed] [Google Scholar]
- 85. Ran-Ressler RR, Lawrence P, Brenna JT. Structural characterization of saturated branched chain fatty acid methyl esters by collisional dissociation of molecular ions generated by electron ionization. J Lipid Res 2012;53(1):195–203. [DOI] [PMC free article] [PubMed] [Google Scholar]
- 86. Lands B. Measuring blood fatty acids as a surrogate indicator for coronary heart disease risk in population studies. World Rev Nutr Diet 2009;100:22–34. [DOI] [PubMed] [Google Scholar]
- 87. Mocking RJ, Assies J, Lok A, Ruhe HG, Koeter MW, Visser I, Bockting CL, Schene AH. Statistical methodological issues in handling of fatty acid data: percentage or concentration, imputation and indices. Lipids 2012;47(5):541–7. [DOI] [PMC free article] [PubMed] [Google Scholar]
- 88. Sergeant S, Ruczinski I, Ivester P, Lee TC, Morgan TM, Nicklas BJ, Mathias RA, Chilton FH. Impact of methods used to express levels of circulating fatty acids on the degree and direction of associations with blood lipids in humans. Br J Nutr 2016;115(2):251–61. [DOI] [PMC free article] [PubMed] [Google Scholar]
- 89. Wanders AJ, Alssema M, van Greevenbroek MJ, Elshorbagy A, Zock PL, Dekker JM, Brouwer IA. Letter to the Editor. Comment on Sergeant et al.: Impact of methods used to express levels of circulating fatty acids on the degree and direction of associations with blood lipids in humans. Br J Nutr 2016;115:2077–8. [DOI] [PubMed] [Google Scholar]
- 90. Walker CG, West AL, Browning LM, Madden J, Gambell JM, Jebb SA, Calder PC. The pattern of fatty acids displaced by EPA and DHA following 12 months supplementation varies between blood cell and plasma fractions. Nutrients 2015;7(8):6281–93. [DOI] [PMC free article] [PubMed] [Google Scholar]
- 91. Fisk HL, West AL, Childs CE, Burdge GC, Calder PC. The use of gas chromatography to analyze compositional changes of fatty acids in rat liver tissue during pregnancy. J Vis Exp 2014(85). [DOI] [PMC free article] [PubMed] [Google Scholar]
- 92. Godswill N-N, Frank N-EG, Edson M-YJ, Emmanuel Y, Martin BJ, Hermine N-B, Kingsley T-M, Constant L-L-NB, Armand N-M. GC-FID method development and validation parameters for analysis of palm oil (Elaeis guineensis Jacq.) fatty acids composition. Res Plant Sci 2014;2(3):53–66. [Google Scholar]
- 93. Zang LY, Kalbach HL, Brown B, Jackson LL, van Kuijk FJ. Elimination of n-butylated hydroxytoluene methylation during fatty acid analysis by gas chromatography. J Chromatogr B Biomed Appl 1996;677(2):209–16. [DOI] [PubMed] [Google Scholar]
- 94. Stark KD, Salem N Jr. Fast gas chromatography for the identification of fatty acid methyl esters from mammalian samples. Lipid Technol 2005;17(8):181–5. [Google Scholar]
- 95. Schantz MM. Interlaboratory analytical comparison study of fatty acid concentrations in human serum: results for Exercise 02: QA15FASER02. Gaithersburg (MD): NISTIR; 2015. [Google Scholar]
- 96. Schantz MM. Interlaboratory analytical comparison study of fatty acid concentrations in human serum: results for Exercise 03: QA16FASER03. Gaithersburg (MD): NISTIR; 2016. [Google Scholar]
- 97. Kuksis A. Quantitative analysis by combined thin layer and gas-liquid chromatographic systems. Chromatogr Rev 1966;8:172. [Google Scholar]
- 98. Grob K, Grob G. Practical capillary gas chromatography—a systematic approach. J High Res Chromat 1979;2(3):109–17. [Google Scholar]
- 99. Shah VP, Midha KK, Findlay JW, Hill HM, Hulse JD, McGilveray IJ, McKay G, Miller KJ, Patnaik RN, Powell ML et al.. Bioanalytical method validation—a revisit with a decade of progress. Pharm Res 2000;17(12):1551–7. [DOI] [PubMed] [Google Scholar]
- 100. Giddings JC. Maximum number of components resolvable by gel filtration and other elution chromatography methods. Anal Chem 1976;39(8):1027–8. [Google Scholar]
- 101. US Department of Health and Human Services Food and Drug Administration Center for Drug Evaluation and Research and Center for Veterinary Medicine Guidance for industry: bioanalytical method validation. In: Rockville (MD): FDA; 2001. [Google Scholar]
- 102. Langmuir I. Pathological science. Phys Today 1989;42(10):36–48. [Google Scholar]
- 103. Holman RT, Mohrhauer H. A hypothesis involving competitive inhibitions in the metabolism of polyunsaturated fatty acids. Acta Chem Scand 1963;17:S84–S90. [Google Scholar]
Associated Data
This section collects any data citations, data availability statements, or supplementary materials included in this article.