Abstract
To investigate the role of protein kinase C-α (PKC-α) in glomerulonephritis, the capacity of PKC-α inhibition to reverse the course of established nephrotoxic nephritis (NTN) was evaluated. Nephritis was induced by a single injection of nephrotoxic serum and after its onset, a PKC-α inhibitor was administered either systemically or by targeted glomerular delivery. By day seven, all mice with NTN had severe nephritis, whereas mice that received PKC-α inhibitors in either form had minimal evidence of disease. To further understand the underlying mechanism, label-free shotgun proteomic analysis of the kidney cortexes were performed, using quantitative mass spectrometry. Ingenuity pathway analysis revealed 157 differentially expressed proteins and mitochondrial dysfunction as the most modulated pathway. Functional protein groups most affected by NTN were mitochondrial proteins associated with respiratory processes. These proteins were down regulated in the mice with NTN, while their expression was restored with PKC-α inhibition. This suggests a role for proteins that regulate oxidative phosphorylation in recovery. In cultured glomerular endothelial cells, nephrotoxic serum caused a decrease in mitochondrial respiration and membrane potential, mitochondrial morphologic changes and an increase in glycolytic lactic acid production; all normalized by PKC-α inhibition. Thus, PKC-α has a critical role in NTN progression and the results implicate mitochondrial processes through restoring oxidative phosphorylation, as an essential mechanism underlying recovery. Importantly, our study provides additional support for targeted therapy to glomeruli to reverse the course of progressive disease.
Keywords: PKC-α inhibition, nephritis, targeted delivery, mitochondrial dysfunction, proteomics, glomerular endothelial cells
Introduction
Many maneuvers have been reported to prevent the development of glomerulonephritis, however few have reversed the course of disease. Although prevention strategies have merit, approaches that limit ongoing inflammation are needed. In this context PKC-α has been implicated as both a locally activated, inflammatory mediator and a perpetuating stimulant to fibrosis during glomerular disease 1–6. For example, activation of PKC-α in streptozotocin (STZ)-induced diabetes was observed to play a role in the development of albuminuria 3. In lupus nephritis, renal inflammation was induced by activating PKC signaling pathways, including PKC-α 7.
Nevertheless, given its pleotropic effects, systemic inhibition of PKC-α has the potential to interrupt normal physiology. In these studies, we investigated the role of inhibition of PKC-α during ongoing renal inflammation, nephrotoxic nephritis (NTN). PKC-α inhibition restored renal pathology, that was due to a direct effect within the kidney, as targeted glomerular delivery of inhibitor was therapeutically effective. Targeted inhibition was accomplished using inhibitors linked to the human monoclonal anti-α3(IV) antibody (F1.1), directed against the noncollagenous-1 domain (NC1) of α3(IV) collagen that localizes in glomeruli 8–11. The underlying mechanism for the benefit was further evaluated in a glomerular endothelial cell culture model of nephrotoxic injury, where, PKC-α inhibition reduced cytotoxicity and improved cellular recovery.
Results
Glomerular targeted Inhibition of PKC-α reverses the course of NTN
Following NTS administration, mice developed elevated BUN levels and nephritis that progressed over 7 days 12. By contrast, mice that received the PKC-α inhibitor, on day 2 after NTS, had normal BUN levels and normal histology on day 7 (Fig. 1, A, B).
Figure 1. Systemic and kidney-targeted administration of PKC-α inhibitor promotes recovery during NTN.
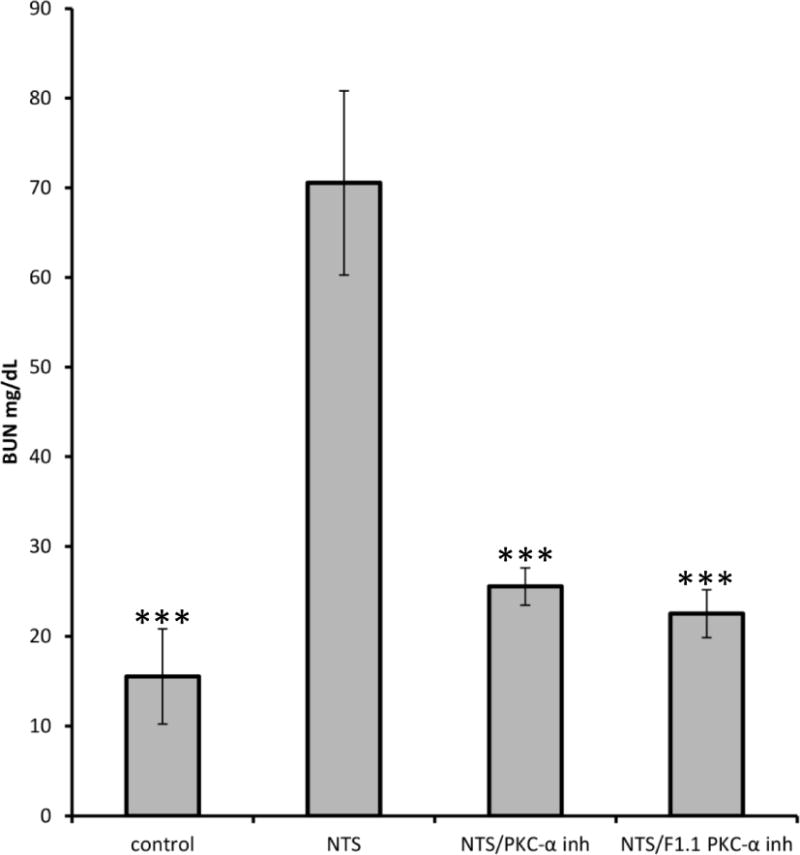

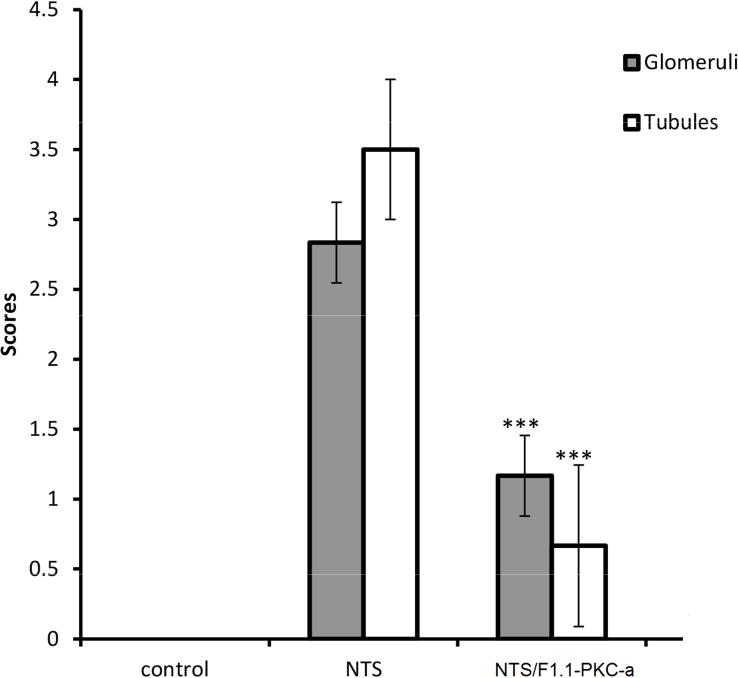
NTS 13.5 μl/g/bw was injected in C57BL/6 mice, followed by administration of PKC-α inhibitor (Ro-320432, 50ng/g/bw), the latter with or without conjugation to F1.1, on day 2, 4, 6 after NTS administration. A) BUN levels, day 7; *** indicates p<0.001 when samples compared to NTS treated ones; B) Light microscopy (H&E) were investigated on day 7 (scale bar: 80 μm). NTN mice displayed severe glomerular and tubulointerstitial injury. Limited signs of nephritis are evident in the treated mice groups. C) Quantification of H&E images by scoring of glomerular and tubular damage supported this conclusion. The clinical scores of glomerular injury were graded into five grades: 0 (normal), 1 (mild increase in cellularity), 2 (focal hypercellularity with increase of matrix), 3 (focal hypercellularity and proliferation in >50% of glomeruli), and 4 (diffuse proliferative change with crescents and sclerosis in >50% of glomeruli). Tubulointerstitial lesions were also graded from 0 to 4 according to the severity of inflammatory cell infiltration. (*** indicates p<0.001; **** p<0.0001 when compared to NTN).
To determine whether the effect of PKC-〈 inhibition was local, or systemic, a glomerular targeting strategy was utilized, with inhibitor linked to the human monoclonal anti-α3(IV) collagen antibody, F1.1. F1.1–inhibitor conjugates were administered during nephritis (day 2). After chemical crosslinking, the F1.1 containing conjugates localized within glomeruli 11. Mice injected with the F1.1-PKC-α inhibitor conjugates had significant reduction of BUN levels and limited histologic evidence of nephritis by day 7 (Fig. 1A,B,C). The effect was most likely due to an intracellular effect of the drug, since internalization of the conjugates in cultured cells was observed (Suppl. Fig. 1).
PKC-α inhibition improves endothelial cell survival
An established cell injury model was employed, whereby glomerular endothelial cells die after exposure to NTS 12. PKC activity, measured in endothelial cell lysates, was increased following NTS exposure (suppl Fig. 2). To investigate whether inhibition of PKC-α prevents NTS induced cell death, cell survival after NTS treatment w/wo PKC-α inhibitIion was evaluated. NTS enhanced LDH release, which was significantly reduced by PKC-α inhibition (Fig. 2). Addition of PKC-a inhibitor after NTS treatment resulted in similar benefits (Suppl. Fig. 3).
Figure 2. PKC-α significantly inhibits NTS mediated glomerular endothelial cell cytotoxicity.
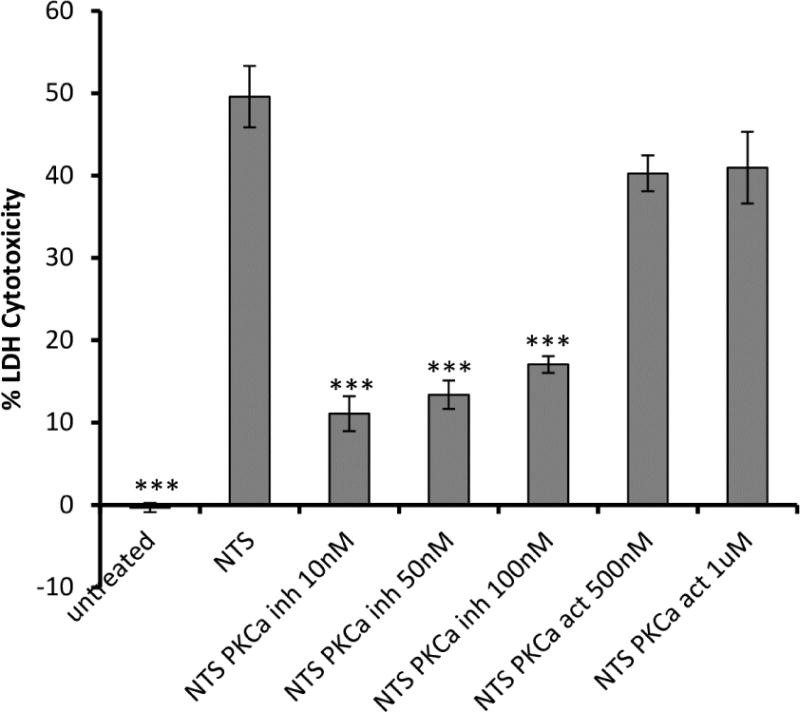
Endothelial cells were treated with PKC-α inhibitor (Ro-320432,10 nM, 50 nM, 100 nM) or PKC activator (PDBu, 500 nM, 1 μM) o/n, 5% NTS was added for 48 h and cell death was evaluated by LDH release and expressed as percent of maximum LDH activity. Treatment of endothelial cells with PDBu together with NTS abolished the beneficial effect of PKC-α inhibition. (*** indicates p<0.001 when LDH cytotoxicity values of samples compared to NTS treated ones).
Mitochondrial proteins participate in PKC-α inhibition benefit
To delineate the pathways involved in the benefit, label-free shortgun proteomic analysis from the kidney cortexes were performed, using quantitative mass spectrometry. The proteome from eight samples were analyzed, and the relative abundance of proteins was computed using their Peptide Spectral Match (PSM) values. The analysis identified 6692 proteins in the samples (Suppl. Fig. 4). Three comparisons were made: 1. NTS vs Control; 2. NTS/PKC-α inhibitor vs NTS; 3. and NTS/F1.1-PKC-α inhibitor vs NTS. The latter analyses were performed to compare treatment groups (NTS/PKC-α inhibitor and NTS/F1.1-PKC-α inhibitor) and the NTS group, to decipher if either of the treatment reversed the protein changes observed in the NTS group. A filter (> 1.5x change) resulted in 157 proteins (95 downregulated, 62 upregulated) significantly altered in the NTS group that were restored by at least one of the PKC-α inhibitor treatments. (Fig. 3A, Suppl. Fig. 5). Bioinformatics analyses, performed on these 157 proteins in an attempt to delineate their functional characteristics and to discover associations of proteins with biological processes, cellular compartments and canonical pathways, revealed that differentiated proteins were significantly associated with mitochondrial processes including oxidative phosphorylation (Table 1).
Figure 3. PKC-α inhibition normalizes NTN mediated decrease in abundance of proteins related to oxidative phosphorylation during the course of nephritis.
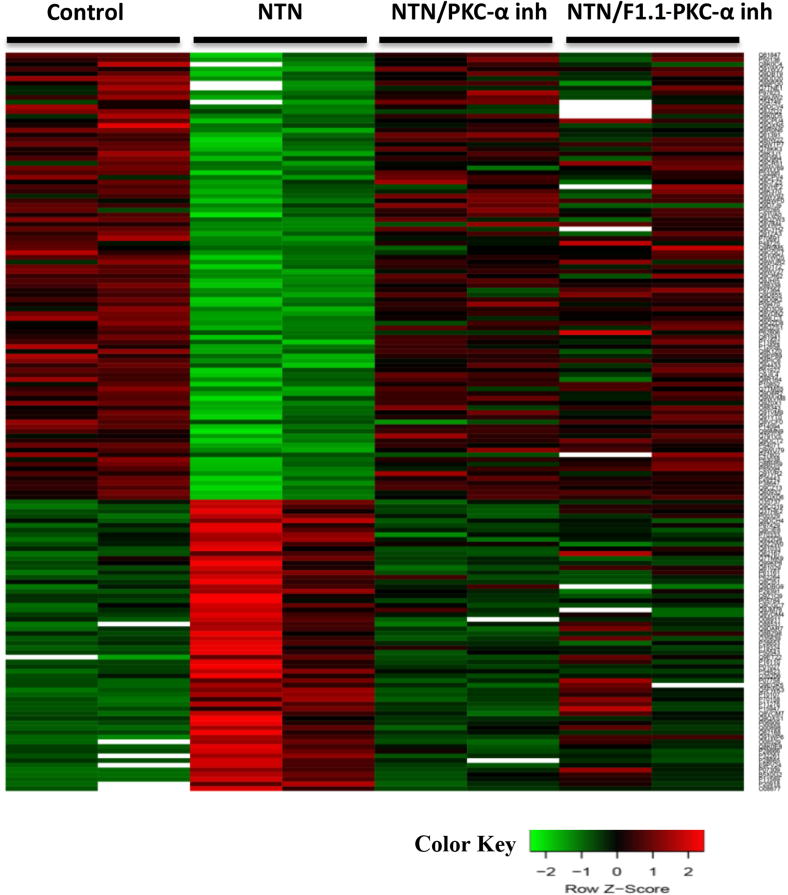
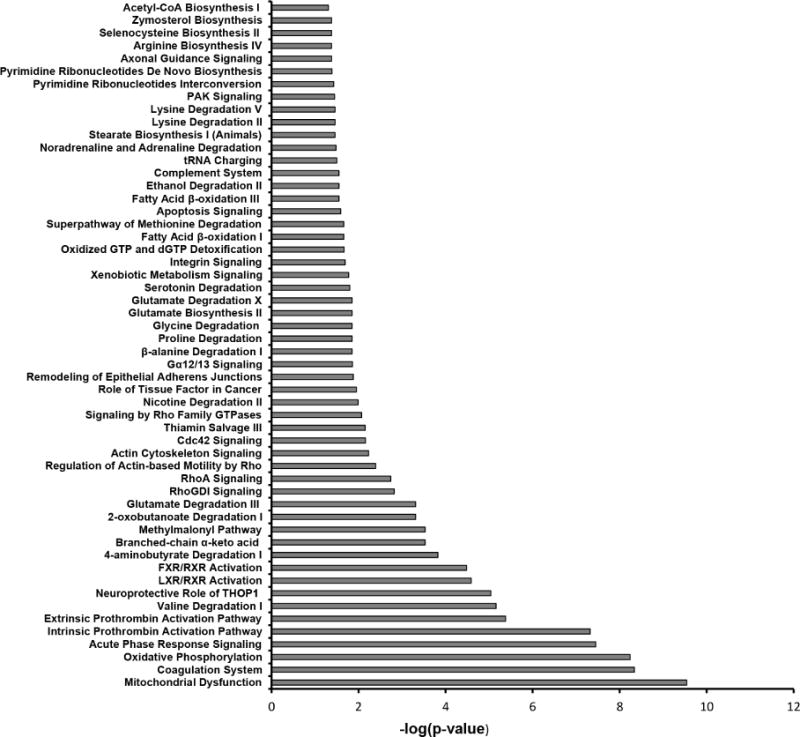
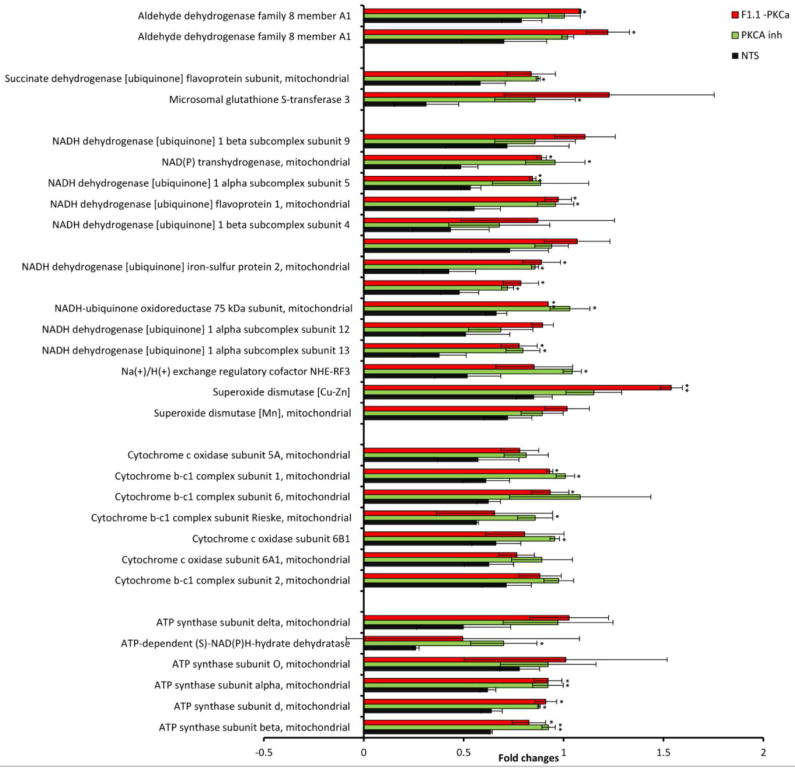
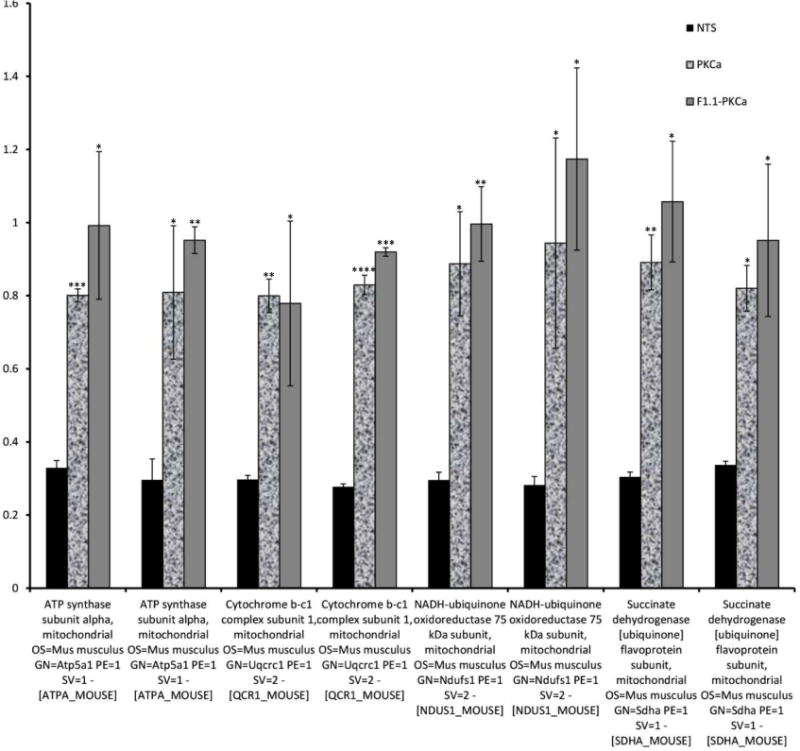
Mass-spectrometry profiling of mice kidney cortexes of mice reveals distinct protein profiles associated with NTN and PKC-α inhibition. A) Heatmap represents levels of 157 proteins in 8 samples. Each row represents a protein and each column represents a sample. Two distinct clusters represent 95 downregulated and 62 upregulated proteins in NTS as compared to controls. The magnitude of protein levels are represented by the color ranging from green (low levels) to red (high levels). B) Ingenuity pathway analysis of differentially expressed proteins identifies mitochondrial dysfunction as the most differentially modulated pathway. C) Functional protein groups most affected by NTN were mitochondrial proteins associated with respiratory processes. Proteins of all four complexes of respiratory chain were down regulated in NTN mice, whereas their expression was restored with PKC-α inhibition. Protein abundances (PSM) were quantified in 2 proteomes from each group of mice and fold changes in protein availability measured by dividing their PSMs by controls; * indicates p<0.05; ** p<0.01 when fold changes of each group of mice compared to NTN group. D) Parallel Reaction Monitoring (PRM) assay validates proteomic profiling results of 4 mitochondrial proteins. PRM experiments were performed on the same LC-MS platform using the same LC elution conditions. One signature fragment for each candidate peptide was selected to calculate the peak area on the extracted ion chromatograph for that peptide using Thermo Xcalibur software (ver. 3.0.63, Thermo Scientific). The peak area for each peptide was then normalized by beta-actin/GADPH across different samples to compensate for possible experimental variations. (* indicates p<0.05; ** p<0.01; *** p<0.001; **** p<0.0001 when fold changes of proteins from each group of mice compared to NTN group).
Table 1.
Biological processes, cellular compartments and top canonical pathways significantly associated with 157 proteins involved in PKC-α mediated reversal of Nephritis.
| Count | p-value | |
|---|---|---|
| Biological Processes | ||
| GO:0055114~oxidation-reduction process | 25 | 1.1 × 10⁻⁶ |
| GO:0030007~cellular potassium ion homeostasis | 5 | 8.6 × 10⁻⁴ |
| GO:0008152~metabolic process | 16 | 1.8 × 10⁻³ |
| GO:0007599~homeostasis | 6 | 7.6 × 10⁻³ |
| GO:0036376~sodium ion export from cell | 4 | 7.4 × 10⁻³ |
| Cellular compartments | ||
| GO:0005739~mitochondrion | 66 | 4.3 × 10⁻²⁷ |
| GO:0070062~extracellular exosome | 75 | 1.8 × 10⁻²³ |
| GO:0005743~ mitochondrial inner membrane | 25 | 2.3 × 10⁻¹³ |
| GO:0072562~blood microparticle | 12 | 3.8 × 10⁻⁷ |
| GO:0005759~ mitochondrial matrix | 12 | 1.1 × 10⁻⁵ |
| GO:0043209~myelin sheath | 12 | 1.1 × 10⁻⁵ |
| Top canonical pathways | ||
| Mitochondrial dysfunction | 13 | 2.87 × 10⁻¹⁰ |
| Coagulation system | 7 | 4.5 × 10⁻⁹ |
| Oxidative phosphorylation | 10 | 5.6 × 10⁻⁹ |
| Acute phase response signaling | 11 | 3.5 × 10⁻⁸ |
| Intrinsic prothrombin activation pathway | 6 | 4.8 × 10⁻⁸ |
Fold changes in relative abundances of proteins were also calculated by dividing PSM of treated samples by PSM values of controls. The relative abundance of proteins in control, compared to PKC-α inhibitor and F1.1-PKC-α treated mice displayed very close similarity (as determined by Pearson Correlation coefficient of 0.98 and 0.863, respectively) consistent with the observation that the treatments resulted in nearly complete restoration of disease. Comparative analysis of systemic and targeted PKC-α inhibition samples revealed similar protein expression patterns (with correlation coefficient 0.887 between their PSM values). Ingenuity pathway analysis of differentially expressed proteins revealed mitochondrial dysfunction as the most differentially modulated pathway (Fig. 3B). Among the functional proteins effected, mitochondrial proteins associated with respiratory processes were prominent (Fig. 3C).
Proteins of the respiratory chain complexes, such as Succinate dehydrogenase, Cytochrome b-c1 complex, Cytochrome c oxidase, ATP synthase, NADH dehydrogenase, were down regulated in NTN mice: averaged fold change (FC = PSM of sample divided by PSM of control) for mitochondrial proteins was: 0.588 ± 0.121, while their expression was restored with PKC-α inhibition: average FC values were 0.907 ± 0.118 and 0.927 ± 0.149 for the same proteins from PKC-α inhibitor and F1.1-PKC-α inhibitor treated mice, respectively, suggesting a role for proteins that regulate oxidative phosphorylation in restoration. For validation, four mitochondrial proteins: ATP synthase subunit alpha, Cytochrome b-c1 complex subunit 1, NADH-ubiquinone oxidoreductase 75kDa subunit, Succinate dehydrogenase (ubiquinone) flavoprotein subunit were further evaluated for their expression pattern using the Parallel Reaction Monitoring (PRM) assay, which offers several distinct advantages over conventional confirmation method, such as Western blotting, such as superior specificity, sensitivity, reproducibility and multiplexity 13.
The expression profile pattern mirrored their expression determined by proteomics: the average FC of PSM values of those proteins in kidney cortexes of NTS mice was 0.302 ± 0.020, while for the same proteins from PKC-α inhibitor and F1.1–PKC-α inhibitor treated mice average FC values were 0.847 ± 0.104 and 0.977 ± 0.149, respectively, indicating that expression of the analyzed proteins was effectively restored in both PKC-α inhibitor and F1.1–PKC-α inhibitor treated mice (Fig. 3D).
To more precisely define the localization of the changes in mitochondrial protein expression, relative expression ATP synthase and Cytochrome C levels were determined in kidney fractions: cortices and glomeruli (Suppl. Fig. 6). In cortices both mitochondrial proteins levels were diminished with NTS treatment, however they were normalized after PKC-α inhibitor treatment. In glomeruli, ATP synthase and cytochrome C levels were differentially expressed.
Mitochondrial function is altered in NTS treated glomerular endothelial cells and restored by PKC-α inhibition
To further evaluate the role of mitochondria in restoration of NTN with PKC-α inhibition, mitochondrial functional changes during cellular injury were evaluated. Specifically, we evaluated whether increased expression of mitochondrial proteins associated with oxidative phosphorylation correlated with increased mitochondrial respiration and ATP production. To this end, bioenergetic profiles of glomerular endothelial cells were studied under NTS treatment w/wo PKC-α inhibitor pretreatment. The mitochondrial respiration was assessed as Oxygen Consumption Rate (OCR), and glycolytic lactic acid production assessed as Extracellular Acid Release (ECAR)14. Mito stress studies using both oligomycin, FCCP and antimycin A and rotenone were employed to assess OCR, ECAR, and ATP generation 15. OCR:ECAR ratio at basal respiration for untreated cells was 5.3, while NTS reduced this ratio to 2.9, by reducing OCR from 225 pmol/min/5×103 cells to 185 pmol/min/5×103 cells and increasing ECAR from 42 to 62 mpH/min/5×103 cells (Suppl. Fig. 7 A,B) . After addition of oligomycin Coupling efficiency (ATP synthesis ratio to Basal respiration) comprised 82%. NTS reduced coupling efficiency to 57%. After addition of Antimycin A and rotenone Respiratory control (max. respiration ratio to proton leak) was 6.83. The antimycin A/rotenone-resistant rate reflects the non-mitochondrial respiration rate, which includes substrate oxidation and cell surface oxygen consumption. PKC-α inhibition (50 nM) normalized NTS-mediated dysfunction in mitochondrial respiration, in particular, increased basal and maximal respiration, proton leak and ATP production (Fig. 4A, B).
Figure 4. PKC-α inhibition modulates mitochondrial respiration in endothelial cells.
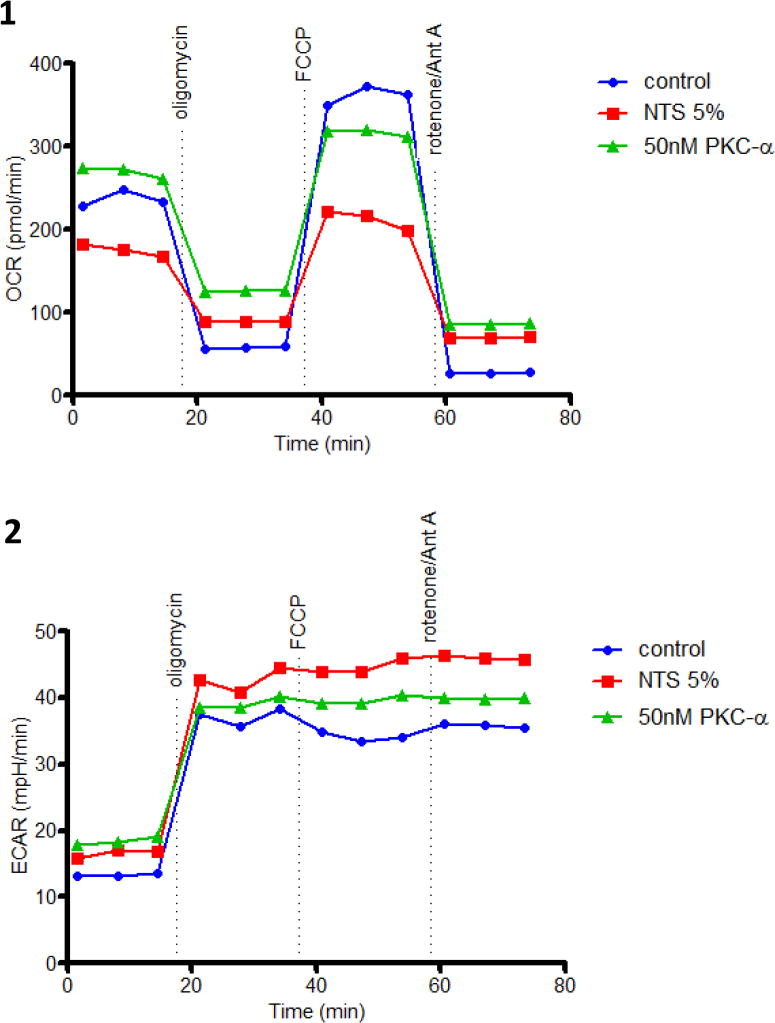
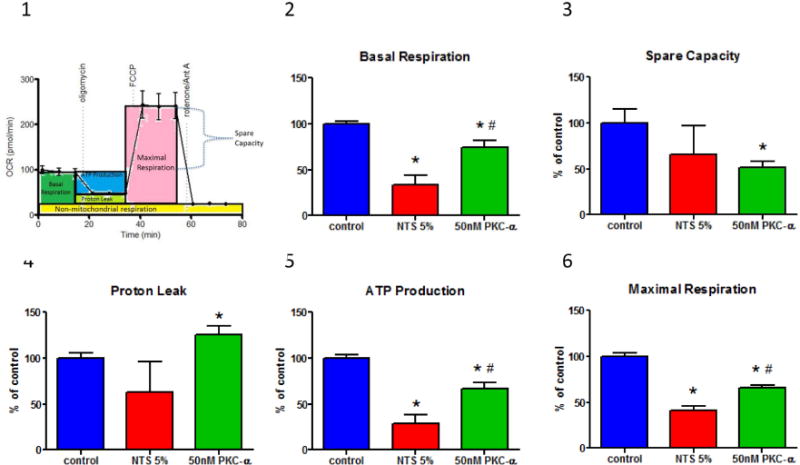
(A) Endothelial cells demonstrate decreased oxygen consumption (OCR) (A:1) and increased glycolytic lactic acid production (ECAR) (A:2) in the presence of NTS 5%, while oxygen consumption is improved when pretreated with 50 nM PKC-α. Mitochondrial stress test was performed by sequential addition of oligomycin (complex V inhibitor), FCCP (mitochondrial membrane depolarization), rotenone (complex I inhibitor) and antimycin (Ant A- complex III inhibitor). Graphs show one representative experiment run in duplicate. (B:1) A diagrammatic representation of mitochondrial stress test and functional significance of area under the curve (B:2-6) Basal respiration, spare capacity, proton leak, ATP production and maximal respiration were calculated from two experiments run in duplicate by the method shown in panel B:1 and normalized to the control values. Statistical analysis was performed using Mann-Whitney nonparametric test; (* indicates p<0.05 compared to control, # indicates p<0.05 compared to NTS 5% (n=4)).
PKC-α inhibition restores mitochondrial membrane potential in NTS injured glomerular endothelial cells
Mitochondrial function was also measured by evaluating changes in mitochondrial membrane potential (Δψm, a charge or electrical gradient, a key indicator of the cells’ capacity to synthesize ATP and reflects cell health 16). Mito-ID MP, cationic carbocyanine dye was used, which changes fluorescence spectrum depending on mitochondrial potential status: in healthy cells the dye mainly accumulates in mitochondria as orange fluorescent aggregates, however during depolarization of mitochondria the dye moves to cytosol and emits green fluorescence. NTS treatment of endothelial cells resulted in reduction of Δψm and an increase of cells with depolarized mitochondria by 23% (from 32.2% in untreated cells to 55.8% in NTS treated ones), while PKC-α inhibition of NTS-treated cells, reduced the number of cells with depolarized mitochondria by 9% (from 55.8% of NTS treated cells to 47.2% of PKC-α inhibitor treated ones) (Fig.5A). Furthermore, NTS reduced the fraction of cells with healthy mitochondria by 22.3%, (from 66.26%-untreated cells, to 43.98%-NTS treated ones), but in the presence of PKC-α inhibition 52.5% of cells displayed healthy mitochondria (Fig. 5A, Suppl. Fig. 8).
Figure 5. PKC-α inhibition prevents NTS-induced mitochondrial membrane potential loss: mitochondrial depolarization and morphology changes.
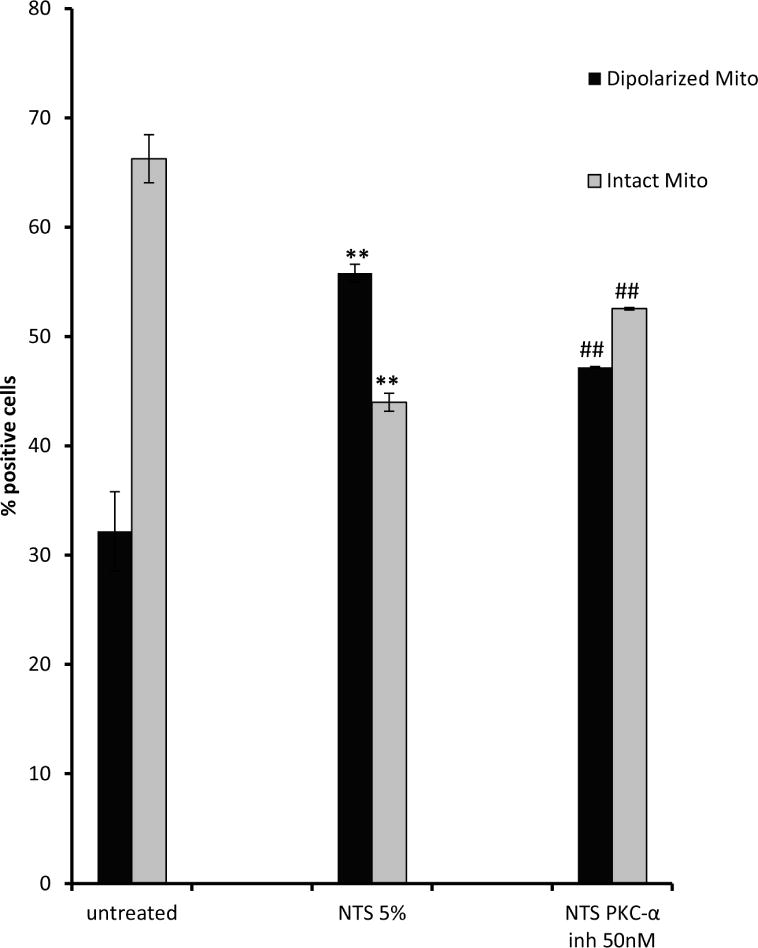
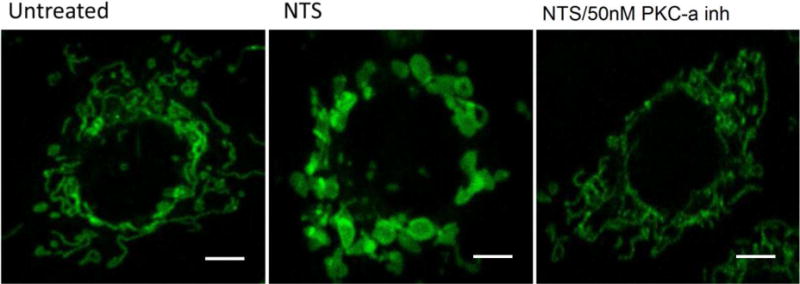
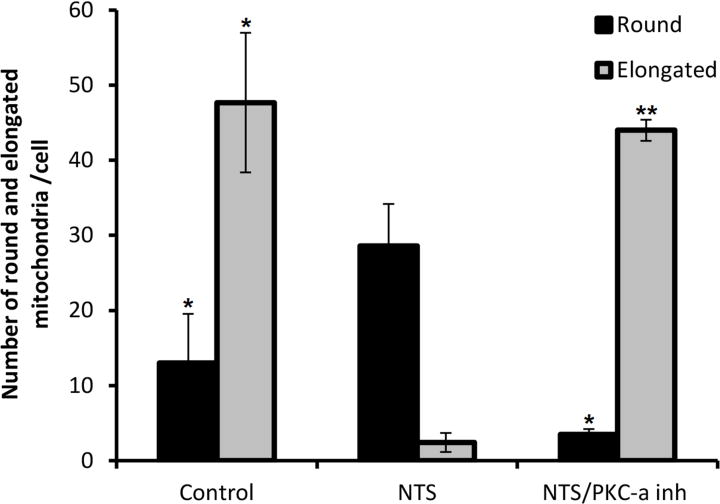
A) NTS treatment of endothelial cells resulted in increase of green fluorescence, (depolarized mitochondria), while PKC-α inhibition produced more orange fluorescence positive cells (healthy mitochondria). (** indicates p<0.01 compared to control, ## indicates p<0.01 compared to NTS). B) NTS treatment caused appearance of large and round shaped mitochondria, while in PKC-α inhibitor treated cells the majority of mitochondria resumed their normal rod-type shape appearance Mitochondrial distribution and their morphology in endothelial cells was evaluated using mitotracker– mitochondrion selective probes: MitoTracker Green FM (scale bar: 5 μm). C) Round and elongated mitochondria were quantified in a blinded manner in ×100 field. (3 fields per condition, * indicates p<0.0, ** indicates p<0.01).
Since mitochondria change shape according to metabolic conditions 17, mitochondrial morphology and distribution were examined under the experimental conditions described above, using Mitotracker–mitochondrion selective probes in endothelial cells. The probes have high affinity to mitochondrial-specific components (e.g. free thiol groups of cystein residues belonging to mitochondrial proteins 18), and they stain mitochondria regardless of their polarization status 19. Severe mitochondrial swelling, documented by the appearance or large and round shaped mitochondria, was observed in endothelial cells after NTS treatment, which coincided with a loss of Δψm and a reduction of OCR (Fig. 5B,C). This was reversed upon PKC-α inhibitor treatment of endothelial cells, with the majority of mitochondria resuming their normal rod-type shape appearance. These morphological fluctuations of mitochondria correlated with their respiratory capacity and the membrane potential changes described above.
A potential explanation for this observation is that PKC-α effects mitochondrial function and membrane potential through disruption of ion homeostasis, which leads to alterations in mitochondrial membrane potential. To provide further evidence we measured Na+ concentration in endothelial cells in response of NTS and PKC-α inhibitor treatment. Increased sodium ions were detected in cells following incubation with NTS, while addition of PKC-α inhibitor restored homeostasis of Na+ ions (Suppl. Fig. 9). Alterations in cytoplasmic Na+ concentrations could, therefore, drive changes in Na+ gradient across mitochondria which in turn results in perturbations in mitochondrial matrix Ca2+ concentrations, known to control mitochondrial energetics 20.
Discussion
Our results indicate that PKC-α plays a crucial role during the pathogenesis of nephritis. Although previous studies have demonstrated beneficial effect of PKC-α inhibition in preventing non-inflammatory kidney diseases (e.g diabetic nephropathy) 4,21, the role of PKC-α involvement in acute kidney inflammation was unknown. Furthermore, its potential role in reversing established inflammatory disease, in general, had not been investigated. Therefore, experiments were performed to evaluate these possibilities. Once it was determined that the approach could reverse the course of nephritis, underlying mechanism was pursued. NTS treatment resulted in mitochondrial dysfunction in kidneys and cultured endothelial cells, and PKC-α inhibition blunted the injury. Particularly noteworthy the results define a novel mechanism of action for PKC-α via mitochondria, which, in turn, influences fundamental cellular processes, including cell survival. Indeed, PKC-α inhibition significantly improved endothelial cell viability after NTS exposure.
Mitochondrial proteins critical in oxidative phosphorylation, such as ATP synthase, cytochrome C-b complex, and NADH dehydrogenase, were particularly affected. This was revealed by proteomic analysis and further validated by Parallel Reaction Monitoring assays. Western blotting analysis of Cytochrome C levels in cortexes versus glomeruli confirmed that the levels were altered in glomeruli as well, while ATP synthase showed diffential expression in cortex compared to glomeruli, implying that the effect of PKC-α inhibitor might extend beyond glomerular cells. Although we have focused on glomerular endothelial cells, we cannot exclude effects of PKC-α inhibition on other glomerular/kidney cells. Nevertheless, the net effect of PKC-α inhibition is beneficial, and this appears to be, at least in part, mediated through the glomerular endothelium. In PKC-α inhibitor treated mice, the expression of mitochondrial proteins approached the levels of untreated animals, implying to nearly complete restoration of mitochondrial function. Similar findings were observed in NTS-treated endothelial cells, where mitochondrial function, including the capacity of oxidative phosphorylation, was assessed by examining ATP production rate, OCR and ECAR. PKC-α inhibition increased ATP production and OCR rates. The increased ATP production found in PKC-α treated cells may account for their improved survival under NTS treatment. Indeed, increased cell viability was observed. Modulation in oxidative phosphorylation as evidenced by the mitochondrial respiration studies also correlated with mitochondrial potential and morphologic changes in endothelial cells. The findings support a crucial role of mitochondrial proteins during NTN, and they provide targets for therapy to enhance resolution.
Taken together, the results implicate mitochondria as critical to the pathogenesis of nephrotoxic nephritis. This injury is mediated, at least in part, through activation of PKC-α in glomerular cells. PKC-α may effect mitochondrial function and membrane potential through disruption of ion homeostasis, which leads to alterations in mitochondrial membrane potential. In this regard, previous studies have shown, that PKC-〈 can mediate capillary barrier dysfunction induced by bacterial toxins22 and that activated PKC-α impairs the activity of both Na+/K+ ATPase and of the epithelial sodium channel (ENaC)23,24,6,24. Alterations in cytoplasmic Na+ concentrations could, therefore, drive changes in Na+ gradient across mitochondria which in turn results in perturbations in mitochondrial matrix Ca2+ concentrations, known to control mitochondrial energetics 20 through activation of mitochondrial dehydrogenases and NADH synthesis 25,26. Mitochondrial Ca2+ and Na+ also regulate/control additional proteins and processes such as mitochondrial volume and fission and fusion. Increase in Ca2+ could lead to activation of mitochondrial transition pore 27 a large conductance channel, which leads to cell death and apoptosis. In support of this hypothesis ENaC expression was detected in glomerular endothelial cells, (Madaio MP, et al, unpublished data). Our results confirmed changes in sodium concentration in response to NTS and PKC-α inhibitor treatment. Modulation of mitochondrial energetics, membrane potential changes and morphology all has been detected as a result of PKC-α inhibition, which provides basis for linking its effect on mitochondria through regulation of ion gradients.
In conclusion, our results demonstrate that PKC-α is involved in mitochondrial dysfunction and cell death in GEC during antibody mediated glomerulonephritis, and inhibition of PKC-α significantly improves kidney function by improving mitochondrial respiration. Our results further confirm that novel approaches for glomerular drug delivery have the capacity to improve the course of nephritis.
Methods
Animals, cells, reagents
Female C57BL/6 mice were purchased from The Taconic Laboratory. All experiments were performed in compliance with federal laws and institutional guidelines. The animal protocol was approved by the Augusta University Institutional Animal Care and Use Committee (no. A3307-01). 12-week-old mice (18–20 g) were used for all experiments. Established cloned glomerular endothelial cell clones were employed as described previously 28. Urea nitrogen direct kit (Stanbio Laboratory, Boerne, TX), PKC-α inhibitor Ro-320432, (which displays 10-fold greator selectivity for PKC-α, 4-fold greater selectivity for PKC-β over other isoforms; EMD Millipore, Billerica, MA), PKC activator, Phorbol 12,13-dibutyrate (PDBu) (Sigma-Aldrich); EDC (Thermo Scientific, Rockford, IL), Mito-ID Membrane Potential Detection Kit (Enzo Life Sciences, Farmingdale NY), Pierce LDH Cytotoxicity Kit (Thermo Scientific), Nephrotoxicity PCR array (Qiagen, Maryland), MitoTracker Green FM (Thermo Scientific, Rockford, IL) wereused.
Production of conjugates of F1.1 with PKC-α inhibitor
The human hybridoma producing F1.1, having specificity for α3(IV) collagen, was employed, and purified human IgG was eluted from the supernatant as described 8. Antibody was chemically linked to PKC-α inhibitor according to previously used protocol 11. Neither the antibody alone (F1.1) nor isotype matched control antibody had an effect on the course of disease 11.
Nephrotoxic Nephritis
Sheep nephrotoxic serum was prepared and administered as described previously 29. For disease induction, NTS was administered as a single dose intraperitoneally (13.5 μl of serum per g mouse weight). Five mice per group were used for each experiment. Mice were then followed with measurement of serum urea nitrogen levels using the urea nitrogen direct kit. At time of sacrifice, kidneys were removed and either fixed in 4% buffered formalin or frozen in OCT (Fisher, Houston, TX) medium. Pathological evaluation by light microscopy was done in a blinded manner by M. P. Madaio. The clinical scores of glomerular injury were graded into five grades as described 29.
Mice were divided into four groups: 1) controls, 2) NTS treated, and 3) NTS plus PKC-α inhibitor (Ro-32-0432) given i.p. after induction of nephritis on day 2, 4 and 6, and 4) NTS plus PKC- α inhibitor conjugated to the human mAb, F1.1, given i.p. after induction of nephritis 10 μg/g bw on day 2, 4 and 6.
Cell viability assessment
Glomerular endothelial cell viability was measured using LDH cytotoxicity kit according to manufacturer’s instructions. Before treatment endothelial cells were cultured in low 0.07% FBS media for 5h in 6 well plates; afterwards PKC-α inhibitor (Ro-320432, 10nM, 50 nM, 100 nM) was added to cultured cells. The next day 5% NTS was added for 48 hrs; LDH release was measured.
PKC activity measurement in endothelial cells
PKC activity in endothelial cells was assessed with PKC Kinase activity kit according to manufacturer’s instructions (Enzo Life Sciences, Farmigdale, NY)
Sample preparation for LC-MS/MS analysis
Kidney tissues were homogenized in 1 ml lysis buffer (8M urea in 50mM Tris-HCl (pH 8) with 1/100 protease inhibitor cocktail (Thermo Scientific, Rockford, IL) and 2 g of mixed stainless steel beads at speed 10 for 2 min using a bullet blender (Next Advance, Inc.).
100 g of extracted protein was reduced with dithiothreitol, alkylated using iodoacetamide and digested overnight using trypsin (Thermo Scientific, Rockford, IL). Peptides were cleaned using C18 spin column (Harvard Apparatus #744101) and lyophilized.
LC-MS/MS analysis
Peptide digests were analyzed on an Orbitrap Fusion tribrid mass spectrometer (Thermo Scientific) coupled with an Ultimate 3000 nano-UPLC system (Thermo Scientific, Rockford, IL).
Samples were analyzed by data-dependent acquisition in positive mode using Orbitrap MS analyzer for precursor scan at 120,000 FWHM from 300 to 1500 m/z and ion-trap MS analyzer for MS/MS scans at top speed mode (3-second cycle time). Collision-induced dissociation (CID) was used as fragmentation method. Raw data were processed using Proteome Discoverer (v1.4, Thermo Scientific, Rockford, IL) and submitted for SequestHT search against the Uniprot human database. PSM validator algorithm was used for peptide spectrum matching validation.
The peptide spectral match (PSM) values obtained from LC-MS/MS analysis were log2 transformed prior to all statistical analyses to achieve normal distribution. Heatmap was generated using gplots package in R (version 3.2.5), to visualize the patterns of 157 altered proteins.
Gene ontology enrichment analysis was performed on altered proteins using DAVID Bioinformatics Resources 6.8 to provide an overview of the biological processes involved in the pathogenies of Nephritis. Ingenuity pathway analysis (IPA) was used to identify canonical pathways significantly enriched by this protein set. Network analysis using IPA was performed to search for interactions between these 157 proteins.
Parallel Reaction Monitoring (PRM) assay and data analysis
Identified peptides from previous LC-MS/MS experiments for candidate proteins were extracted to build a parallel reaction monitoring MS method together with identified peptides from house keeping proteins, including beta-actin and GADPH. PRM experiments were performed on the same LC-MS platform using the same LC elution conditions. One signature fragment (generally the most intense fragment) for each candidate peptide was selected to calculate the peak area on the extracted ion chromatograph for that peptide using Thermo Xcalibur software (ver. 3.0.63, Thermo Scientific, Rockford, IL). The peak area for each peptide was then normalized by beta-actin/GADPH across different samples to compensate for experimental variations.
Isolation of glomeruli
Glomeruli were isolated using differential sieving as described previously 30,31.
Western Blotting
To extract protein, kidney samples were Samples resolved on SDS-PAGE and subjected to immunoblot assay by using primary abs (1:750) ATP synthase (Thermo Scientific) and Cytochrome C (Cell Signaling, Dnavers, MA) followed by secondary anti-rabbit HRP (1:3000; Cell Signaling, Danvers, MA). Blots were developed with chemiluminescence reagent (Bio-Rad, Hercules, CA). Images of blots were quantifed using NIH Image J software.
Bioenergetic analysis of kidney endothelial cells
The Seahorse XFp Analyzer (Seahorse Biosciences, North Billerica, MA) was used according to the manufacturer’s protocol to measure oxygen consumption rate (OCR) of the cells. Cells were seeded into Seahorse Flux Analyzer mini plates (5,000 cells/well) and incubated overnight at 37 °C. Cells were treated with vehicle (DMEM) or 50nM PKC-α and incubated for 1 h. A subset of cells was then treated with 5% NTS, and all cells were incubated overnight. Thereafter, the culture medium was changed to XFp base medium minimal DMEM (Seahorse Biosciences, North Billerica, MA) pH 7.4 supplemented with 1 mM pyruvate, 2mM glutamine, 10mM glucose (Sigma-Aldrich) and placed in a dry incubator (non-CO2) for 1h at 37°C. Mitochondrial function was assessed using the Seahorse XFp Analyzer by monitoring changes in OCR as previously described 32. Briefly, three baseline OCR measurements were taken for each well in the first 35 min, and then the following mitochondrial inhibitors were sequentially injected: oligomycin (1 M), a ccomplex V inhibitor,; carbonycyanide p-(trifluoromethoxy) phenylhydrazone (FCCP) (2 M), a proton uncoupler;; antimycin A and rotenone (0.5 M) complex III inhibitors. Three OCR values were automatically calculated after each injection by the Seahorse XFp software.
Mitochondrial Membrane Potential Determination
Endothelial cells were starved for 5h in 0.07% FBS media. Thereafter, 50nM PKC-α inhibitor was added for o/n, cells were incubated with/without 5% NTS for 5 h and mitochondrial membrane potential changes evaluated with Flow Cytometer using Mito-ID membrane Potential Detection Kit (Enzo, Life Sciences, Farmingdale, NY) according to manufacturer’s instructions. The dye was added for 15 min and cells were analyzed with the FL1 channel for the green fluorescent signal and the FL2 channel for the orange signal.
Assessment of Mitochondrial Morphology
Endothelial cells were grown in chamber slides, starved with 0.07% media for 5 hrs, 50 nM PKC-α inhibitor added for o/n, afterwards cells were incubated with/without 5% NTS for 5 hrs and imaged using Zeiss 780 Inverted Confocal microscope. Mitochondrial morphology of live cells was visualized with Green MitoTracker FM Mitochondrion-Selective Probes (Life technologies, Eugene, OR) according to manufacturer’s instructions.
Measurement of intracellular sodium concentration
Intracellular sodium concentration was measured using the sodium sensitive dye SBFI (Invitrogen) according to manufacturer’s instructions. In brief, 10nM stock solution of the dye in DMSO was further diluted in PBS (10ml) before loading onto the cells for 45 min. The signal was detected using a high-resolution digital camera (Photometrics Evolve, Roper Scientific). Excitation was provided by a Sutter DG-4 175W xenon arc lamp (Sutter Instruments). Regions of interest containing cells were selected using Metafluor imaging software (Universal Imaging). A FURA2 fluorescence lens kit was utilized to collect the fluorescent signal (Chroma Technology Corp, Bellows falls, VT). The ratio of fluorescent intensities at excitation 340nM/380nM/emission 510nM were recorded and the ratio calculated.
Supplementary Material
Cultured podocytes were incubated with F1.1-PGE2 conjugates (50μg/ml) for either 5 or 20 min at 37°C. Cells were stained using anti-human dylight 488 and anti-PGE2 antibodies, followed by anti-Rabbit TR (scale bar: 8 μm).
Endothelial cells were treated with 5% NTS for 48h . Cells were lysed, and PKC activity was assessed with PKC Kinase activity kit.
Endothelial cells were treated with 5% NTS, for 1 hour. Thereafter the PKC-α inhibitor (Ro-320432,10 nM, 50 nM, 100 nM) was added and the cells were incubated for 48 h. Cell death was evaluated by LDH release and expressed as percent of maximum LDH activity. (* p<0.05, ** p<0.01, *** indicates p<0.001, where LDH cytotoxicity values of samples compared to NTS treatement alone).
Control (2 mice), NTN (2 mice), NTN treated with PKC-α inhibitor (2 mice) and NTN treated with F1.1-PKC-α inhibitor (2 mice).
Supplementary Figure 5. Excel file of proteins included in Heatmap with accession numbers and corresponding names from kidney cortexes of mice from Supplementary Figure 4.
Quantification with Image J software is shown. Equal amount of protein (40 g) from each sample was resolved on SDS-PAGE, trans-blotted onto a PVDF membrane and subjected to immunoblot assay by using primary abs (1:750) ATP synthase and Cytochrome C followed by secondary anti-rabbit HRP (1:3000).
Supplementary Figure 7. Endothelial cells demonstrate decreased oxygen consumption (A), and increased extracellular acid release (B) in the presence of NTS.
NTS increased cells with depolarized mitochondria, (green fluorescence) in contrast to PKC-α inhibition, which increased orange fluorescence positive cells with healthy mitochondria. Representative flow charts are included.
Intracellular sodium concentrations were measured using the sodium sensitive dye SBFI. In brief, 10nM stock solution of the dye in DMSO was made and further diluted in PBS before loading onto the cells for 45 min. The ratio of fluorescent intensities at excitation 340nM/380nM/emission 510nM were recorded and the ratio calculated.
Acknowledgments
We thank Drs. D. Eaton and E. Inscho for helpful discussions. The work was supported by grants from R01 DK100564 (RL, MPM,) and NIH R01 GM 101927 (RR).
Footnotes
Publisher's Disclaimer: This is a PDF file of an unedited manuscript that has been accepted for publication. As a service to our customers we are providing this early version of the manuscript. The manuscript will undergo copyediting, typesetting, and review of the resulting proof before it is published in its final citable form. Please note that during the production process errors may be discovered which could affect the content, and all legal disclaimers that apply to the journal pertain.
Disclosures: None
Contributor Information
Nino Kvirkvelia, Department of Medicine, Augusta University, Augusta, GA.
Malgorzata McMenamin, Department of Medicine, Augusta University, Augusta, GA.
Marie Warren, Biomedical and Radiological Technology (Pharmacology and Toxicology), Augusta University, Augusta, GA.
Ravirajsinh Jadeja, Department of Biochemistry and Molecular Biology, Augusta University, Augusta, GA.
Sai Karthik Kodeboyina, Center for Biotechnology and Genomic Medicine, Augusta University, Augusta, GA.
Ashok Sharma, Center for Biotechnology and Genomic Medicine, Augusta University, Augusta, GA.
Wenbo Zhi, Center for Biotechnology and Genomic Medicine, Augusta University, Augusta, GA.
Paul M. O’Conor, Department of Pgisiology and Endocrinology, Augusta University, Augusta, GA
Raghavan Raju, Biomedical and Radiological Technology (Pharmacology and Toxicology), Augusta University, Augusta, GA.
Rudolf Lucas, Vascular Biology Center, Department of Pharmacology and Toxicology, Augusta University, Augusta, GA.
Michael P. Madaio, Department of Medicine, Augusta University, Augusta, GA
References
- 1.Yung S, Zhang Q, Zhang CZ, Chan KW, Lui SL, Chan TM. Anti-DNA antibody induction of protein kinase C phosphorylation and fibronectin synthesis in human and murine lupus and the effect of mycophenolic acid. Arthritis and rheumatism. 2009;60(7):2071–2082. doi: 10.1002/art.24573. [DOI] [PubMed] [Google Scholar]
- 2.Yung S, Zhang Q, Chau MK, Chan TM. Distinct effects of mycophenolate mofetil and cyclophosphamide on renal fibrosis in NZBWF1/J mice. Autoimmunity. 2015;48(7):471–487. doi: 10.3109/08916934.2015.1054027. [DOI] [PubMed] [Google Scholar]
- 3.Kang N, Alexander G, Park JK, et al. Differential expression of protein kinase C isoforms in streptozotocin-induced diabetic rats. Kidney international. 1999;56(5):1737–1750. doi: 10.1046/j.1523-1755.1999.00725.x. [DOI] [PubMed] [Google Scholar]
- 4.Koya D. Dual protein kinase C alpha and beta inhibitors and diabetic kidney disease: a revisited therapeutic target for future clinical trials. Journal of diabetes investigation. 2014;5(2):147–148. doi: 10.1111/jdi.12154. [DOI] [PMC free article] [PubMed] [Google Scholar]
- 5.Tossidou I, Teng B, Menne J, et al. Podocytic PKC-alpha is regulated in murine and human diabetes and mediates nephrin endocytosis. PloS one. 2010;5(4):e10185. doi: 10.1371/journal.pone.0010185. [DOI] [PMC free article] [PubMed] [Google Scholar]
- 6.Nowak G. Protein kinase C-alpha and ERK1/2 mediate mitochondrial dysfunction, decreases in active Na+ transport, and cisplatin-induced apoptosis in renal cells. The Journal of biological chemistry. 2002;277(45):43377–43388. doi: 10.1074/jbc.M206373200. [DOI] [PMC free article] [PubMed] [Google Scholar]
- 7.Yung S, Chan TM. Mechanisms of Kidney Injury in Lupus Nephritis - the Role of Anti-dsDNA Antibodies. Frontiers in immunology. 2015;6:475. doi: 10.3389/fimmu.2015.00475. [DOI] [PMC free article] [PubMed] [Google Scholar]
- 8.Meyers KE, Christensen M, Madaio MP. Modeling of human anti-GBM antibody-alpha3(IV)NC1 interactions predicts antigenic cross-linking through contact of both heavy chains with repeating epitopes on alpha3(IV)NC1. American journal of nephrology. 2009;30(5):474–480. doi: 10.1159/000242476. [DOI] [PMC free article] [PubMed] [Google Scholar]
- 9.Chaudhary K, Kleven DT, McGaha TL, Madaio MP. A human monoclonal antibody against the collagen type IV alpha3NC1 domain is a non-invasive optical biomarker for glomerular diseases. Kidney Int. 2013;84(2):403–408. doi: 10.1038/ki.2013.99. [DOI] [PubMed] [Google Scholar]
- 10.Meyers KE, Allen J, Gehret J, et al. Human antiglomerular basement membrane autoantibody disease in XenoMouse II. Kidney international. 2002;61(5):1666–1673. doi: 10.1046/j.1523-1755.2002.00312.x. [DOI] [PubMed] [Google Scholar]
- 11.Kvirkvelia N, McMenamin M, Gutierrez VI, Lasareishvili B, Madaio MP. Human anti-alpha3(IV)NC1 antibody drug conjugates target glomeruli to resolve nephritis. American journal of physiology Renal physiology. 2015;309(8):F680–684. doi: 10.1152/ajprenal.00289.2015. [DOI] [PMC free article] [PubMed] [Google Scholar]
- 12.Kvirkvelia N, McMenamin M, Chaudhary K, Bartoli M, Madaio MP. Prostaglandin E2 promotes cellular recovery from established nephrotoxic serum nephritis in mice, prosurvival, and regenerative effects on glomerular cells. American journal of physiology Renal physiology. 2013;304(5):F463–470. doi: 10.1152/ajprenal.00575.2012. [DOI] [PMC free article] [PubMed] [Google Scholar]
- 13.Aebersold R, Burlingame AL, Bradshaw RA. Western blots versus selected reaction monitoring assays: time to turn the tables? Molecular & cellular proteomics : MCP. 2013;12(9):2381–2382. doi: 10.1074/mcp.E113.031658. [DOI] [PMC free article] [PubMed] [Google Scholar]
- 14.Warren M, Subramani K, Schwartz R, Raju R. Mitochondrial dysfunction in rat splenocytes following hemorrhagic shock. Biochimica et biophysica acta. 2017 doi: 10.1016/j.bbadis.2017.08.024. [DOI] [PMC free article] [PubMed] [Google Scholar]
- 15.Abe Y, Sakairi T, Kajiyama H, Shrivastav S, Beeson C, Kopp JB. Bioenergetic characterization of mouse podocytes. American journal of physiology Cell physiology. 2010;299(2):C464–476. doi: 10.1152/ajpcell.00563.2009. [DOI] [PMC free article] [PubMed] [Google Scholar]
- 16.Perry SW, Norman JP, Barbieri J, Brown EB, Gelbard HA. Mitochondrial membrane potential probes and the proton gradient: a practical usage guide. BioTechniques. 2011;50(2):98–115. doi: 10.2144/000113610. [DOI] [PMC free article] [PubMed] [Google Scholar]
- 17.van der Bliek AM, Shen Q, Kawajiri S. Mechanisms of mitochondrial fission and fusion. Cold Spring Harbor perspectives in biology. 2013;5(6) doi: 10.1101/cshperspect.a011072. [DOI] [PMC free article] [PubMed] [Google Scholar]
- 18.Presley AD, Fuller KM, Arriaga EA. MitoTracker Green labeling of mitochondrial proteins and their subsequent analysis by capillary electrophoresis with laser-induced fluorescence detection. Journal of chromatography B, Analytical technologies in the biomedical and life sciences. 2003;793(1):141–150. doi: 10.1016/s1570-0232(03)00371-4. [DOI] [PubMed] [Google Scholar]
- 19.Cottet-Rousselle C, Ronot X, Leverve X, Mayol JF. Cytometric assessment of mitochondria using fluorescent probes. Cytometry Part A : the journal of the International Society for Analytical Cytology. 2011;79(6):405–425. doi: 10.1002/cyto.a.21061. [DOI] [PubMed] [Google Scholar]
- 20.Cortassa S, Aon MA, Marban E, Winslow RL, O’Rourke B. An integrated model of cardiac mitochondrial energy metabolism and calcium dynamics. Biophysical journal. 2003;84(4):2734–2755. doi: 10.1016/S0006-3495(03)75079-6. [DOI] [PMC free article] [PubMed] [Google Scholar]
- 21.Li J, Gobe G. Protein kinase C activation and its role in kidney disease. Nephrology. 2006;11(5):428–434. doi: 10.1111/j.1440-1797.2006.00673.x. [DOI] [PubMed] [Google Scholar]
- 22.Lucas R, Yang G, Gorshkov BA, et al. Protein kinase C-alpha and arginase I mediate pneumolysin-induced pulmonary endothelial hyperpermeability. American journal of respiratory cell and molecular biology. 2012;47(4):445–453. doi: 10.1165/rcmb.2011-0332OC. [DOI] [PMC free article] [PubMed] [Google Scholar]
- 23.Czikora I, Alli A, Bao HF, et al. A novel tumor necrosis factor-mediated mechanism of direct epithelial sodium channel activation. American journal of respiratory and critical care medicine. 2014;190(5):522–532. doi: 10.1164/rccm.201405-0833OC. [DOI] [PMC free article] [PubMed] [Google Scholar]
- 24.Bao HF, Thai TL, Yue Q, et al. ENaC activity is increased in isolated, split-open cortical collecting ducts from protein kinase Calpha knockout mice. American journal of physiology Renal physiology. 2014;306(3):F309–320. doi: 10.1152/ajprenal.00519.2013. [DOI] [PMC free article] [PubMed] [Google Scholar]
- 25.McCormack JG, Halestrap AP, Denton RM. Role of calcium ions in regulation of mammalian intramitochondrial metabolism. Physiological reviews. 1990;70(2):391–425. doi: 10.1152/physrev.1990.70.2.391. [DOI] [PubMed] [Google Scholar]
- 26.Denton RM, McCormack JG, Edgell NJ. Role of calcium ions in the regulation of intramitochondrial metabolism. Effects of Na+, Mg2+ and ruthenium red on the Ca2+-stimulated oxidation of oxoglutarate and on pyruvate dehydrogenase activity in intact rat heart mitochondria. The Biochemical journal. 1980;190(1):107–117. doi: 10.1042/bj1900107. [DOI] [PMC free article] [PubMed] [Google Scholar]
- 27.Weiss JN, Korge P, Honda HM, Ping P. Role of the mitochondrial permeability transition in myocardial disease. Circulation research. 2003;93(4):292–301. doi: 10.1161/01.RES.0000087542.26971.D4. [DOI] [PubMed] [Google Scholar]
- 28.Akis N, Madaio MP. Isolation, culture, and characterization of endothelial cells from mouse glomeruli. Kidney international. 2004;65(6):2223–2227. doi: 10.1111/j.1523-1755.2004.00634.x. [DOI] [PubMed] [Google Scholar]
- 29.Kaneko Y, Nimmerjahn F, Madaio MP, Ravetch JV. Pathology and protection in nephrotoxic nephritis is determined by selective engagement of specific Fc receptors. The Journal of experimental medicine. 2006;203(3):789–797. doi: 10.1084/jem.20051900. [DOI] [PMC free article] [PubMed] [Google Scholar]
- 30.Yanase K, Smith RM, Cizman B, et al. A subgroup of murine monoclonal anti-deoxyribonucleic acid antibodies traverse the cytoplasm and enter the nucleus in a time-and temperature- dependent manner. Laboratory investigation; a journal of technical methods and pathology. 1994;71(1):52–60. [PubMed] [Google Scholar]
- 31.D’Andrea DM, Coupaye-Gerard B, Kleyman TR, Foster MH, Madaio MP. Lupus autoantibodies interact directly with distinct glomerular and vascular cell surface antigens. Kidney international. 1996;49(5):1214–1221. doi: 10.1038/ki.1996.175. [DOI] [PubMed] [Google Scholar]
- 32.Nicholls DG, Darley-Usmar VM, Wu M, Jensen PB, Rogers GW, Ferrick DA. Bioenergetic profile experiment using C2C12 myoblast cells. Journal of visualized experiments : JoVE. 2010;46 doi: 10.3791/2511. [DOI] [PMC free article] [PubMed] [Google Scholar]
Associated Data
This section collects any data citations, data availability statements, or supplementary materials included in this article.
Supplementary Materials
Cultured podocytes were incubated with F1.1-PGE2 conjugates (50μg/ml) for either 5 or 20 min at 37°C. Cells were stained using anti-human dylight 488 and anti-PGE2 antibodies, followed by anti-Rabbit TR (scale bar: 8 μm).
Endothelial cells were treated with 5% NTS for 48h . Cells were lysed, and PKC activity was assessed with PKC Kinase activity kit.
Endothelial cells were treated with 5% NTS, for 1 hour. Thereafter the PKC-α inhibitor (Ro-320432,10 nM, 50 nM, 100 nM) was added and the cells were incubated for 48 h. Cell death was evaluated by LDH release and expressed as percent of maximum LDH activity. (* p<0.05, ** p<0.01, *** indicates p<0.001, where LDH cytotoxicity values of samples compared to NTS treatement alone).
Control (2 mice), NTN (2 mice), NTN treated with PKC-α inhibitor (2 mice) and NTN treated with F1.1-PKC-α inhibitor (2 mice).
Supplementary Figure 5. Excel file of proteins included in Heatmap with accession numbers and corresponding names from kidney cortexes of mice from Supplementary Figure 4.
Quantification with Image J software is shown. Equal amount of protein (40 g) from each sample was resolved on SDS-PAGE, trans-blotted onto a PVDF membrane and subjected to immunoblot assay by using primary abs (1:750) ATP synthase and Cytochrome C followed by secondary anti-rabbit HRP (1:3000).
Supplementary Figure 7. Endothelial cells demonstrate decreased oxygen consumption (A), and increased extracellular acid release (B) in the presence of NTS.
NTS increased cells with depolarized mitochondria, (green fluorescence) in contrast to PKC-α inhibition, which increased orange fluorescence positive cells with healthy mitochondria. Representative flow charts are included.
Intracellular sodium concentrations were measured using the sodium sensitive dye SBFI. In brief, 10nM stock solution of the dye in DMSO was made and further diluted in PBS before loading onto the cells for 45 min. The ratio of fluorescent intensities at excitation 340nM/380nM/emission 510nM were recorded and the ratio calculated.


