

Abstract
BEAS-2B is a non-malignant, immortalized human cell line that has been used extensively as a model of lung epithelium. Despite ATCC recommendations to culture BEAS-2B in defined, serum-free media, many publications describe culturing BEAS-2B in fetal bovine serum (FBS)-containing media. The objective of this study was to define the effects of FBS on BEAS-2B cells. FBS exposure resulted in increased nuclear levels of transcription factors responsible for regulating epithelial-mesenchymal transition (EMT), increased cell invasiveness and increased anchorage-independent growth. FBS-exposed BEAS-2B cells exhibited a decrease of the epithelial markers, E-cadherin and claudin-1 at the mRNA and protein levels, along with a corresponding increase of the mesenchymal marker, vimentin, at the protein level. Fractionation studies implicated an active moiety in FBS with a molecular weight larger than 30 kD. The mesenchymal phenotype was persistent provided FBS exposure was maintained. Upon FBS removal, both epithelial and mesenchymal markers began to revert toward an epithelial phenotype. Transforming growth factor β1 (TGFβ1) exposure to BEAS-2B recapitulated some key features of FBS-induced EMT. Our data suggest that FBS-exposed BEAS-2B cells do not accurately model the epithelial phenotype. Interpretation of data from BEAS-2B should include careful consideration of the effect of culture conditions.
Keywords: BEAS-2B, Epithelial-mesenchymal transition, Respiratory, Epithelial, Cell culture, TGF
Introduction
Epithelial-to-mesenchymal transition (EMT) is a dynamic process that is involved in tissue homeostasis and, when dysregulated, in disease. During EMT, epithelial cells lose intercellular contacts and cellular polarity as they transdifferentiate into a migratory, mesenchymal phenotype. EMT is organized within a classification system based on biological context; Type-1 describes EMT in implantation, embryogenesis, and development, Type-2 EMT occurs in wound healing and tissue fibrosis, and Type-3 EMT occurs during carcinogenesis and includes the acquisition of chemotherapy resistance and metastatic potential (Kalluri and Weinberg, 2009). Diverse signaling networks can regulate EMT in a context-dependent manner (reviewed in (Lamouille et al., 2014) and (Thiery and Sleeman, 2006)). Activation of transforming growth factor β (TGFβ) receptors by ligands in the TGFβ superfamily induce EMT, through both SMAD mediated and non-SMAD signaling mechanisms (Derynck and Zhang, 2003; Moustakas and Heldin, 2005). Non-TGFβ receptor-mediated activators of EMT have also been described, including receptor tyrosine kinases, the Wnt, Notch, and Hedgehog signaling pathways, the inflammatory cytokine IL-6, and hypoxia through HIF-α signaling (Briscoe and Thérond, 2013; Li et al., 2006; Luo et al., 2011; Niehrs, 2012; Sullivan et al., 2009; Thiery and Sleeman, 2006; Xie et al., 2012; Yang et al., 2008). Additionally, EMT is not strictly unidirectional. The reverse process of EMT, mesenchymal-epithelial transition (MET), allows cells to reestablish an epithelial phenotype (Lamouille et al., 2014).
EMT plays an important role in lung physiology, where it functions in the routine repair of epithelial defects to maintain the integrity of the epithelial lining of the respiratory tract, an important component of the innate immune defense from pathogens (Reviewed in (Jolly et al., 2017)). Following injury, lung epithelial cells adjacent to a wound undergo EMT, migrate into the wound space, proliferate, and subsequently undergo MET to reestablish the epithelial layer.
Despite its importance, methods for studying EMT and wound healing in the lung remain incomplete (Gardner et al., 2010). The challenges of using in vivo models of EMT place a premium on useful in vitro models (Gardner et al., 2010) that include the BEAS-2B cell line (Fischer and Agrawal, 2014; Itoigawa et al., 2015; Lv et al., 2017; Minor and Proud, 2017; Pattarayan et al., 2017). BEAS-2B is a lung epithelial cell line which has been immortalized but is not considered to be malignant, as low passage cells do not form colonies in soft agar assays or xenografts in immunodeficient mice (Reddel et al., 1988). BEAS-2B was created through infection of primary human bronchial epithelial cells with an adenovirus 12-SV40 hybrid virus, followed by culture in defined, serum-free media (Ke et al., 1988). Culture in serum free media was continued following transformation and establishment of the BEAS-2B cell line. Early studies using BEAS-2B showed that the cells undergo terminal squamous differentiation and senescence when cultured in the presence of fetal bovine serum (FBS). (Ke et al., 1988; Miyashita et al., 1989). Apparently, BEAS-2B in current use do not undergo terminal differentiation following serum exposure, as many research groups culture BEAS-2B in media containing FBS, contrary to ATCC recommendation to use defined, serum-free media (ATCC, n.d.; Carpenter et al., 2011; Chang et al., 2010; Laulicht et al., 2015; Zhang et al., 2012, 2015).
Previously we have shown that culture of BEAS-2B in FBS-containing media results in morphologic and gene expression changes, as well as loss of the epithelial identity marker, E-cadherin (Zhao and Klimecki, 2014). In addition, increased caveloae-mediated endocytosis and carbon nanotube-induced cytotoxicity in BEAS-2B has been reported when comparing FBS-containing to serum-free media (Haniu et al., 2013). In this study, we tested the hypothesis that the FBS-induced phenotypic changes in BEAS-2B are due to induction of EMT.
Methods
Cell Culture Methods and Reagents: BEAS-2B cells were obtained from ATCC (Manassas, VA) and were maintained at passages below 28 for all studies. BEAS-2B cultures were maintained in BEGM media with SingleQuot kit additives (Product # CC-3170, Lonza, Walkersville, MD) in 75cm2 Falcon tissue culture treated flasks (ThermoFisher Scientific, Waltham, MA). All BEAS-2B culture vessels were coated with 0.01 mg/ml human fibronectin (ThermoFisher Scientific, Waltham, MA), 0.03 mg/ml bovine collagen type I (Advanced BioMatrix, San Diego, CA), and 0.01 mg/ml bovine serum albumin (BSA) in BEBM basal medium (Lonza, Walkersville, MD) for at least 2 hours at 37°C prior to plating. For routine cell culture, 225,000 cells were plated in a 75 cm2 flask. Culture media was replaced on the 2nd and 4th days following plating, and cultures were passaged on the 5th day. FBS was purchased from ThermoFisher Scientific (Gibco, Catalog number 26140079). Lots 1176987, 1851515, and 1780010 of FBS were used in these studies, with no lot-dependent effects observed. To study the effects of FBS on BEAS-2B, BEGM media was supplemented with 10% FBS. To study the effects of removing FBS from BEAS-2B culture media (termed “washout”) at defined points in time, cells were returned to culture in BEGM media without 10% FBS. FBS-cultured BEAS-2B were supplemented with FBS for 14-28 days in 10% FBS/BEGM and washout groups had FBS removed from the BEGM for 7-14 days, unless otherwise specified. To fractionate media by molecular weight, BEGM containing 10% FBS was centrifuged through Amicon Ultra 0.5 ml 30 kD cut-off spin filters (MilliporeSigma, Darmstadt, Germany) at 14,000 × g for 10 minutes. Recombinant TGFβ1 was purchased from MilliporeSigma and added to BEGM media.
Quantitative Real-Time Polymerase Chain Reaction (qRT-PCR): RNA isolation was performed using the RNeasy Mini Kit (Qiagen, Valencia, CA) and RNA concentrations were determined using a NanoDrop 2000 (ThermoFisher Scientific, Waltham, MA). qRT-PCR was performed using the TaqMan RNA-to-Ct 1-Step Kit (ThermoFisher Scientific, Waltham, MA) using 40 ng of total cellular RNA per reaction. Reactions were carried out in a StepOnePlus Real-Time PCR System (ThermoFisher Scientific, Waltham, MA). All TaqMan Gene Expression assays were purchased from Applied Biosystems, ThermoFisher Scientific. Target gene (FAM probe) Assay ID’s used for studies: CLDN1 (Hs00221623_m1), SNAI1 (Hs00195591_m1), SNAI2 (Hs00161904_m1), ZEB1 (Hs01566408_m1), TWIST1 (Hs01675818_s1), CDH1 (Hs01023894_m1), VIM (Hs00958111_m1), TGFB2 (Hs00234244_m1). RPLP0 (Hs99999902_m1) was used as a constitutively expressed comparison gene. RPLP0 gene expression was measure using a VIC-fluorophore-labeled probe, included in multiplexed reactions with the appropriate FAM-fluorophore-labeled probe to the targeted gene. qRT-PCR results were analyzed using the comparative CT Method (Schmittgen and Livak, 2008) using the StepOne Software v2.3 (Applied Biosystems).
Cell Lysis and Subcellular Fractionation: Prior to collection, cells were rinsed twice with ice cold phosphate buffered saline (PBS). For total cell lysate collection, cells were lysed using ice cold 150mM NaCl, 50mM Tris, 1% NP-40 with 1x MS-SAFE Protease and Phosphatase Inhibitor (MilliporeSigma, Darmstadt, Germany). Samples were sonicated and insoluble cell components were cleared by centrifugation at 18,000g for 15 minutes at 4°C. To perform subcellular fractionation, 4,000,000 cells were lysed with subcellular fractionation buffer (250mM sucrose, 20mM HEPES (pH 7.4), 10mM KCl, 1.5mM MgCl2, 1mM EDTA, 1mM EGTA, 1mM DTT, and 1x MS-SAFE Protease and Phosphatase Inhibitor). Lysates were passed through a 27.5 gauge needle 10 times and incubated on ice for 20 minutes in 1.5 ml tubes. Nuclear pellets were isolated by centrifugation at 720g for 5 min. Supernatant was collected into separate tubes and the nuclear pellet was washed with 500μl of subcellular fractionation buffer. The washed nuclear fraction was passed through a 27.5 gauge needle an additional 10 times and pelleted again by centrifugation at 720g for 10 minutes. Supernatant from this wash was combined with the previous supernatants and the nuclear pellet was lysed with subcellular fractionation buffer supplemented with 10% glycerol and 0.1% SDS. The nuclear fraction was sonicated to ensure resuspension/dissolution of proteins. To collect cytoplasmic protein fractions, previously collected supernatants were centrifuged at 10,000g for 10 minutes. The supernatants from this centrifugation constituted the cytoplasmic protein fraction. Protein sample concentrations for all collection methods were determined using the Pierce 660 nm Protein Assay (ThermoFisher Scientific, Waltham, MA).
Protein immunoblotting: 10 μg of protein was combined with sample buffer to a final concentration of 10% glycerol, 100 mM DTT, 50 mM Tris-HCl (pH 6.8), 2% SDS, and 0.1% bromophenol blue. Lysates in sample buffer were heated at 95°C for 10 minutes. Samples were then resolved using SDS-polyacrylamide gel electrophoresis in a Mini Gel Tank (ThermoFisher Scientific, Waltham, MA) using Bolt 4-12% Bis-Tris gradient gels (ThermoFisher Scientific, Waltham, MA). Proteins within the gel were then transferred onto 0.45 μm nitrocellulose membrane (MilliporeSigma, Darmstadt, Germany) in a Mini Gel Tank (ThermoFisher Scientific, Waltham, MA) at 0.28 mA for 1 hour. Membranes were subjected to Ponceau S staining (MilliporeSigma, Darmstadt, Germany) to assess equal protein loading and transfer. Membranes were then blocked with 5% milk in PBST (PBS supplemented with 0.1% Tween-20) for 30 minutes, then subjected to antibody incubations. Primary antibodies for E-cadherin, Vimentin, Claudin-1, Snail, Slug, and ZEB1 from Cell Signaling Technology (Danvers, MA) and for α-Tubulin (MilliporeSigma, Darmstadt, Germany) were used at a concentration of 1:1000. Antibodies purchased from Santa Cruz Biotechnology (Dallas, TX) were used at the following dilutions: GAPDH (1:5000), Lamin B1 (1:1000), and Twist (1:1000). Goat anti-rabbit and goat anti-mouse horseradish peroxidase-conjugated secondary antibodies (Santa Cruz Biotechnology) were used at concentration of 1:4000. Primary antibody incubations were performed in 5% nonfat dried milk in PBST overnight at 4°C with gentle shaking. Membranes were washed 3 times for 5 minutes in PBST at room temperature and incubated with secondary antibody in 5% milk in PBST at room temperature for 5 hours. Membranes were then washed 3 times for 15 minutes at room temperature in PBST. Immunoblots were visualized using SuperSignal West Dura or SuperSignal West Femto chemiluminescent substrates (ThermoFisher Scientific, Waltham, MA). Light images of Ponceau S staining and chemiluminescent images of immunoblots were obtained using a GeneGnome HR imaging system (Syngene, Frederick, MD). Quantitation of total lane Ponceau S signal and immunoblot band intensity was performed using GeneTools software (Syngene).
Immunostaining and Fluorescence Microscopy: Immunostaining was performed using an adapted protocol from Cell Signaling Technology. Coverslips were placed into 6-well plates and incubated in coating solution as indicated previously. Cells were seeded at a density of 1,000,000 cells per well. 24 hours after plating, cells were rinsed twice with PBS and fixed using 4% formaldehyde in PBS for 15 min at room temperature in the dark. Fixative was then removed and coverslips were rinsed using PBS 3 times for 5 minutes. Coverslips were then transferred to a humidified chamber and blocked using 5% goat serum (MilliporeSigma, Darmstadt, Germany) in PBS for 60 minutes at room temperature. Primary antibodies for rabbit anti-human E-cadherin and mouse anti-human Vimentin (Cell Signaling Technology) were diluted 1:100 in antibody dilution buffer (0.3% Triton X-100 and 1% BSA in PBS) and incubated on coverslips overnight at 4°C. Coverslips were then rinsed with PBS 3 times for 5 minutes. Goat anti-rabbit AlexaFluor 488-conjugated and goat anti-mouse AlexaFluor 546-conjugated secondary antibodies were diluted 1:200 in antibody dilution buffer and incubated on coverslips for 120 minutes at room temperature in the dark. Images were captured using an IX70 inverted microscope with an IX-FLA reflected light fluorescence attachment (Olympus, Tokyo, Japan).
Scratch Assay: Scratch assays were performed by adapting a previously described protocol (Liang et al., 2007). BEAS-2B were seeded in 12-well plates at a density of 500,000 cells/well. 24 hours after plating, scratches were introduced along the diameter of the well using a 10μl pipette tip (Neptune brand, ThermoFisher Scientific, Waltham, MA). Following the scratch, plates were rinsed 3 times with warm PBS and returned to fresh media. Small cuts were made adjacent to the scratch area into the underside of each well using a razor blade. Referencing to the razor cuts and adjusting the microscope stage to a repeatable position facilitated reimaging the same scratch region over time. For each imaging measurement, plates were rinsed 3 times with warm PBS, followed by fresh media. Images of scratch assays were captured using phase contrast microscopy on an IX70 inverted microscope (Olympus, Tokyo, Japan) with an exposure time of 2.116 milliseconds.
Soft Agar Assay: Soft agar assays were performed using the specified culture medium mixed with Noble agar (Affymetrix, Santa Clara, CA). A 2 ml base layer of 0.7% Noble agar/medium was solidified in the bottom of 6-well plates. Cells were trypsinized and a 2 ml cell layer containing 0.4% Noble agar/medium and 10,000 cells was gently seeded on the surface of base layer and allowed to polymerize. A final layer of 2 ml of cell culture media (with no agar) was placed on top of the cell layer. Every 4 days, 1 ml of media was removed from the top layer and replaced with 1 ml of fresh media. Following 2 weeks of growth in soft agar, wells were stained with 2 mg/ml 3-(4, 5-dimethylthiazol-2-yl)-2, 5-diphenyltetrazolium bromide (MTT) for 4 hours and images were captured with a Nikon 3200 digital camera. Images were captured in manual mode with an aperture of f16 and a shutter speed of 1/20 second. Images were analyzed in ImageJ (NIH, Bethesda, MD) using the following command sequence for all images: selection tool for well outline, background subtraction (rolling ball radius of 50), background set to black, make binary, run watershed, analyze particles (particle size: 20-infinity).
Results
Exposure of BEAS-2B to FBS results in decreased epithelial-associated gene RNA
BEAS-2B were cultured in BEGM supplemented with 10% FBS for increasing durations of time and RNA levels of epithelial phenotype-associated genes was assessed using qRT-PCR. Exposure to FBS resulted in a time-dependent decrease in RNA quantity of epithelial markers E-cadherin (CDH1) and claudin-1 (CDLN1) over 18 days of FBS treatment (Figure 1). Washout treatments were performed by returning the FBS-exposed BEAS-2B to FBS-free BEGM media. There was a statistically significant increase in RNA quantity of E-cadherin and claudin-1 following removal of FBS from the BEGM media for 10 days. This suggests that the loss of epithelial identity observed may be reversible, even after a relatively protracted FBS exposure. Changes in the transcriptional expression of the mesenchymal marker vimentin (VIM) followed a general trend of rising during FBS exposure and falling upon FBS removal, albeit at a level that was not statistically significant.
Figure 1.

FBS exposure decreases RNA content of epithelial markers in BEAS-2B. BEAS-2B cells cultured in BEGM were exposed to 10% FBS/BEGM for the indicated durations, and transcripts levels of indicated genes were assessed using qRT-PCR at the indicated time-points. At 18 days of FBS exposure, BEAS-2B were removed from FBS exposure and returned to BEGM alone for the indicated exposure times [“washout” group (WO)]. Each bar in the graph represents the RNA quantity relative to untreated BEAS-2B cells cultured in BEGM alone (control set to 1.0) and is a summary of 3 biological replicates. Statistical significance was assessed by one-way ANOVA with Tukey’s post hoc test between BEGM control, 18 day FBS, and 10 day WO treatment groups. X-axis notations: 1 = p < 0.05 relative to the BEGM control group. 2 = p < 0.05 relative to the 18 day FBS group. Error bars: standard error of the mean (SEM).
Treatment of BEAS-2B with FBS results in a time-dependent loss of epithelial-associated proteins and a time dependent increase in mesenchymal-associated proteins
Using the same FBS exposure conditions as described for Figure 1, cells were assayed for protein markers of EMT by immunoblot (Figure 2). Similar to RNA quantity, there was a time-dependent decrease in E-cadherin protein levels, which partially recovered in the 10 day FBS washout period. Claudin-1 protein levels decreased dramatically in as early as 2 days of FBS exposure, and remained low throughout FBS exposure. In contrast to claudin-1 RNA quantity, which recovered to nearly baseline level (RNA quantity of BEGM control) in the 10 day washout time course, claudin-1 protein levels remained below 50% of baseline. In conjunction with a loss of epithelial markers, FBS exposure also causes increases in protein levels of the mesenchymal marker vimentin in a time-dependent manner. Following washout of FBS, the protein level of vimentin decreases but does not return to control levels within the 10 day washout period.
Figure 2.

FBS decreases protein content of epithelial markers and increases protein content of mesenchymal markers in BEAS-2B. Representative images (A) and quantification (B) of immunoblots. BEAS-2B cells cultured in BEGM were exposed to 10% FBS/BEGM for the indicated durations and levels of indicated proteins were measured at the indicated time-points. FBS-exposed BEAS-2B were returned to BEGM alone following indicated exposure times (WO). Each bar in the graph represents the mean band intensity adjusted for the band intensity of the constitutively expressed gene, GAPDH. Protein expression for each duration of exposure was expressed as a ratio to untreated BEAS-2B cells cultured in BEGM (control set to 1.0). Quantification graph is a summary of 3 biological replicates. Statistical significance was assessed by one-way ANOVA with Tukey’s post hoc test between BEGM control, 18 day FBS, and 10 day WO treatment groups. X-axis notations: 1 = p < 0.05 relative to the BEGM control group. 2 = p < 0.05 relative to the 18 day FBS group. Error bars: SEM.
Treatment of BEAS-2B with FBS results in nuclear accumulation of canonical EMT-regulating transcription factors
Transcriptional induction of genes associated with EMT can be driven by transcription factors that include Snail, Slug, ZEB1, and Twist (Craene and Berx, 2013). To assess the effects of FBS exposure on activation of these EMT-regulating transcription factors, subcellular fractionation was performed on BEAS-2B exposed to FBS for at least 14 days, by which time a maximal effect on transcription factor nuclear accumulation had been observed (Figure 3). FBS exposure induced a statistically significant nuclear accumulation of Snail, Slug, and ZEB1 transcription factors in BEAS-2B. Accumulation of Twist in the nucleus was not significantly different when compared to BEGM alone.
Figure 3.
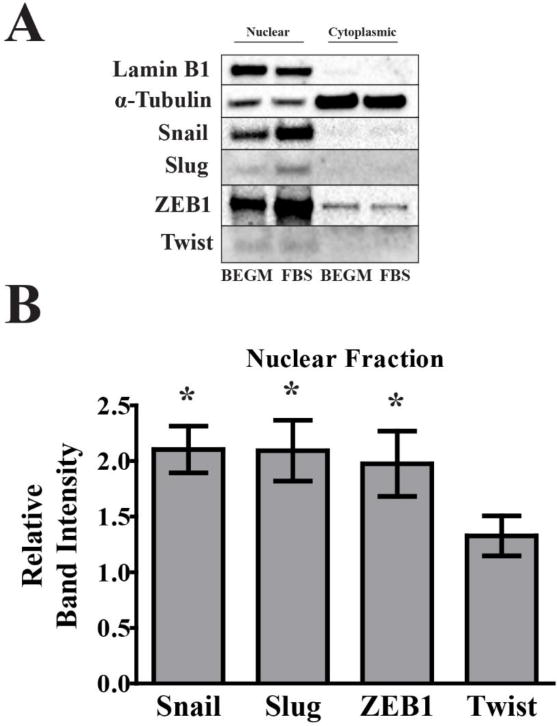
FBS induces nuclear accumulation of EMT-regulating transcription factors in BEAS-2B. Representative images (A) and nuclear fraction quantification (B) of immunoblots. Nuclear and cytoplasmic fractionation of BEAS-2B cells cultured in 10% FBS/BEGM for 14-28 days were analyzed. Each bar in the graph represents the mean band intensity adjusted to whole lane Ponceau staining intensity, relative to untreated BEAS-2B cells cultured in BEGM (control set to 1.0). Ponceau staining was used for protein loading control due to repeatable reduction of Lamin B1 in the FBS-treated cells. Lamin B1 (nuclear marker) and α-tubulin (cytoplasmic marker) were used to establish successful nuclear and cytoplasmic fractionation. Quantification graph is a summary of 5 biological replicates. Statistical significance was assessed by one-sample t test against a reference value of 1.0. * = α < 0.05 relative to the BEGM control group. Error bars: SEM.
Treatment of BEAS-2B with FBS changes cellular morphology
In addition to RNA and protein content changes indicative of EMT, we observed FBS-induced changes to cell morphology using phase contrast microscopy. In BEAS-2B cultured in BEGM, cells adopt a cobblestone appearance, characteristic of columnar/cuboidal epithelial cells (Thiery and Sleeman, 2006). Spindle-shaped cells, which can be a characteristic of mesenchymal cells (Thiery and Sleeman, 2006), are restricted to areas of lower confluency. In contrast, FBS-cultured BEAS-2B have a more elongated, spindle shape (Figure 4a). Following 4 days of FBS washout, cell have begun to undergo MET, as indicated by their shorter, less spindle-like shape.
Figure 4.

FBS induces morphological and cytoskeletal changes consistent with EMT in BEAS-2B. BEGM, FBS, and FBS washout BEAS-2B were subjected to phase contrast microscopy (A) or immunofluorescence for vimentin (B). Representative phase contrast images were taken under a total magnification of 200×. Representative immunofluorescence imaging of vimentin were taken under a total magnification of 100×. All images are representative of 3 biological replicates.
Localization of the mesenchymal marker, vimentin, also highlights the observed change in cell morphology. In the BEAS-2B cultured in BEGM, the mesenchymal marker vimentin can be detected only in small amounts, localized in perinuclear clusters. In FBS-cultured BEAS-2B, well-ordered and increased vimentin staining can be observed throughout the cytoplasm (Figure 4b). Together, these morphological changes support the induction of EMT in FBS-exposed BEAS-2B.
Treatment of BEAS-2B with FBS induces functional characteristics of EMT
To determine if the markers of EMT observed in BEAS-2B following FBS exposure confer functional consequences in cell behavior, modeled wound-filling was assessed using scratch assays. Over the course of 48 hours, FBS-cultured BEAS-2B filled significantly more scratch space than the BEAS-2B cultured in BEGM (Figure 5a). This is consistent with the migratory phenotype observed in mesenchymal cells. Anchorage-independent growth in soft agar, another feature of the EMT-induced mesenchymal phenotype was also assessed. FBS-cultured BEAS-2B show significantly increased colony formation in soft agar assays (Figure 5c), consistent with the mesenchymal phenotype of enhanced growth. Removal of FBS from the media resulted in the loss of anchorage-independent growth.
Figure 5.

FBS induces modeled wound healing and anchorage-independent growth in BEAS-2B. BEGM and FBS-cultured BEAS-2B were analyzed by scratch assay for 48 hours. Images are representative of 5 biological replicates, each containing 3 technical replicates (A), which are summarized in the quantification graph (B). BEAS-2B cells cultured in BEGM, FBS-cultured, and FBS washout BEAS-2B were analyzed by soft agar assay. Representative images of 7 biological replicates of FBS group and 3 biological replicates of WO group (C). Quantification of images is summarized in the graph (D). Statistical significance for both figures was assessed by one-way ANOVA with Tukey’s post hoc test. * = p < 0.05 relative to the BEGM control group. Error bars: standard deviation (SD).
TGFβ treatment is similar to FBS treatment in BEAS-2B
To gain insight into the signaling mechanisms that could be driving FBS-induced EMT, specific activation of the TGFβ pathway, a canonical inducer of EMT, was assessed. BEAS-2B cells in BEGM were treated with TGFβ1 for 2 days and assessed for claudin-1 protein levels. Similarly, BEAS-2B cells were treated with FBS for 2 days and results were compared (Figure 6). FBS exposure resulted in a dose-dependent decrease in claudin-1 protein levels, with a statistically significant reduction at FBS concentrations above 0.25%. Similar to FBS, TGFβ1 induced a dose-dependent loss of claudin-1 protein, which was statistically significant at the lowest dose tested of 0.25 ng/ml.
Figure 6.

TGFβ1 treatment induces loss of epithelial marker claudin-1. Representative images (A) and quantification (B) of immunoblots. BEAS-2B were cultured in BEGM media containing the indicated doses of either TGFβ1 or FBS for 2 days and assessed. Albumin protein levels were assessed by immunoblot as a biological marker of FBS exposure. Quantification graph represents the relative band intensity to the BEGM control group (control set to 1.0), adjusted for GAPDH loading control and is a summary of 3 biological replicates. Statistical significance for both figures was assessed by one-way ANOVA with Tukey’s post hoc test. * = p < 0.05 relative to the BEGM control group. Error bars: SEM.
EMT-activation by FBS is lost in the sub-30 kD FBS fraction
Media containing FBS was centrifuged through size exclusion columns with a molecular weight threshold of 30 kD. BEAS-2B were then exposed in culture for 48 hours to the size-excluded media containing components less than 30 kD. Similarly, concentrated components greater than 30 kD retained by the filters were resuspended in BEGM and used in 48 hour cell-culture exposures of BEAS-2B (Figure 7). Surprisingly, the size-excluded media containing components less than 30 kD not only prevented the loss of claudin-1 protein observed following FBS exposure, levels of claudin-1 protein were increased relative to BEGM conditions. Conversely, addition of the concentrated components retained by the filter (components larger than 30 kD) induced loss of claudin-1 protein after 48 hours of exposure in a similar fashion to previous experiments using complete 10% FBS/BEGM.
Figure 7.

EMT-inducing component of FBS is larger than 30 kD. Representative images (A) and quantification (B) of immunoblots. Size exclusion of 10%FBS/BEGM media was performed. Effect of size excluded media and retentate resuspended in BEGM on claudin-1 protein levels following 2 days of exposure was assessed. Quantification graph represents the relative band intensity to the BEGM control group (control set to 1.0), adjusted for GAPDH loading control and is a summary of 3 biological replicates. Statistical significance was assessed by one-sample t test to a hypothetical value of 1.0. * = α < 0.05 relative to the BEGM control group. Error bars: SD.
Discussion
Early work by the lab of Curtis Harris, which established the BEAS-2B cell line, documented what was termed “squamous differentiation” by the BEAS-2B cells in the presence of serum. Squamous differentiation of BEAS-2B reliably resulted in cell senescence and loss of immortality. We have previously shown that long term culture of BEAS-2B in FBS-containing media resulted in gene expression loss of the epithelial marker E-cadherin when assayed by microarray (Zhao and Klimecki, 2014). Work in the current study more clearly defines FBS-induced cellular and molecular biological changes in this widely used in vitro model. We show that BEAS-2B cultured with FBS show loss of specific markers of epithelial cell identity, as well as gain of specific markers of mesenchymal cell identity, at both the RNA and protein levels. This is associated with nuclear accumulation of transcription factors considered to be master regulators of cellular EMT following exposure to FBS. Additionally, changes in cellular morphology and increased cell migration and anchorage-independent growth suggest that these changes at the RNA and protein levels result in functional acquisition of the mesenchymal phenotype. Investigation into the mechanism of activation of EMT from FBS showed that protein changes following exposure to purified TGFβ-1 are similar to changes observed following FBS exposure. Interestingly, not only did excluding 10% FBS/BEGM media components larger than 30 kD remove the EMT induction observed in normal FBS-containing cultures, BEAS-2B in the size-excluded media showed greater levels of proteins involved in intracellular junctions.
Taken together, the data strongly support that BEAS-2B undergo EMT following exposure to FBS. Owing to the molecular changes that occur in BEAS-2B following FBS exposure, the case could be made that BEAS-2B can serve as a useful in vitro model for further elucidating the signaling events that drive EMT in respiratory epithelium. An interesting feature of FBS-induced EMT is that the mesenchymal phenotype persists for at least several weeks in FBS-containing culture, but can still be reversed after removal of FBS. Despite routine culture in FBS for over 8 weeks, morphological changes could still be observed following removal of FBS from the media (data not shown). Utilizing size excluded media, it appears the molecule or molecules responsible for driving EMT are larger than 30 kD. Many serum cytokines, hormones, and growth factor monomers are not retained by a 30 kD cut-off filter (Anderson et al., 2004; Anderson and Anderson, 2002). Proteins larger than 30 kD that have been implicated in EMT in other studies include albumin (66.5 kD) and inactive TGFβ bound to the latency peptide (44 kD) (Lamouille et al., 2014; Zoja et al., 2003). We observed that 14 days of TGFβ1 exposure alone was not sufficient to induce colony formation in the soft agar assay (data not shown). This suggests that, if TGFβ plays a role in serum-induced EMT, it requires additional serum factors to fully activate the properties of EMT observed in our study. Further work will be required to identify the molecule or molecules in FBS driving EMT.
A strength of BEAS-2B cells as an experimental model is its fidelity in modeling normal epithelial cells (Ke et al., 1988; Reddel et al., 1988). However, one limitation of BEAS-2B is its low transepithelial resistance (TEER), potentially due to weak tight junction formation (Stewart et al., 2012). If excluding components of BEGM media improves protein expression of tight junction proteins and consequently improves BEAS-2B TEER, this media manipulation could improve the fidelity of the BEAS-2B cell line as an epithelial model.
Many research reports describe the use of BEAS-2B that were cultured in FBS. It is not unusual for those same reports to also describe the model as “epithelial” under those culture conditions (Carpenter et al., 2011; Chang et al., 2010; Laulicht et al., 2015; Zhang et al., 2012, 2015). Our data suggests that the phenotype that is modeled under those conditions would better be described as mesenchymal. To be clear, a particular BEAS-2B culture condition is neither “correct” nor “incorrect.” The important point is that BEAS-2B culture conditions produce very different phenotypes that should be accurately accounted for. This of particular importance when BEAS-2B is used as a model of toxicant-induced malignant transformation. Increased invasiveness and anchorage-independent growth in assays, such as the scratch assay and soft agar assay (Figure 5), are commonly cited as evidence of acquisition of malignant transformation following chronic toxicant exposure. Our data suggest that addition of FBS to cell culture media can induce both of these cellular phenotypes, independent of toxicant exposure. This could confound attempts to distinguish between toxicant-induced carcinogenesis and FBS-induced EMT, due to the significant overlap of the two phenotypes in in vitro assays. This study offers a new potential use of BEAS-2B, as an inducible and reversible EMT model. Our work also underscores the need to consider the impact of culture conditions on the fidelity with which the cell line performs as an experimental model.
Highlights.
FBS exposure induces phenotypic and functional characteristics of EMT in BEAS-2B
FBS-inducing components of EMT are larger than 30 kD
FBS exposure could complicate interpretation of studies using BEAS-2B as an in vitro model in carcinogenicity assays
Footnotes
Publisher's Disclaimer: This is a PDF file of an unedited manuscript that has been accepted for publication. As a service to our customers we are providing this early version of the manuscript. The manuscript will undergo copyediting, typesetting, and review of the resulting proof before it is published in its final citable form. Please note that during the production process errors may be discovered which could affect the content, and all legal disclaimers that apply to the journal pertain.
Bibliography
- Anderson NL, Anderson NG. The Human Plasma Proteome. Mol Cell Proteomics. 2002;1:845–867. doi: 10.1074/mcp.R200007-MCP200. [DOI] [PubMed] [Google Scholar]
- Anderson NL, Polanski M, Pieper R, Gatlin T, Tirumalai RS, Conrads TP, Veenstra TD, Adkins JN, Pounds JG, Fagan R, Lobley A. The Human Plasma Proteome. Mol Cell Proteomics. 2004;3:311–326. doi: 10.1074/mcp.M300127-MCP200. [DOI] [PubMed] [Google Scholar]
- ATCC. BEAS-2B (ATCC CRL-9609) Culture Method [WWW Document] n.d. URL https://atcc.org/Products/All/CRL-9609.aspx#culturemethod.
- Briscoe J, Thérond PP. The mechanisms of Hedgehog signalling and its roles in development and disease. Nat Rev Mol Cell Biol. 2013;14:416–29. doi: 10.1038/nrm3598. [DOI] [PubMed] [Google Scholar]
- Carpenter RL, Jiang Y, Jing Y, He J, Rojanasakul Y, Liu L, Jiang B. Arsenite induces cell transformation by reactive oxygen species, AKT, ERK1/2, and p70S6K1. Biochem Biophys Res Commun. 2011;414:533–8. doi: 10.1016/j.bbrc.2011.09.102. [DOI] [PubMed] [Google Scholar]
- Chang Q, Pan J, Wang X, Zhang Z, Chen F, Shi X. Reduced reactive oxygen species-generating capacity contributes to the enhanced cell growth of arsenic-transformed epithelial cells. Cancer Res. 2010;70:5127–35. doi: 10.1158/0008-5472.CAN-10-0007. [DOI] [PMC free article] [PubMed] [Google Scholar]
- De Craene B, Berx G. Regulatory networks defining EMT during cancer initiation and progression. Nat Rev Cancer. 2013;13:97–110. doi: 10.1038/nrc3447. [DOI] [PubMed] [Google Scholar]
- Derynck R, Zhang YE. Smad-dependent and Smad-independent pathways in TGF-beta family signalling. Nature. 2003;425:577–84. doi: 10.1038/nature02006. [DOI] [PubMed] [Google Scholar]
- Fischer KD, Agrawal DK. Vitamin D regulating TGF-β induced epithelial-mesenchymal transition. Respir Res. 2014;15:146. doi: 10.1186/s12931-014-0146-6. [DOI] [PMC free article] [PubMed] [Google Scholar]
- Gardner A, Borthwick LA, Fisher AJ. Lung epithelial wound healing in health and disease. Expert Rev Respir Med. 2010;4:647–60. doi: 10.1586/ers.10.62. [DOI] [PubMed] [Google Scholar]
- Haniu H, Saito N, Matsuda Y, Tsukahara T, Maruyama K, Usui Y, Aoki K, Takanashi S, Kobayashi S, Nomura H, Okamoto M, Shimizu M, Kato H. Culture medium type affects endocytosis of multi-walled carbon nanotubes in BEAS-2B cells and subsequent biological response. Toxicol Vitr. 2013;27:1679–1685. doi: 10.1016/j.tiv.2013.04.012. [DOI] [PubMed] [Google Scholar]
- Itoigawa Y, Harada N, Harada S, Katsura Y, Makino F, Ito J, Nurwidya F, Kato M, Takahashi F, Atsuta R, Takahashi K. TWEAK enhances TGF-β-induced epithelial-mesenchymal transition in human bronchial epithelial cells. Respir Res. 2015;16:48. doi: 10.1186/s12931-015-0207-5. [DOI] [PMC free article] [PubMed] [Google Scholar]
- Jolly MK, Ward C, Eapen MS, Myers S, Hallgren O, Levine H, Sohal SS. Epithelial mesenchymal transition (EMT), a spectrum of states: role in lung development, homeostasis and disease. Dev Dyn. 2017:1–47. doi: 10.1002/dvdy.24541. [DOI] [PubMed] [Google Scholar]
- Kalluri R, Weinberg RA. The basics of epithelial-mesenchymal transition. J Clin Invest. 2009;119:1420–1428. doi: 10.1172/JCI39104.1420. [DOI] [PMC free article] [PubMed] [Google Scholar]
- Ke Y, Reddel RR, Gerwin BI, Miyashita M, McMenamin M, Lechner JF, Harris CC. Human bronchial epithelial cells with integrated SV40 virus T antigen genes retain the ability to undergo squamous differentiation. Differentiation. 1988;38:60–66. doi: 10.1111/j.1432-0436.1988.tb00592.x. [DOI] [PubMed] [Google Scholar]
- Lamouille S, Xu J, Derynck R. Molecular mechanisms of epithelial-mesenchymal transition. Natl Rev Mol Cell Biol. 2014;15:178–196. doi: 10.1038/nrm3758.Molecular. [DOI] [PMC free article] [PubMed] [Google Scholar]
- Laulicht F, Brocato J, Cartularo L, Vaughan J, Wu F, Kluz T, Sun H, Oksuz BA, Shen S, Paena M, Medici S, Zoroddu MA, Costa M. Tungsten-induced carcinogenesis in human bronchial epithelial cells. Toxicol Appl Pharmacol. 2015;288:33–39. doi: 10.1016/j.taap.2015.07.003. [DOI] [PMC free article] [PubMed] [Google Scholar]
- Li X, Deng W, Nail CD, Bailey SK, Kraus MH, Ruppert JM, Lobo-Ruppert SM. Snail induction is an early response to Gli1 that determines the efficiency of epithelial transformation. Oncogene. 2006;25:609–21. doi: 10.1038/sj.onc.1209077. [DOI] [PMC free article] [PubMed] [Google Scholar]
- Liang CC, Park AY, Guan JL. In vitro scratch assay: a convenient and inexpensive method for analysis of cell migration in vitro. Nat Protoc. 2007;2:329–333. doi: 10.1038/nprot.2007.30. [DOI] [PubMed] [Google Scholar]
- Luo D, Wang J, Li J, Post M. Mouse snail is a target gene for HIF. Mol Cancer Res. 2011;9:234–45. doi: 10.1158/1541-7786.MCR-10-0214. [DOI] [PubMed] [Google Scholar]
- Lv J, Sun B, Mai Z, Jiang M, Du J. CLDN-1 promoted the epithelial to migration and mesenchymal transition (EMT) in human bronchial epithelial cells via Notch pathway. Mol Cell Biochem. 2017;432:91–98. doi: 10.1007/s11010-017-3000-6. [DOI] [PubMed] [Google Scholar]
- Minor DM, Proud D. Role of human rhinovirus in triggering human airway epithelial-mesenchymal transition. Respir Res. 2017;18:110. doi: 10.1186/s12931-017-0595-9. [DOI] [PMC free article] [PubMed] [Google Scholar]
- Miyashita M, Smith MW, Willey JC, Lechner JF, Trump BF, Harris CC. Effects of serum, transforming growth factor type beta, or 12-O-tetradecanoyl-phorbol-13-acetate on ionized cytosolic calcium concentration in normal and transformed human bronchial epithelial cells. Cancer Res. 1989;49:63–7. [PubMed] [Google Scholar]
- Moustakas A, Heldin CH. Non-Smad TGF-beta signals. J Cell Sci. 2005;118:3573–84. doi: 10.1242/jcs.02554. [DOI] [PubMed] [Google Scholar]
- Niehrs C. The complex world of WNT receptor signalling. Nat Rev Mol Cell Biol. 2012;13:767–79. doi: 10.1038/nrm3470. [DOI] [PubMed] [Google Scholar]
- Pattarayan D, Sivanantham A, Krishnaswami V, Loganathan L, Palanichamy R, Natesan S, Muthusamy K, Rajasekaran S. Tannic acid attenuates TGF-β1-induced epithelial-to-mesenchymal transition by effectively intervening TGF-β signaling in lung epithelial cells. J Cell Physiol. 2017 doi: 10.1002/jcp.26127. [DOI] [PubMed] [Google Scholar]
- Reddel RR, Ke Y, Gerwin BI, McMenamin MG, Lechner JF, Su RT, Brash DE, Park JB, Rhim JS, Harris CC. Transformation of human bronchial epithelial cells by infection with SV40 or adenovirus-12 SV40 hybrid virus, or transfection via strontium phosphate coprecipitation with a plasmid containing SV40 early region genes. Cancer Res. 1988;48:1904–9. doi: 10.1002/ijc.2910610210. [DOI] [PubMed] [Google Scholar]
- Schmittgen TD, Livak KJ. Analyzing real-time PCR data by the comparative C(T) method. Nat Protoc. 2008;3:1101–8. doi: 10.1038/nprot.2008.73. [DOI] [PubMed] [Google Scholar]
- Stewart CE, Torr EE, Mohd Jamili NH, Bosquillon C, Sayers I. Evaluation of Differentiated Human Bronchial Epithelial Cell Culture Systems for Asthma Research. J Allergy. 2012;2012:1–11. doi: 10.1155/2012/943982. [DOI] [PMC free article] [PubMed] [Google Scholar]
- Sullivan NJ, Sasser AK, Axel AE, Vesuna F, Raman V, Ramirez N, Oberyszyn TM, Hall BM. Interleukin-6 induces an epithelial-mesenchymal transition phenotype in human breast cancer cells. Oncogene. 2009;28:2940–7. doi: 10.1038/onc.2009.180. [DOI] [PMC free article] [PubMed] [Google Scholar]
- Thiery JP, Sleeman JP. Complex networks orchestrate epithelial-mesenchymal transitions. Nat Rev Mol Cell Biol. 2006;7:131–42. doi: 10.1038/nrm1835. [DOI] [PubMed] [Google Scholar]
- Xie M, Zhang L, He C, Xu F, Liu J, Hu Z, Zhao L, Tian Y. Activation of Notch-1 enhances epithelial-mesenchymal transition in gefitinib-acquired resistant lung cancer cells. J Cell Biochem. 2012;113:1501–13. doi: 10.1002/jcb.24019. [DOI] [PubMed] [Google Scholar]
- Yang MH, Wu MZ, Chiou SH, Chen PM, Chang SY, Liu CJ, Teng SC, Wu KJ. Direct regulation of TWIST by HIF-1alpha promotes metastasis. Nat Cell Biol. 2008;10:295–305. doi: 10.1038/ncb1691. [DOI] [PubMed] [Google Scholar]
- Zhang T, Qi Y, Liao M, Xu M, Bower KA, Frank JA, Shen HM, Luo J, Shi X, Chen G. Autophagy is a cell self-protective mechanism against arsenic-induced cell transformation. Toxicol Sci. 2012;130:298–308. doi: 10.1093/toxsci/kfs240. [DOI] [PubMed] [Google Scholar]
- Zhang Z, Pratheeshkumar P, Budhraja A, Son Y, Kim D, Shi X. Role of reactive oxygen species in arsenic-induced transformation of human lung bronchial epithelial (BEAS-2B) cells. Biochem Biophys Res Commun. 2015;456:643–8. doi: 10.1016/j.bbrc.2014.12.010. [DOI] [PMC free article] [PubMed] [Google Scholar]
- Zhao F, Klimecki WT. Culture conditions profoundly impact phenotype in BEAS-2B, a human pulmonary epithelial model. J Appl Toxicol. 2014:945–951. doi: 10.1002/jat.3094. [DOI] [PMC free article] [PubMed] [Google Scholar]
- Zoja C, Morigi M, Remuzzi G. Proteinuria and phenotypic change of proximal tubular cells. J Am Soc Nephrol. 2003;14(Suppl 1):S36–41. doi: 10.1097/01.ASN.0000068626.23485.E0. [DOI] [PubMed] [Google Scholar]