Abstract
Advancements in 7T MR imaging bring higher spatial resolution and clearer tissue contrast, in comparison to the conventional 3T and 1.5T MR scanners. However, 7T MRI scanners are less accessible at the current stage due to higher costs. Through analyzing the appearances of 7T images, we could improve both the resolution and quality of 3T images by properly mapping them to 7T-like images; thus, promoting more accurate post-processing tasks, such as segmentation. To achieve this method based on an unique dataset acquired both 3T and 7T images from same subjects, we propose novel multi-level Canonical Correlation Analysis (CCA) method and group sparsity as a hierarchical framework to reconstruct 7T-like MRI from 3T MRI. First, the input 3T MR image is partitioned into a set of overlapping patches. For each patch, the local coupled 3T and 7T dictionaries are constructed by extracting the patches from a neighboring region from all aligned 3T and 7T images in the training set. In the training phase, we have both 3T and 7T MR images scanned from each training subject. Then, these two patch sets are mapped to the same space using multi-level CCA. Next, each input 3T MRI patch is sparsely represented by the 3T dictionary and then the obtained sparse coefficients are utilized to reconstruct the 7T patch with the corresponding 7T dictionary. Group sparsity is further utilized to maintain the consistency between neighboring patches. Such reconstruction is performed hierarchically with adaptive patch size. The experiments were performed on 10 subjects who had both 3T and 7T MR images. Experimental results demonstrate that our proposed method is capable of recovering rich structural details and outperforms other methods, including the sparse representation method and CCA method.
1 Introduction
Magnetic Resonance Imaging (MRI) is a noninvasive method of observing the human body without the use of surgery, harmful dyes or x-rays, making this approach widely used in medical imaging, as using MRIs can help to detect problems at early stages. High resolution MRI is always desirable in research and clinical practice, since it has smaller voxel size, which provides greater structural details. In contrast, low-resolution MRI is affected by partial volume effect, in which a voxel captures signals from multiple tissue types, resulting in fuzzy tissue boundaries. The introduction of ultra-high-field MR (7 Tesla (7T)) scanners have allowed for high resolution MRI scanning. In theory, the signal-to-noise ratio (SNR) should be almost linearly related to the magnetic field. For instance, the SNR of 7T should be 2.3 times of the SNR of 3T. Therefore, 7T MRI should provide images with higher resolution. In this regard, it has been shown that 7T MRI is more effective in the diagnosis of multiple sclerosis, cerebrovascular diseases, brain tumors, and degenerative diseases than 3T and 1.5T MRI [1].
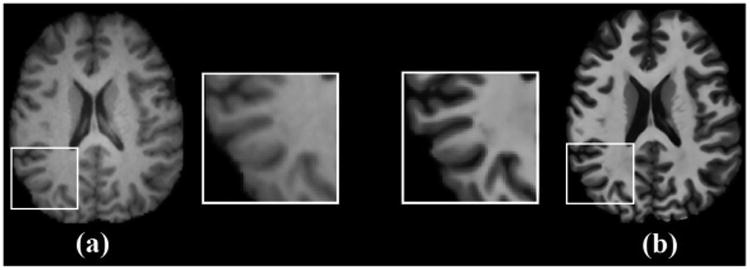
In Fig. 1, we show the axial views of 3T and 7T MR images acquired from the same subject, as well as a close-up view of the bottom-left part of the images. Compared to 3T, the 7T MRI shows much higher tissue contrast between the white matter and gray matter and clearer boundaries between cerebrospinal fluid (CSF) and gray matter. However, due to the low availability and higher prices for 7T scanners, accessibility to high-resolution 7T MRI is limited. For instance, there are approximately more than 20000 3T scanners in the world while there are only around 40 7T scanners [2]. Therefore, it is significant to predict 7T-like MR images from 3T MR images to help increase both the resolution and quality of these input 3T images. This motivates us to propose a method to reconstruct images of 7T from 3T MRI.
Fig. 1.

Axial views of (a) 3T MRI and (b) 7T MRI of the same subject, along with the zoomed regions. Better anatomical details could be observed in 7T MRI.
In the reconstruction of high-resolution (HR) from low-resolution (LR) images, most resolution enhancement methods can be categorized into motion-based and example-based. The motion-based methods use multiple observations [3,4], while example-based methods use the dictionaries of paired high and low resolution patches in a sparse representation framework [5,6]. Such methods have also been employed for resolution enhancement of MRI [7,8]. In this work, we follow the example-based methods based on sparse representation through incorporating the dictionary of 3T (LR) and 7T (HR) MR images. In such methods, it is assumed that the LR and HR images have similar distributions and high correlation. However, in general, such assumption may not be satisfied completely. To overcome this weakness, in human face super-resolution work [9], LR and HR images are mapped into canonical correlation analysis (CCA) space to increase the correlation of LR and HR images. However, the mapping with CCA only improves the correlation between all data pairs in 3T and 7T dictionaries, without considering the structure of input 3T patch in reconstructing 7T patch.
In this paper, we propose an extension of CCA called multi-level CCA to further improve the correlation of 3T and 7T dictionaries with respect to the input 3T patch. Our main contributions include: 1) We propose a novel common space called multi-level CCA space to increase the correlation of 3T and 7T dictionaries; 2) We incorporate the group sparsity in the multi-level CCA space to share the sparsity among the neighboring 3T patches for reliable and accurate 7T MRI reconstruction; 3) We propose a hierarchical patch-based reconstruction to reconstruct the overall structure of 7T MRI at the early stage and then the details at the final stage. To the best of our knowledge, this is the first work that has been proposed for the reconstruction of 7T MRI from 3T MRI. The rest of this paper is organized as follows. In Section 2, we introduce our proposed method. In Section 3, experimental results are provided. In Section 4, the conclusion of our paper is stated.
2 Proposed Method
Overview
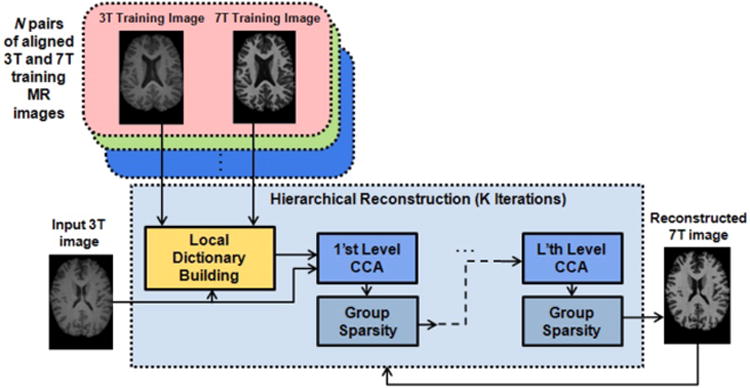
In this paper, we propose a hierarchical framework for the reconstruction of 7T MRI from 3T MRI based on group sparsity in multi-level CCA space, as shown in Fig. 2. First, the input 3T MRI is partitioned into overlapping patches. For each patch, the 3T and 7T local dictionaries are constructed from all subjects in the training set, each with both 3T and 7T MRI scans. Then, each 3T MRI patch is sparsely represented by the 3T local dictionary, while the obtained sparse coefficients are utilized to reconstruct the 7T patch with the corresponding 7T dictionary in multi-level CCA space. To do so, the similarity of sparse representation from nearby patches in the input 3T image is also enforced using group sparsity. Such reconstruction is achieved through adaptive patch size, by hierarchically reducing the patch size in multi-step iterations. The following sections provide detailed steps of our proposed method.
Fig. 2.

Proposed framework for reconstruction of 7T MRI from 3T MRI.
Local Dictionary Building
In this step, the goal is to build local 3T and 7T dictionaries for each patch of the input 3T MRI. The local 3T dictionary is used to sparsely represent the 3T patch in the input 3T MRI, while the local 7T dictionary is used for reconstruction of the corresponding 7T patch based on the estimated sparse coefficients.
Let y be a column vector representing a 3T patch of size m × m × m extracted from the input 3T MR image Y. We build the local 3T dictionary D3T and 7T dictionary D7T for y from the patches with the same location and immediate neighboring locations in all N pairs of aligned 3T and 7T training MR images from N training subjects. To build the local dictionaries, we define P to be a neighborhood search window size, in which the patches are extracted from each training (3T or 7T) image from N pairs of aligned images.
Multi-level CCA Representation
Followed by the generation of local dictionaries D3T and D7T, in this step the objective is to reconstruct the 7T patch x from the 3T input patch y using D3T and D7T. In the example-based methods [5], y can be sparsely represented with respect to D3T via
| (1) |
where α is the column vector of the sparse coefficients. Then, the estimated coefficients α can be utilized to reconstruct the 7T patch x using D7T, as follows
| (2) |
However, the sparse representation in the spatial domain assumes that there is a high correlation between the paired 3T and 7T image patches, which may not be completely satisfying in practice. Instead, we use the sparse representation in the CCA space. Generally, CCA is used to find the basis vectors for two sets of variables such that the correlation between the projections of these two sets of variables is maximized [9]. Here, for the two dictionaries D3T and D7T, we incorporate CCA to obtain two basis vectors b3T and b7T such that the correlation of D3T and D7T in CCA space (i.e., between b3T D3T and b7T D7T) is maximized. Then, the 3T patch y is also projected into CCA subspace using the base vector b3T. In the CCA subspace, we sparsely represent y with respect to D3T by modifying Eq.(1) as
| (3) |
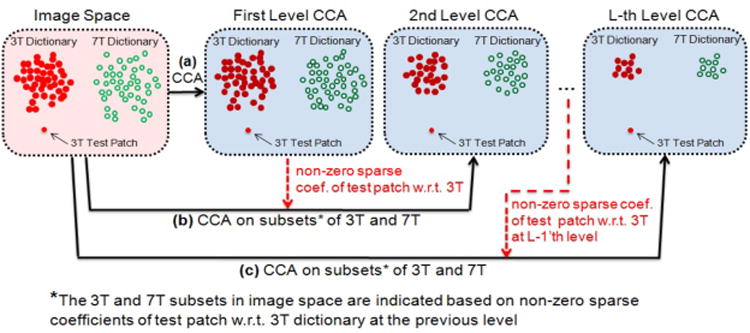
Although CCA improves the correlation between all pairs of patches in 3T and 7T dictionaries, it does not consider the structure of the input 3T patch in reconstructing 7T patch. To address this limitation, we propose an extension of CCA, called multi-level CCA, as shown in Fig. 3, to further improve the correlation based on the input 3T patch.
Fig. 3.

The multi-level CCA. (a) CCA, (b) 2nd level CCA, and (c) L-th level CCA.
In Fig. 3, suppose the red filled circles and green unfilled circles correspond to the elements of 3T and 7T local dictionaries in image space. In the first level, after CCA projection, the input 3T patch is sparsely represented using 3T dictionary in CCA space using Eq.(3). In such representation, the non-zero sparse coefficients show the most important part of the 3T dictionary in representation of the input 3T patch. In the 2nd level, instead of using the whole 3T and 7T dictionaries, a subset of 3T dictionary, with elements corresponding to the non-zero coefficients, is transformed from the image space into the CCA space together with the corresponding subset of 7T dictionary (Fig. 3(b)). Then, the input 3T patch is sparsely represented using this subset of 3T dictionary in CCA space using Eq.(3). With this data-driven dictionary refinement, the prediction using the learned reconstruction coefficients is more effective in the next level of representation. This process can be done in L levels to further improve the sparse representation of the input 3T patch. At each level, followed by the sparsely representation of y with respect to D3T using Eq.(3), the non-zero sparse coefficients, which indicate the most important patches of 3T and 7T dictionaries to be mapped from image space to the CCA space in the next level.
Group Sparse Regularization
In the multi-level CCA space, instead of sparse representation of a single 3T patch, we incorporate the group sparsity using neighboring 3T patches in order to share the same sparsity to make the local structure consistent for the reconstructed patches. We refer the current input 3T patch and its G immediately neighboring patches as a group. Besides solving the sparse representation for the current patch, we simultaneously solve the sparse representation for G neighboring patches, to construct the sparse coefficients for the entire group. We reformulate the Eq.(3) to have multi-level CCA using group sparsity as below
| (4) |
where A = [α1, …αG+1] is a matrix where each column includes the sparse coefficients of a patch in the group, and D3T,i, yi, and αi denote the local 3T dictionary, 3T input patch, and sparse coefficient vector of the i-th patch in the group, respectively. The first term is the multi-task least square minimizer for all G + 1 neighboring patches. The second term is the regularization term, which is a combination of L1 and L2 norms. The L2 norm is imposed to each row of A to make the neighboring patches have similar sparsity, while the L1 norm is imposed to the all rows of A to ensure the sparsity.
Hierarchical Reconstruction
Using our proposed method based on group sparsity in multi-level CCA space, each patch of 7T image can be reconstructed from 3T patch. However, in the reconstruction of 7T patches, choosing the appropriate size of patches is very important. If we choose small patch sizes, the patches can capture the details, but the final reconstructed 7T image can be very noisy. In contrast, by choosing large patch sizes, the patches can capture the whole structure, but the result can be blurry. To overcame this problem, we propose an adaptive patch size. Starting from a large patch size, we hierarchically decrease the patch size in multi-iterations. In such case, in the first iteration the whole structure is estimated by reconstructing the initial 7T image, while in the next iterations by decreasing the patch size the image details are gradually recovered by hierarchical reconstruction of 7T image, as explained bellow.
• First Iteration: Reconstruction of Initial 7T Image. First, Eq.(4) is incorporated to represent each input 3T patch y using the local dictionary D3T to estimate sparse coefficients. Using the estimated sparse coefficients, the corresponding 7T patch x is estimated. Then, the whole 7T image is reconstructed by taking the average of all reconstructed 7T patches if they are overlapped.
-
• The 2nd … K-th iterations: Hierarchical reconstruction of 7T image. Using the reconstructed 7T image in the first iteration, in the 2nd to K-th iterations, we propose Eq.(5) by adding a regularization term to Eq.(4) as
where k = {2, …, K} denotes the iteration number and is a patch from the reconstructed 7T image from the previous iteration k – 1. The first and second terms are as explained for Eq.(4), and the last term is the penalty term, which is proposed to ensure that there is consistency between iterations.(5) After estimating 7T-like patches in the CCA space, we use the inverse of base vector b7T to transform the 7T-like patches to the image space.
3 Experimental Results
We evaluated the performance of our proposed method with the related works including the sparse representation in image space [5] and the sparse representation in CCA space [9].
Data and Preprocessing
We recruited 10 volunteers (4M/6F) for this study with ages between 30 ± 8 years. Of these 10 volunteers, 5 subjects were healthy and 5 subjects were patient with epilepsy. They were scanned using both a 3T Siemens Trio scanner and a 7T Siemens scanner. For each subject, the 3T and 7T images were rigidly aligned together, followed by a skull stripping to remove the non-brain tissues. The resolutions of 3T and 7T images are 1 × 1 × 1 mm3 and 0.65 × 0.65 × 0.65 mm3, respectively.
Experiment Settings
To evaluate our proposed method, a leave-one-out cross-validation strategy is adopted by considering one image for testing and the rest of the images for training. We consider 2 levels CCA (L = 2). For the group sparsity, we consider 6 neighborhoods (G = 6) for each input 3T patch. We set λ1 = 0.1 and λ2 = 0.01. For the hierarchical reconstruction, we use 3 iterations (K = 3) where the patch size (m × m × m) is adaptively changed from 9 × 9 × 9, 5 × 5 × 5 to 3 × 3 × 3. Similarly, neighborhood size P for dictionary is set to 13 × 13 × 13, 7 × 7 × 7 and 5 × 5 × 5, respectively. To select these parameters, we evaluated our proposed method for different parameter values in cross validation. In all iterations, we consider the overlap of 1 voxel between the adjacent patches.
Visual Inspection
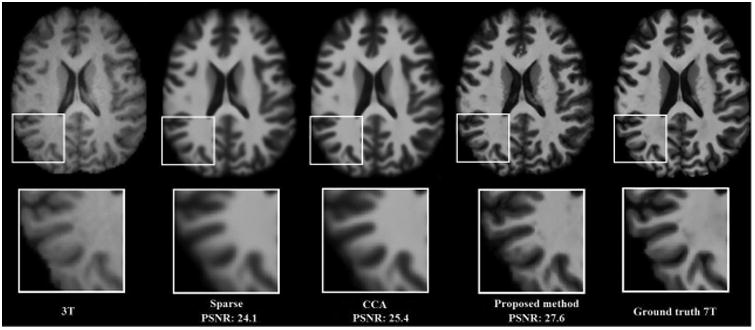
Fig. 4 compares the reconstructed 7T-like MRI based on different methods. Top row shows the axial views of the reconstructed 7T-like images for a subject by different methods, and the bottom row shows the close-up views of the bottom-left part of the reconstructed 7T-like images. Compared to the previous methods, the reconstructed 7T-like image by our proposed method is closer to the 7T ground truth on the right of Fig. 4. Also, it contains much more details while the other two results lack clarity.
Fig. 4.

Visual comparison of the reconstructed 7T-like images based on sparse representation [5], CCA based sparse representation [9] and our proposed method.
Quantitative Evaluation
We evaluate our proposed method by comparing the reconstructed 7T-like image with the ground truth 7T image of the same subject. We adopt two measures, peak-signal-to-noise ratio (PSNR) and root mean square error (RMSE). Higher PSNR and lower RMSE indicate that the reconstructed images are much closer to the ground truth 7T image. Table 1 compares the reconstruction results of each subject by different methods. Also, the last row shows the averages of PSNR and RMSE for all 10 subjects. Compared to the previous methods, our proposed method has a much higher PSNR and a much lower RMSE for all 10 subjects.
Table 1.
Performance comparison of three methods in terms of PSNR and RMSE.
| (a) PSNR | (b) RMSE | ||||||
|---|---|---|---|---|---|---|---|
|
|
|
||||||
| Method | Sparse [5] | CCA [9] | Proposed | Method | Sparse [5] | CCA [9] | Proposed |
|
|
|
||||||
| Subject 1 | 22.6 | 24.2 | 26.1 | Subject 1 | 17.0 | 15.1 | 12.0 |
| Subject 2 | 24.8 | 26.4 | 27.7 | Subject 2 | 14.5 | 12.2 | 10.5 |
| Subject 3 | 23.3 | 24.3 | 26.3 | Subject 3 | 17.3 | 15.5 | 12.3 |
| Subject 4 | 24.8 | 25.7 | 27.3 | Subject 4 | 14.5 | 13.1 | 11.0 |
| Subject 5 | 25.6 | 26.4 | 28.1 | Subject 5 | 13.4 | 12.2 | 10.1 |
| Subject 6 | 25.2 | 26.2 | 27.9 | Subject 6 | 13.9 | 12.4 | 10.2 |
| Subject 7 | 25.6 | 27.1 | 29.0 | Subject 7 | 13.3 | 11.2 | 9.0 |
| Subject 8 | 24.9 | 26.2 | 28.0 | Subject 8 | 14.5 | 12.5 | 10.1 |
| Subject 9 | 22.4 | 23.4 | 24.9 | Subject 9 | 19.2 | 17.7 | 14.5 |
| Subject 10 | 24.1 | 26.0 | 29.1 | Subject 10 | 15.7 | 12.7 | 8.9 |
|
|
|
||||||
| Average | 24.3 | 25.5 | 27.4 | Average | 15.3 | 13.4 | 10.8 |
4 Conclusion and Discussion
In this work, we proposed a hierarchical framework for reconstruction of 7T-like MR image from 3T MR image based on group sparsity in multi-level Canonical Correlation Analysis (CCA) space. The experiments performed on 10 subjects using 3T and 7T MR images demonstrate that our proposed method is capable of recovering more structural details and outperforms previous methods such as sparse representation in image space and CCA space. In future works, we will perform more experiments to further evaluate the influence of the proposed 7T-like reconstruction on subsequent image processing such as brain tissue segmentation.
References
- 1.Kolka AG, Hendriksea J, Zwanenburg JJM, Vissera F, Luijtena PR. Clinical applications of 7T MRI in the brain. Eur Jour of Radiology. 2013;82:708–718. doi: 10.1016/j.ejrad.2011.07.007. [DOI] [PubMed] [Google Scholar]
- 2.DOTmed Daily News. 2012 http://www.dotmed.com/news/story/17820.
- 3.Tian J, Ma K. A survey on super-resolution imaging. Signal Image Video Process. 2011;5(3):329–342. [Google Scholar]
- 4.Farsiu S, Robinson MD, Elad M, Milanfar P. Fast and robust multiframe super resolution. IEEE Trans Image Process. 2004;13(10):1327–1344. doi: 10.1109/tip.2004.834669. [DOI] [PubMed] [Google Scholar]
- 5.Yang J, Wright J, Huang TS, Ma Y. Image super-resolution via sparse representation. IEEE Trans Image Process. 2010;19(11):2861–2873. doi: 10.1109/TIP.2010.2050625. [DOI] [PubMed] [Google Scholar]
- 6.Freeman WT, Jones TR, Pasztor EC. Example-based superresolution. IEEE Comput Graphics Appl. 2002;22(2):56–65. [Google Scholar]
- 7.Shilling RZ, Robbie TQ, Bailloeul T, Mewes K, Mersereau RM, Brummer ME. A super-resolution framework for 3-D high-resolution and high-contrast imaging using 2-D multislice MRI. IEEE Trans Med Imaging. 2009;28(5):633–644. doi: 10.1109/TMI.2008.2007348. [DOI] [PubMed] [Google Scholar]
- 8.Rueda A, Malpica N, Romero E. Single-image super-resolution of brain MR images using overcomplete dictionaries. Med Image Anal. 2013;17:113–132. doi: 10.1016/j.media.2012.09.003. [DOI] [PubMed] [Google Scholar]
- 9.Huang H, He H, Fan X, Zhang J. Super-resolution of human face image using canonical correlation analysis. Pattern Recognition. 2010;43:2532–2543. [Google Scholar]


