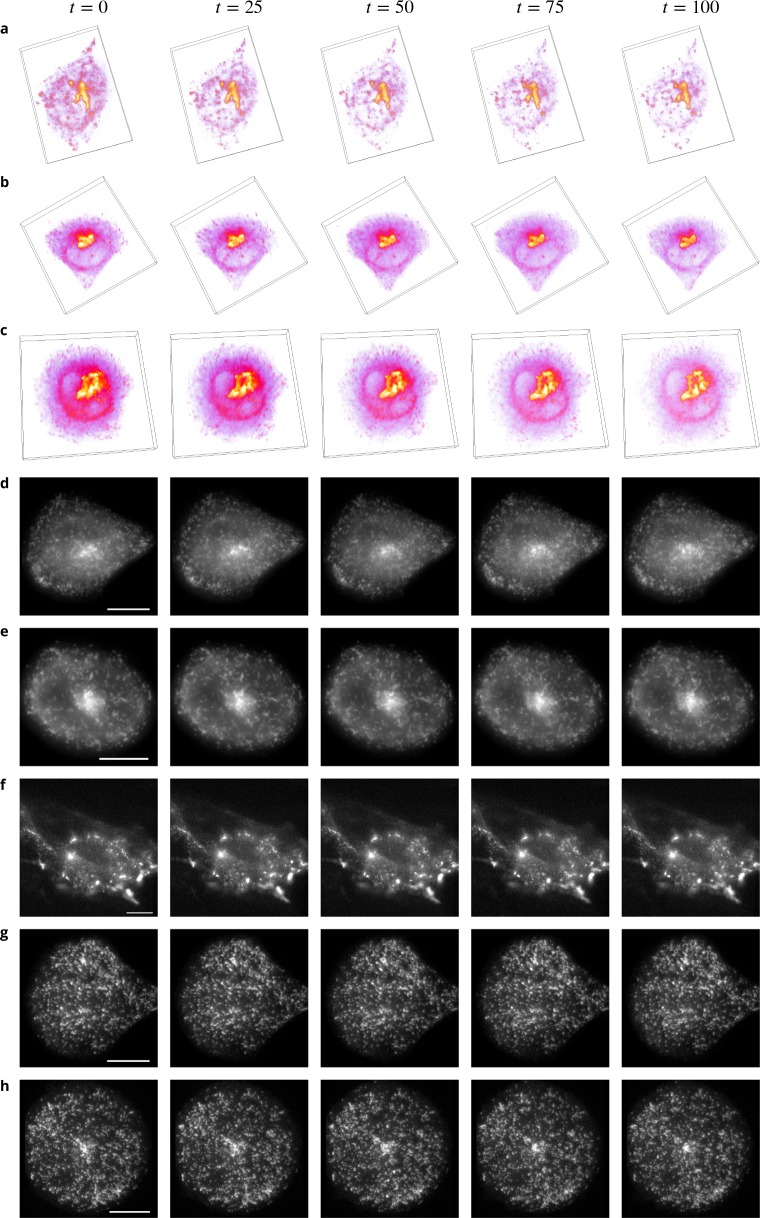
Appendix 1—figure 1. Example images from the datasets.
(a-c) Volume renderings of fluorescent images taken from three sequences showing Rab6 proteins in an unconstrained (a), a crossbow- (b) and a disk- (c) shaped cell. (d–e) Fluorescent images taken from two sequences showing Rab11 proteins in a crossbow- (d) and a disk- (e) shaped cell. (f–h) Fluorescent images taken from three sequences showing Rab11 proteins treated with Latrunculin A in an unconstrained (f), a crossbow- (g) and a disk- (h) shaped cell. In Figs d–h, the intensity over the planes is averaged, a gamma correction is applied for a better visualization and the scale bars correspond to 5 m.

