Abstract
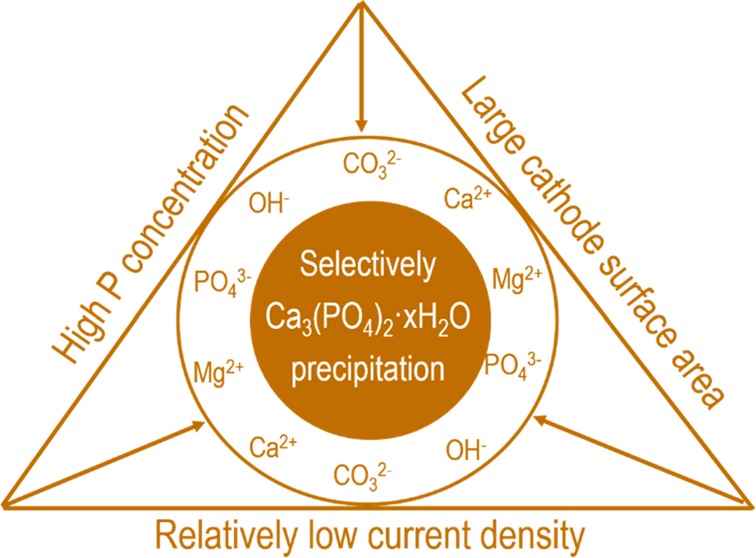
Electrochemical wastewater treatment can induce calcium phosphate precipitation on the cathode surface. This provides a simple yet efficient way for extracting phosphorus from municipal wastewater without dosing chemicals. However, the precipitation of amorphous calcium phosphate (ACP) is accompanied by the precipitation of calcite (CaCO3) and brucite (Mg(OH)2). To increase the content of ACP in the products, it is essential to understand the precipitation sequence of ACP, calcite, and brucite in electrochemical wastewater treatment. Given the fact that calcium phosphate (i.e., hydroxyapatite) has the lowest thermodynamic solubility product and highest saturation index in the wastewater, it has the potential to precipitate first. However, this is not observed in electrochemical phosphate recovery from raw wastewater, which is probably because of the very high Ca/P molar ratio (7.5) and high bicarbonate concentration in the wastewater resulting in formation of calcite. In the case of decreased Ca/P molar ratio (1.77) by spiking external phosphate, most of the removed Ca in the wastewater was used for ACP formation instead of calcite. The formation of of brucite, however, was only affected when the current density was decreased or the size of cathode was changed. Overall, the removal of Ca and Mg is much more affected by current density than the surface area of cathode, whereas for P removal, the reverse is true. Because of these dependencies, though there is no definite precipitation sequence among ACP, calcite, and brucite, it is still possible to influence the precipitation degree of these species by relatively low current density and high surface area or by targeting phosphorus-rich wastewaters.
Introduction
Municipal wastewater is a significant source of contaminants but can be an important source of nutrients as well, i.e., phosphorus (P).1−3 P often is considered to be the principal stimulant of eutrophication. However, it is also a limited and essential resource.4 To bridge the gap of P being too much as a pollutant and too little as a resource, it is suggested to remove and reuse P from wastewater.4,5
Phosphate can be removed from the wastewater by precipitation as useful P products, such as struvite (MgNH4PO4·6H2O) and calcium phosphate.6−9 The most stable phase of calcium phosphate is hydroxyapatite (Ca5(PO4)3OH, HAP), which owns the highest Ca/P molar ratio (1.67).10 The typical Ca concentration in domestic wastewater is 20–120 mg/L,11 whereas the P-PO4 concentration varies from less than 1.0 mg/L (effluent) to 10 mg/L (influent). The P in the downstream wastewater from an anaerobic digestion system can be even higher.12 In most cases, the aqueous Ca concentration is high enough to precipitate the coexisting phosphate in the wastewater.
However, to achieve efficient precipitation, the wastewater pH needs to be raised above 10.13,14 The most simple way of increasing wastewater pH is adding sodium hydroxide.15,16 However, this method has some drawbacks. First, the products achieved by conventional chemical precipitation have poor settle ability. Moreover, after precipitation the pH of wastewater needs to be reduced by dosing acid, as the typical pH (>10) required for chemical precipitation is higher than the discharge standard (6 < pH < 9).
Electrochemical induced calcium phosphate precipitation opens door for avoiding such problems. In electrochemical systems, a local high pH near cathode can be achieved by water electrolysis,14,17,18 as shown in eq 1:
| 1 |
The formation of OH– ions will create pH gradients between the cathode and the bulk solution. While the pH gradients are not wanted in most electrochemical systems,17 in terms of calcium phosphate precipitation, the high local pH can be very useful. As is well-known, the solution pH plays a crucial role in the precipitation of calcium phosphate.9,19 Moreover, the solubility of calcium phosphate minerals is pH-dependent, and a high pH usually means high thermodynamic driving force for calcium phosphate precipitation.19
| 2 |
In the electrochemical system, although the local pH is increased, the change of pH in bulk solution is small. This is because equal numbers of H+ and OH– are produced at the anode and cathode, respectively (eqs 1 and 2). Moreover, the presence of buffers such as inorganic carbon in wastewater may contribute to a stable bulk solution pH.20 Hence, a postreduction of pH of bulk solution is not needed. Furthermore, as the precipitation only takes place in the vicinity of the cathode and the formed precipitates can easily be collected from the cathode,14 a postseparation of precipitates from the bulk solution is avoided as well. Therefore, in principle, P can be removed and separated simultaneously from the wastewater without dosing chemicals in the electrochemical system.
Proof of principle of electrochemical induced phosphate precipitation has been demonstrated by using well-defined solutions for both struvite21 and calcium phosphate.14 Our previous study indicated that P could precipitate as calcium phosphate on cathode in a wide pH range, even under acidic conditions (i.e., pH 4.0).14 The effects of essential operation conditions and water matrices on this process were studied as well.20,22 It was found that the presence of natural organic matter is beneficial to the removal of P.22 However, the efficiency of this system in raw wastewater is not fully addressed yet.
Given the complexity of wastewater composition, it is likely more than calcium phosphate will precipitate. To reduce the formation of unwanted species, we need to understand the precipitation mechanism, not only of calcium phosphate but also of associated byproducts. Particularly, the relative precipitation tendency among products and byproducts is of great importance. If such precipitation sequence exists, we may be able to selectively precipitate P. In case of simultaneous precipitation and the absence of a precipitation sequence, pretreatment may be needed.
The objective of this study is to evaluate the performance of electrochemical P removal and recovery in raw wastewater. Specifically, we focus on understanding the precipitation sequence of all possible solids that may precipitate in the wastewater, which can be important in preventing or reducing the formation of unwanted byproducts and recovering P as useful products.
Materials and Methods
Materials
The anode was Pt coated Ti disc (ϕ 80 mm, thickness 1 mm). Square Ti plate with sizes of 6 × 6 cm2, 4 × 4 cm2, and 2 × 2 cm2 were used as the cathode. The anode and the cathode were perpendicularly welded to a Pt-coated Ti rod and pure Ti rod (ϕ 3 mm, length 120 mm), respectively. Both electrodes were acquired from MAGNETO Special Anodes BV (Schiedam, The Netherlands).
Wastewater Sampling and Processing
Raw domestic wastewater was collected from the influent of a local wastewater treatment plant (Leeuwarden, The Netherlands). After sampling, all the wastewater was physically filtered through a combined sieve filter (325 μm) and stored in a 4 °C fridge.
Wastewater Electrolysis
An undivided glass type electrochemical cell with a volume of 1.0 L was used for all experiments. The electrodes were horizontally located, with the anode at the top and the cathode at the bottom of the cell. The distance between electrodes was 30 mm. Unless specified otherwise, the electrolysis current was held constant at 8.3 A m–2 using a power supply (ES 015-10, Delta Electronika, The Netherlands). After each test, the cathode was removed and dried in air at room temperature for 1 day. The next day, the precipitates on the electrode surface were collected by light scraping, and then the cathode was cleaned by immersion into acidic solution (1.0 M HNO3) for another day. After acid washing, the cathode was rinsed with deionized water. The anode was also cleaned by acid weekly.
Analytical Methods
The concentration of cations (Na+, NH4+) and anions (SO42– Cl–, NO3–) were measured using ion chromatography (Compact IC 761, Metrohm). Concentrations of Ca, Mg, K, and P were quantified by ICP-AES. Inorganic carbon and total organic carbon (TOC) concentration were accessed by a TOC analyzer (Shimadzu). Given that 98% of the inorganic carbon was present as bicarbonate at pH 8.0 (see Figure S1), the initial concentration of bicarbonate was expressed as inorganic carbon concentration. The wastewater pH was measured by a daily calibrated pH meter (Metter Toledo). The morphologies of precipitates and the corresponding element composition were characterized by scanning electron microscopy (SEM, JEOL-6480LV) combined with energy dispersive spectroscopy (EDS, Oxford Instruments). The samples for SEM-EDS analysis were coated with gold and detected using carbon film as the background. Because of this, the carbon and gold contents were excluded from the element composition. The solid phases of precipitates were analyzed by X-ray diffraction (XRD, Bruker). The phase quantification of solid species in the precipitates was acquired by using HighScore Plus program.
Calculations
We used Visual MINTEQ 3.1 (available at https://vminteqlwr.kth.se/download/) and Hydra-Medusa (available at https://www.kth.se/che/medusa/) to calculate the supersaturation index (SI) of potential precipitates and the fractions of Ca, Mg, P, and N in the wastewater versus pH, respectively. The SI is defined as eq 3:
| 3 |
where IAP and Ksp refer to the ion activity of the associated lattice ions and the thermodynamic solubility product, respectively.
Results and Discussion
Thermodynamic Insights
We previously confirmed that the electrochemical induced calcium phosphate precipitation was due to the high pH near the cathode surface.14 While the local pH was not recorded, we assumed the local pH near the cathode could range from the bulk solution pH 8.0 to as high as 12.0. Such a high local pH was recorded in a biofilm by using a micro pH sensor.18 Based on the wastewater composition (Table S1), at least 16 precipitates including calcium phosphate, magnesium precipitates, and carbonate precipitates may form and precipitate from the wastewater in response to high local pH, as indicated by the SI of these species (Table 1). It should be noted that for the calculations of SI and ion fractions the organic contents were not considered. However, it is worth mentioning the formation of struvite is not favorable according to the thermodynamic calculations, as struvite is undersaturated (SI < 0, Table S2). Therefore, P removal and recovery as struvite probably is not feasible in raw municipal wastewater without dosing external Mg and/or phosphate.
Table 1. Supersaturation Index (SI) of Potential Precipitates in the Raw Wastewater in Response to Different Bulk Solution pH of 8–12a.
| pH |
||||||
|---|---|---|---|---|---|---|
| mineral | formula | 8 | 9 | 10 | 11 | 12 |
| ACC | CaCO3·xH2O | –0.3 | 0.6 | 1.0 | 1.0 | 1.0 |
| vaterite | CaCO3 | 0.5 | 1.3 | 1.7 | 1.8 | 1.8 |
| aragonite | CaCO3 | 0.9 | 1.8 | 2.2 | 2.2 | 2.2 |
| calcite | CaCO3 | 1.1 | 1.9 | 2.3 | 2.4 | 2.4 |
| ACP (am 1) | Ca3(PO4)2 | –0.7 | 0.9 | 1.3 | 1.4 | 1.4 |
| ACP (am 2) | Ca3(PO4)2 | 2.1 | 3.6 | 4.1 | 4.2 | 4.2 |
| TCP | Ca3(PO4)2 | 2.9 | 4.4 | 4.8 | 4.9 | 4.9 |
| OCP | Ca4H(PO4)3·3H2O | 2.3 | 3.6 | 3.4 | 2.7 | 1.7 |
| hydroxyapatite | Ca5(PO4)3 (OH) | 11.7 | 14.9 | 16.4 | 17.4 | 18.4 |
| brucite | Mg(OH)2 | –4.4 | –2.5 | –0.7 | 1.1 | 2.9 |
| artinite | Mg2(OH)2CO3·3H2O | –4.6 | –1.7 | 0.6 | 2.5 | 4.1 |
| magnesite | MgCO3 | –0.2 | 0.7 | 1.3 | 1.4 | 1.2 |
| hydromagnesite | Mg5(CO3)(OH)2·4H2O | –9.2 | –3.6 | 0.3 | 2.5 | 3.4 |
| dolomiteb | CaMg(CO3)2 | 1.4 | 3.2 | 4.1 | 4.3 | 4.1 |
| dolomitec | CaMg(CO3)2 | 2.0 | 3.8 | 4.7 | 4.9 | 4.6 |
| huntite | Mg3Ca(CO3)4 | –0.5 | 3.1 | 5.1 | 5.5 | 4.9 |
ACC: amorphous calcium carbonate; ACP: amorphous calcium phosphate; TCP: tricalcium phosphate; OCP: octacalcium phosphate.
Ordered.
Disordered.
Among these possible precipitates, amorphous calcium phosphate (ACP), beta tricalcium phosphate, octacalcium phosphate, and HAP can contribute to the removal of P. The other precipitates including calcium carbonate, magnesium carbonate, brucite, and dolomite may form as byproducts but will not result in the direct removal of P. However, these potential precipitates may still contribute to the removal of P indirectly, either as adsorbents, coagulants, or seeds.
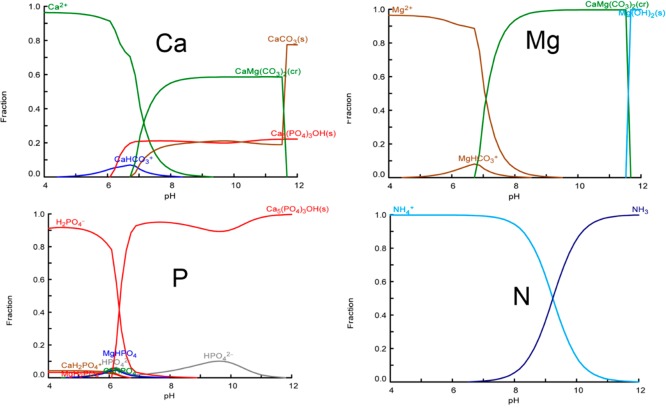
For the ions that may be involved in the precipitates, the fraction of these ions was calculated with respect to solution pH (Figure 1). Overall, the fractions’ distribution suggests that struvite will not be formed. Nitrogen is present either as NH4+ or as soluble NH3. Magnesium is present as free Mg2+, magnesium carbonate, dolomite, and brucite, with the last being formed when the pH is higher than 10. Similarly, Ca is present in both phosphate and carbonate salts. For P, the calculation indicates that P will precipitate as HAP completely when the solution pH is above 7.0. The Ca/P molar ratio in the wastewater is 7.5, which is much higher than the required ratio (1.67). This indicates that the Ca in the wastewater is high enough to precipitate with the P in the wastewater. However, it should be mentioned that the fraction calculations refer to thermodynamic equilibrium conditions of the potential species. Kinetically, the metastable intermediate phases (i.e., ACP) may form as well. To verify the theoretical calculations, batch experiments were performed.
Figure 1.
Fractions of Ca, P, Mg, and N with respect to varied solution pH (4.0–12), calculated with using Hydra-Medusa software. Input was based on the main wastewater composition: [Ca2+] = 1.87 mM; [Mg2+] = 1.10 mM; [NH4+] = 3.06 mM; [K+] = 0.60 mM; [HPO42–] = 0.25 mM; [HCO3–] = 11.45 mM; [SO42–] = 0.31 mM; [Cl–] = 9.51 mM.
Proof of Principles
As can be seen from Figure 2A, there is no P removal/precipitation in open circuit in 24 h, though the solution is supersaturated for ACP (SIACP2 = 2.1) and HAP (SIHAP = 11.7) at pH 8.0. This indicates that the driving force for precipitation from the bulk solution is not able to induce phosphate precipitation (form nuclei) in the wastewater. This also applies to calcium carbonate and dolomite. Both are saturated in the wastewater but do not precipitate. However, in the closed circuit (8.3 A m–2), 46.5% P was removed from the wastewater in 24 h, accompanied by the removal of inorganic carbon (24.3%), Ca (42.2%), and Mg (24.3%). In principle, both Mg and Ca can form precipitates with phosphate ions. However, the thermodynamic calculations suggest that Mg3(PO4)2 and MgHPO4·3H2O formation is not feasible in our system (SI < 0, Table S2). Therefore, the removal of Mg did not result in the removal of P. In our system, the only way for direct P removal is calcium phosphate formation and precipitation, as either amorphous phase or crystalline solids or a mixture of both. The removal of Mg relates to dolomite, huntite, magnesite, and brucite, while the formation of the last one requires a pH higher than 10, according to the thermodynamic and fraction calculations (see Table S2 and Figure 1). Based on the precipitation pathway of Ca and Mg, the removal of inorganic carbon is due to calcium carbonate and magnesium carbonate formation. However, according to the mass balance calculation, the absolute amount of removed inorganic carbon (2.86 ± 0.15 mM) cannot be balanced by the removed Ca (0.83 ± 0.05 mM) and Mg (0.44 ± 0.01 mM). This suggests that the removal of inorganic carbon may result from other reactions. Indeed, inorganic carbon could also be removed by gas stripping in our system due to H2 and O2 production. Moreover, the local low pH (eq 2) near the anode might allow CO2 production (eq 4) which could also contribute to the removal of inorganic carbon.23
| 4 |
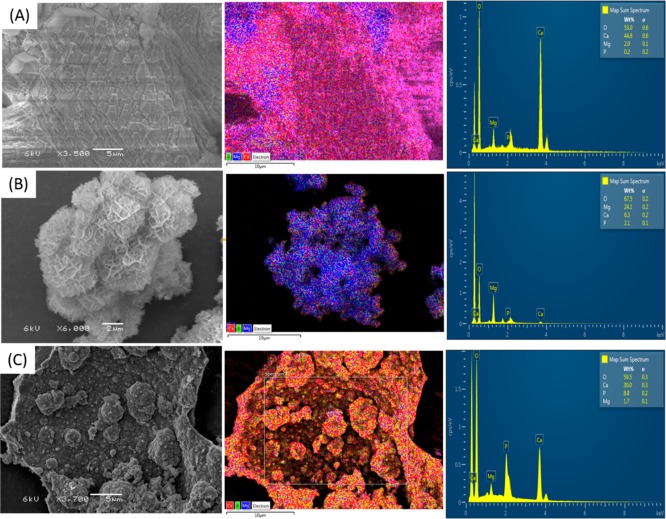
To further clarify the removal mechanism of Ca, Mg, P, and inorganic carbon, it is crucial to quantify the species in the precipitates. Therefore, the recovered products were subjected to SEM-EDS and XRD analysis. From SEM images, we find three types of morphologies. The irregular rhombohedral (Figure 3A) shape is one of the typical morphologies for calcium carbonate.24,25 EDS analysis reveals the relative Ca content (%) in this type of morphology accounts for 34.7% whereas Mg and P only account for 5.3% and 0.6%, respectively. The lamella-like shapes (Figure 3B) are most seen for magnesium salts. Indeed, the associated EDS data highlight Mg as the second richest element (24.1%), followed by Ca (6.3%) and P (2.1%). The spherical shape (Figure 3C) is probably connected with ACP that we have seen in our previous study.14 Again, this is supported by the relevant element distribution. The spherical shape consists of 30% Ca, 8.8% P, and negligible Mg (1.7%). The variation of element distributions in the three morphologies suggests the presence of different dominant species. The phases of the solids were further characterized by XRD. The XRD pattern of the precipitates matches with references for calcite and brucite (Figure 2B). However, we did not find any sharp peaks for HAP or any other crystalline calcium phosphate. The lack of definite calcium phosphate patterns may be because calcium and phosphate precipitated mainly as ACP which cannot be identified by XRD. Indeed, the broad peak around 30° can be an indication for ACP. The sample was therefore heated at 600 °C for 1 h and then subjected to XRD analysis again. During the heating treatment, the amorphous phase may transfer to the crystalline phase. Indeed, after the heating procedure, as shown in Figure 2C, the broad peak around 30° disappeared. Instead, new sharp peaks were observed. These newly appeared sharp peaks match with reference HAP. Also, patterns of CaO and MgO can be found. Under heating treatment, CaCO3 and Mg(OH)2 may decompose to CaO and MgO, respectively. The formation of Ca(OH)2 might be due to the hydration of CaO during the XRD testing process.
Figure 2.
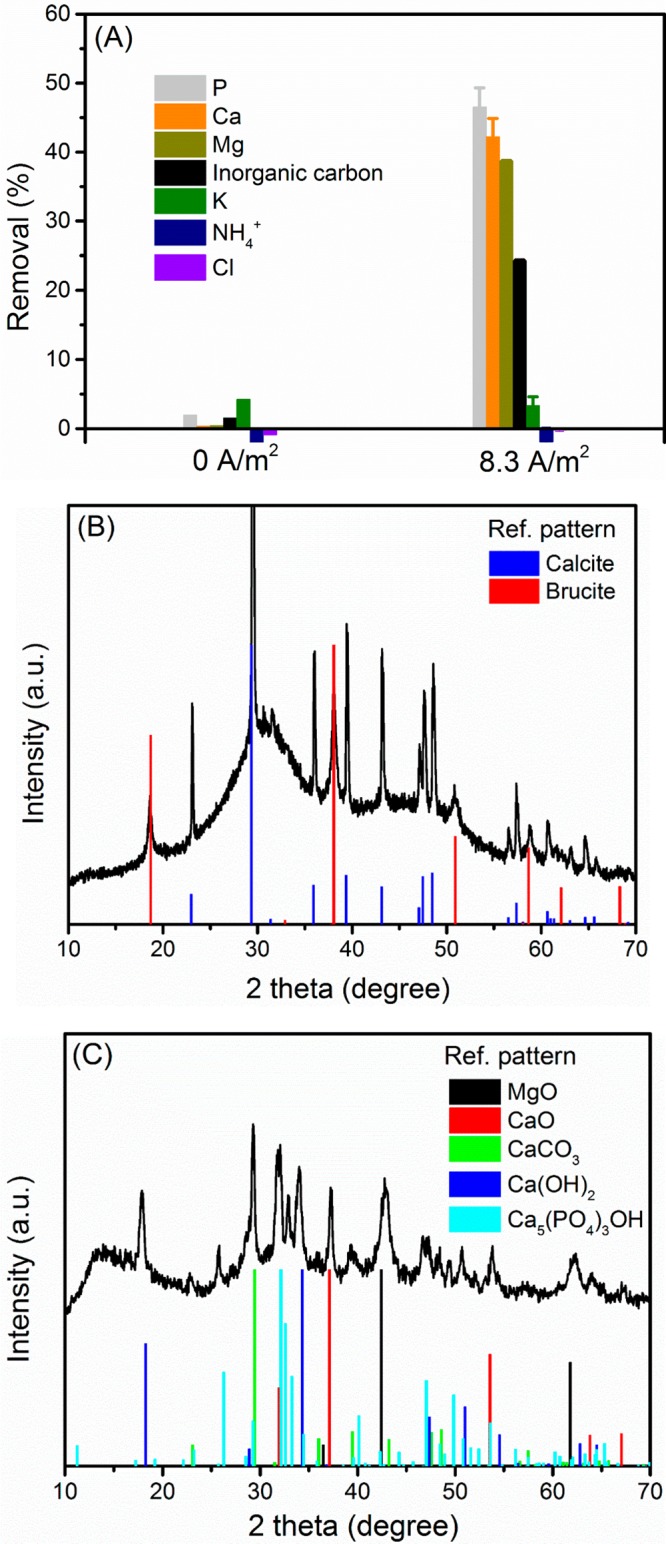
(A) Electrochemical treatment results in the removal of not only Ca and P ions but also Mg2+ and inorganic carbon. XRD pattern of the collected precipitates (B) before and (C) after heating treatment at 600 °C for 1 h. Conditions: electrolysis time = 24 h; current density = 8.3 A/m2; anode: Pt–Ti; cathode: Ti (36 cm2); electrode distance = 3 cm.
Figure 3.
SEM images indicate there are three types of morphology in the precipitates. Element analysis (EDS) reveals very different Ca, Mg, and P distribution in these morphologies. The irregular rhombohedral shape (A) has the highest Ca but negligible P and Mg, whereas the lamella-like shape (B) and the spherical shape (C) contain the highest Mg and P, respectively. Note the SEM image and the EDS mapping were performed at different voltage and spot size.
The concentration of NH4+ did not change over the electrolysis process (Figure 2A), again confirming the lack of struvite formation. This indeed is in accordance with the theoretical calculation that struvite formation is not thermodynamically feasible. It is also worth mentioning that the chloride concentration did not change (Figure 2A), indicating there is no chlorine gas production in our system. This is very important for the practical application. Chlorine, once produced, can lead to the formation of toxic chlorinated organic byproducts.26 The unchanged chloride concentration also explains the negligible ammonium reduction in the electrochemical treatment process. The primary mechanism of ammonium oxidation in electrochemical treatment is chlorination.26,27 Therefore, if there is no chlorine formation and in the absence of struvite formation, the direct anode oxidation of ammonium can be neglected, and therefore the ammonium concentration did not change.
To conclude, the solution chemistry together with the theoretical calculation and the characterization of the solids support the formation of three species including ACP, calcite, and brucite in the electrochemical wastewater treatment process.
Effects of Current Density
The electrochemical P precipitation and byproduct formation are induced by water electrolysis and, more specifically, the increase of pH near the cathode surface. The extent of pH increase is regulated by the current density. The current density in our system is defined by the ratio of current and the surface area of the cathode, and therefore it can be altered by changing either the applied current or the size of the cathode. When the cathode was fixed at 36 cm2, the removal of all ions increased with increasing the current density (Figure 4). The removal of P rose from 41.4% at 1.4 A m–2 to 46.5% at 8.3 A m–2 and further to 68.5% at 27.8 A m–2, all recorded in 24 h. The removal of Ca and removal of Mg in the three different current densities were 19.2%, 42.1%, and 61.9% and 10.8%, 38.7%, and 70.2%, respectively. Clearly, the increase of current density results in relatively more removal of Ca and Mg than P.
Figure 4.
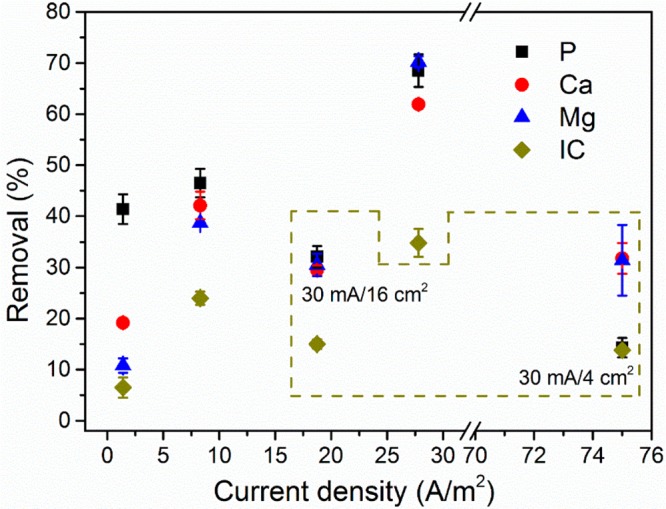
Effects of current and cathode surface area on ions removal in the electrochemical phosphorus recovery process. The circulated data were performed with using 16 and 4 cm2 cathode; the current was 30 mA. The rest was done with using typical 36 cm2 cathode; the current was 5, 30, and 100 mA. Conditions: electrolysis time = 24 h; anode: Pt–Ti; cathode: Ti; electrode distance = 3 cm.
When the surface area of the cathode was varied at fixed current, the removal of P increased with cathode size but decreased regarding current density. At the highest current density (30 mA, 4 cm2), only 14.3% P was removed. Such removal is even lower than with the lowest current density (1.4 A m–2) achieved at 5 mA using the regular 36 cm2 electrode. However, in contrast to P, the corresponding removal of Ca and Mg at 75 A m–2 is much higher than at 1.4 A m–2 and slightly lower than at 8.3 A m–2 (30 mA, 36 cm2) but close to the removal at 18.8 A m–2 (30 mA, 16 cm2).
It seems that the removal of Mg and Ca is more affected by the current density but for P, it is more affected by the cathode size. In an electric field, typically, electromigration will drive anions and cations to anode and cathode, respectively. This means that the diffusion of cations (Ca2+ and Mg2+) and anions toward cathode may be enhanced and reduced, respectively. However, bicarbonate, as a buffer, tends to react with the produced OH– to lower the pH gradients (eq 5).17
| 5 |
Therefore, carbonate may still be enriched near the cathode. Phosphate might behave similarly, but their concentrations may be too low to affect the local environment near the cathode. Therefore, the formation of calcium carbonate and magnesium hydroxide is still efficient at high current density even if the surface area is small, as the local pH and the availability of lattice ions are favorable. However, for calcium phosphate, the mass diffusion of P and the surface area of the cathode, instead of the local pH, are the limiting factors that govern its formation and precipitation. Indeed, we can see from Figure 4 that when the current was fixed at 30 mA, the removal of P increased from 14.3% (4 cm2, 75 A m–2) to 32.1% (16 cm2, 18.8 A m–2) and further to 46.5% (36 cm2, 8.3 A m–2). The P removal therefore correlated to the increase of the cathode surface area. Though the removal of P also increased with the current density when fixing the electrode area at 36 cm2 (Figure 4), this increase is small. For instance, the nearly 20 times increase of current density from 1.4 to 27.8 A m–2 only enhanced the removal percentage of P by 28.1%. It is therefore concluded that increasing cathode size is more efficient than increasing current density in improving the removal of P.
On top of the removal of ions, we checked the phases of precipitates at different current densities with XRD characterization. Regardless of the current density, the XRD patterns are dominated by calcite and brucite (Figure S2). This contrasts with our previous study using synthetic solutions which do not contain magnesium and carbonate. In that case, we found the calcium phosphate shifts from ACP to HAP with increasing current density.14 The difference may be caused by the coexisting Mg2+ and the organic matters in the domestic wastewater, which could inhibit the recrystallization of ACP to HAP.10,22,28
Precipitation Sequence
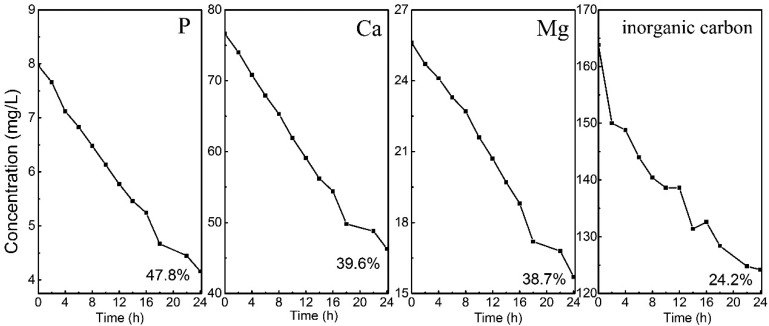
While the removal performance of P, Ca, and Mg with respect to current density and surface area was discussed, the underlying mechanism needs to be explored. From the point of resource recovery, calcium phosphate is the most interesting product. However, in practice, other solids including calcite and brucite precipitate as well. To make the electrochemical P recovery process more selective, it is necessary to understand the precipitation sequence of the solids. For this purpose, we monitored ion concentrations during the precipitation process. The concentrations of Ca, Mg, P, and inorganic carbon as a function of reaction time are shown in Figure 5. It is clear that these ions were removed simultaneously, suggesting there is no removal sequence for Ca, Mg, P and inorganic carbon.
Figure 5.
Change of ions concentration during electrochemical treatment. Conditions: electrolysis time = 24 h; current density = 8.3 A/m2; anode: Pt–Ti; cathode: Ti (36 cm2); electrode distance = 3 cm.
To explain the experimental data, it is essential to understand the driving force for the precipitation of salts. Typical precipitation reactions are driven by the concentration of lattice ions, pH, temperature and the thermodynamic ion activity product of the species.19 In our system, the precipitation temperature and pH are equal for all species. Then we need to consider the concentrations of lattice ions and the thermodynamic products.
Basically, Ca, Mg, P, OH– ions, and (bi)carbonate are involved in the precipitation process. Among these ions, P only has one main driving force toward the vicinity of the cathode where precipitation reaction happens, which is mass diffusion. However, for cations and (bi)carbonate, in addition to mass diffusion, electromigration and buffer reactions may also contribute to their diffusion to the cathode, respectively. Among the three-identified species, ACP (Ksp = 10–26)29 has much lower thermodynamic solubility product than calcite (Ksp = 10–9)24 and brucite (Ksp = 10–10.9).16 It should be noted that HAP (Ksp = 10–114)29 has the lowest thermodynamic solubility product. In addition, given the wastewater composition, HAP has the highest SI. For instance, at pH 10, the SI of HAP, calcite, and brucite are 16.4, 2.3, and −0.7, respectively (Table 1 and Table S2). Therefore, ACP, as the intermediate species during HAP formation, may precipitate first, but of course, this is subject to solution conditions. The problem is, however, the Ca/P molar ratio in the raw wastewater is too high. As a result, the P in the wastewater only uses a small amount of the Ca present, and therefore a lot Ca is still available for byproduct formation. This together with the fact that cations and carbonate can be enriched at the cathode surface explains the formation of Mg(OH)2 and CaCO3, giving simultaneous removal of all ions.
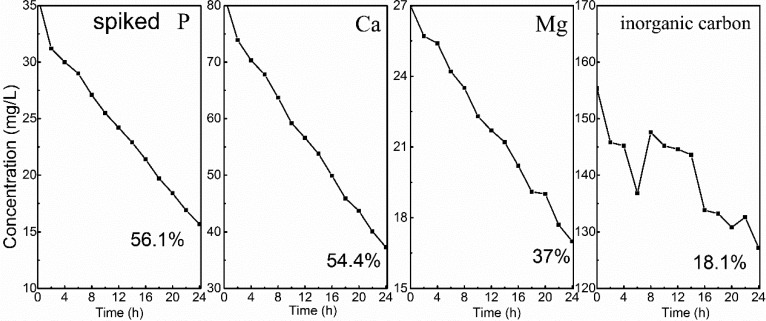
It seems that the low phosphate concentration opens the door for byproduct formation, especially for calcite. Actually, even with extra phosphate in the wastewater, the associated ions were still removed at the same time, as confirmed by the decrease of all ions concentration as a function of time (Figure 6). In the presence of 1.15 mM P, under same conditions, the removal of Ca and P increased by about 12%, reaching 54.4% (Ca) and 56.1% (P). The removal of Mg (37.0%) and inorganic carbon (18.1%) did not change a lot. While from the point of removal percentage, there is no significant difference in comparison to the case with low P concentration, the absolute amount of removed P is more significant, 0.648 (1.15 mM) vs 0.119 mM (0.25 mM). The corresponding Ca/P molar ratio in precipitates also dropped from 7.0 to 1.7. This indicates that much more Ca was used for P precipitation instead of carbonate precipitation with increased phosphate concentration. Still, the calcium phosphate appears as ACP, as inferred from its XRD pattern (Figure S3). No pattern for calcite and brucite can be found in the XRD spectra. This indicates that the increase of P concentration does inhibit the formation of calcite and brucite. Indeed, in response to the spike of extra P, the SI of calcium phosphate all increased whereas the SI of calcium carbonate decreased (Table S3). For instance, at pH 10, while the SI of ACP1 increased from 1.3 (0.25 mM P) to 2.4 (1.15 mM P), the SI of calcite decreased from 2.3 to 2.2. For brucite, it is not saturated in both conditions (SI < 0). The change of SI by increasing phosphate as to achieve a better stoichiometry favors the precipitation of calcium phosphate instead of calcium carbonate. In this way, the formation of calcite is inhibited dramatically. Therefore, if we deal with a specific type of wastewater (i.e., wastewater from food industry) that has high P concentration, we may be able to precipitate more calcium phosphate selectively. Figure S4 summarizes the preliminary results in electrochemical P recovery from food wastewater. In comparison to the domestic wastewater, the food wastewater has much high P (1.64 mM) but less Ca (1.34 mM). Because of the low Ca concentration, the removal of P was slightly lower: 32% (food wastewater) vs 46.5% (domestic wastewater). However, the absolute amount of recovered P is much higher: 0.53 mM vs 0.12 mM. This gives a Ca/P molar ratio of 1.1 in the recovered solids.
Figure 6.
Change of ions concentration during electrochemical treatment with spiking extra P in the wastewater. Conditions: electrolysis time = 24 h; current density = 8.3 A/m2; anode: Pt/Ti; cathode: Ti (36 cm2); electrode distance = 3 cm, [P] = 1.15 mM.
Still, the research question is whether P can be selectively precipitated in raw municipal wastewater at low concentration. As discussed, the formation of ACP occurs because of the lowest thermodynamic solubility product and the highest SI, whereas the precipitation of brucite and calcite is due to the high local pH and the high availability of lattice ions due to electromigration and buffer reactions. The local pH can be adjusted by the current density: the higher the current density, the higher the local pH. Besides, the electromigration of ions can be influenced by the current density as well. Consequently, at low current density, we may be able to reduce the formation of calcite and brucite. Indeed, as shown in Figure 4, at the lowest current density (1.4 A m–2), 41.4% P was removed, whereas only 19.2% Ca and 10.8% Mg were removed. By contrast, at the highest current density (75 A m–2), while 31.8% Ca and 31.4% Mg were removed, only 14.3% P was removed.
Clearly, although all ions do precipitate simultaneously, the extent of removed ions can be regulated by the applied current density. This gives direction for selectively precipitating calcium phosphate instead of precipitating all ions by increasing the cathode surface and by applying a relatively low current density. In conclusion, though there is no precise precipitation sequence in raw wastewater induced by electrolysis, it is still possible to selectively precipitate calcium phosphate and avoid/reduce the formation of byproducts by choosing suitable operating conditions.
Implications
Electrochemical induced phosphate precipitation was proven to be a feasible way to remove and recover P from real domestic wastewater in a lab-scale study. However, due to the complicated wastewater composition, both product and unwanted byproducts are formed. We showed in this paper that it is possible to selectively precipitate more calcium phosphate (product) than the byproducts. Moreover, the electrochemical P recovery is very adaptable to wastewater compositions. Our preliminary tests on food wastewater also demonstrate the possibility of electrochemical P recovery from other waste streams. For phosphorus-rich waste streams, selective precipitation of calcium phosphate will be even more possible, as we already showed in this study. One thing that we did not address here is that we found that the electrochemical P recovery also contributes to the removal of color, turbidity, and COD of wastewater. This will alleviate the burden of subsequent biological treatment. In addition, the produced O2 and H2 could also be used by the biological process. The remaining challenge, however, is how to integrate the electrochemical system with the conventional wastewater treatment process. Our ideal is to locate the electrochemical P recovery system in the wastewater treatment system. Our goal is to extract about 50% of the P from the influent and leave the rest 50% for biomass reproduction which will be removed by the excess sludge. On top of this, it is even possible to combine the electrochemical system with conventional biological wastewater treatment by developing a bioelectrochemical system, in which efficient wastewater treatment and phosphorus recovery can be achieved simultaneously.
Acknowledgments
This work was performed in the cooperation framework of Wetsus, European Centre of Excellence for Sustainable Water Technology (www.wetsus.eu). Wetsus is cofunded by the Dutch Ministry of Economic Affairs and Ministry of Infrastructure and Environment, the European Union Regional Development Fund, the Province of Fryslân, and the Northern Netherlands Provinces. This research has received funding from the European Union’s Horizon 2020 research and innovation programme under the Marie Skłodowska-Curie grant agreement No 665874. We are grateful to the participants of the research theme “Resource Recovery” for fruitful discussions and financial support.
Supporting Information Available
The Supporting Information is available free of charge on the ACS Publications website at DOI: 10.1021/acs.est.8b02869.
Figures S1–S4; Tables S1 and S2 (PDF)
The authors declare no competing financial interest.
Supplementary Material
References
- Bradford-Hartke Z.; Lane J.; Lant P.; Leslie G. Environmental Benefits and Burdens of Phosphorus Recovery from Municipal Wastewater. Environ. Sci. Technol. 2015, 49 (14), 8611–22. 10.1021/es505102v. [DOI] [PubMed] [Google Scholar]
- Venkatesan A. K.; Hamdan A. H.; Chavez V. M.; Brown J. D.; Halden R. U. Mass Balance Model for Sustainable Phosphorus Recovery in a US Wastewater Treatment Plant. Journal of environmental quality 2016, 45 (1), 84–9. 10.2134/jeq2014.11.0504. [DOI] [PubMed] [Google Scholar]
- Melia P. M.; Cundy A. B.; Sohi S. P.; Hooda P. S.; Busquets R. Trends in the recovery of phosphorus in bioavailable forms from wastewater. Chemosphere 2017, 186, 381–395. 10.1016/j.chemosphere.2017.07.089. [DOI] [PubMed] [Google Scholar]
- Mayer B. K.; Baker L. A.; Boyer T. H.; Drechsel P.; Gifford M.; Hanjra M. A.; Parameswaran P.; Stoltzfus J.; Westerhoff P.; Rittmann B. E. Total Value of Phosphorus Recovery. Environ. Sci. Technol. 2016, 50 (13), 6606–20. 10.1021/acs.est.6b01239. [DOI] [PubMed] [Google Scholar]
- Elser J.; Bennett E. Phosphorus cycle: a broken biogeochemical cycle. Nature 2011, 478 (7367), 29–31. 10.1038/478029a. [DOI] [PubMed] [Google Scholar]
- Hao X.; Wang C.; van Loosdrecht M. C.; Hu Y. Looking beyond struvite for P-recovery. Environ. Sci. Technol. 2013, 47 (10), 4965–6. 10.1021/es401140s. [DOI] [PubMed] [Google Scholar]
- Hug A.; Udert K. M. Struvite precipitation from urine with electrochemical magnesium dosage. Water Res. 2013, 47 (1), 289–99. 10.1016/j.watres.2012.09.036. [DOI] [PubMed] [Google Scholar]
- Randall D. G.; Krähenbühl M.; Köpping I.; Larsen T. A.; Udert K. M. A novel approach for stabilizing fresh urine by calcium hydroxide addition. Water Res. 2016, 95, 361–369. 10.1016/j.watres.2016.03.007. [DOI] [PMC free article] [PubMed] [Google Scholar]
- Ye Y.; Ngo H. H.; Guo W.; Liu Y.; Li J.; Liu Y.; Zhang X.; Jia H. Insight into chemical phosphate recovery from municipal wastewater. Sci. Total Environ. 2017, 576, 159–171. 10.1016/j.scitotenv.2016.10.078. [DOI] [PubMed] [Google Scholar]
- Wang L.; Nancollas G. H. Calcium orthophosphates: crystallization and dissolution. Chem. Rev. 2008, 108 (11), 4628–4669. 10.1021/cr0782574. [DOI] [PMC free article] [PubMed] [Google Scholar]
- Arabi S.; Nakhla G. Impact of calcium on the membrane fouling in membrane bioreactors. J. Membr. Sci. 2008, 314 (1–2), 134–142. 10.1016/j.memsci.2008.01.037. [DOI] [Google Scholar]
- Yuan P.; Kim Y. Increasing phosphorus recovery from dewatering centrate in microbial electrolysis cells. Biotechnol. Biofuels 2017, 10 (1), 70. 10.1186/s13068-017-0754-8. [DOI] [PMC free article] [PubMed] [Google Scholar]
- Diamadopoulos E.; Benedek A. The precipitation of phosphorus from wastewater through pH variation in the presence and absence of coagulants. Water Res. 1984, 18 (9), 1175–1179. 10.1016/0043-1354(84)90235-5. [DOI] [Google Scholar]
- Lei Y.; Song B.; van der Weijden R. D.; Saakes M.; Buisman C. J. Electrochemical Induced Calcium Phosphate Precipitation: Importance of Local pH. Environ. Sci. Technol. 2017, 51 (19), 11156–11164. 10.1021/acs.est.7b03909. [DOI] [PMC free article] [PubMed] [Google Scholar]
- Cusick R. D.; Logan B. E. Phosphate recovery as struvite within a single chamber microbial electrolysis cell. Bioresour. Technol. 2012, 107, 110–115. 10.1016/j.biortech.2011.12.038. [DOI] [PubMed] [Google Scholar]
- Hovelmann J.; Putnis C. V. In Situ Nanoscale Imaging of Struvite Formation during the Dissolution of Natural Brucite: Implications for Phosphorus Recovery from Wastewaters. Environ. Sci. Technol. 2016, 50 (23), 13032–13041. 10.1021/acs.est.6b04623. [DOI] [PubMed] [Google Scholar]
- Jeremiasse A. W.; Hamelers H. V.; Kleijn J. M.; Buisman C. J. Use of biocompatible buffers to reduce the concentration overpotential for hydrogen evolution. Environ. Sci. Technol. 2009, 43 (17), 6882–6887. 10.1021/es9008823. [DOI] [PubMed] [Google Scholar]
- Yuan Y.; Zhou S.; Tang J. In situ investigation of cathode and local biofilm microenvironments reveals important roles of OH− and oxygen transport in microbial fuel cells. Environ. Sci. Technol. 2013, 47 (9), 4911–4917. 10.1021/es400045s. [DOI] [PubMed] [Google Scholar]
- Song Y.; Hahn H. H.; Hoffmann E. Effects of solution conditions on the precipitation of phosphate for recovery: A thermodynamic evaluation. Chemosphere 2002, 48 (10), 1029–1034. 10.1016/S0045-6535(02)00183-2. [DOI] [PubMed] [Google Scholar]
- Lei Y.; Saakes M.; van der Weijden R. D.; Buisman C. J. Effects of current density, bicarbonate and humic acid on electrochemical induced calcium phosphate precipitation. Chem. Eng. J. 2018, 342, 350–356. 10.1016/j.cej.2018.02.104. [DOI] [Google Scholar]
- Wang C. C.; Hao X. D.; Guo G. S.; van Loosdrecht M. C. M. Formation of pure struvite at neutral pH by electrochemical deposition. Chem. Eng. J. 2010, 159 (1–3), 280–283. 10.1016/j.cej.2010.02.026. [DOI] [Google Scholar]
- Lei Y.; Song B.; van der Weijden R. D.; Saakes M.; Buisman C. J. Interaction of calcium, phosphorus and natural organic matter in electrochemical recovery of phosphate. Water Res. 2018, 142, 10–17. 10.1016/j.watres.2018.05.035. [DOI] [PubMed] [Google Scholar]
- Rau G. H. Electrochemical splitting of calcium carbonate to increase solution alkalinity: Implications for mitigation of carbon dioxide and ocean acidity. Environ. Sci. Technol. 2008, 42 (23), 8935–8940. 10.1021/es800366q. [DOI] [PubMed] [Google Scholar]
- Buljan Meić I.; Kontrec J.; Domazet Jurašin D.; Njegić Džakula B.; Štajner L.; Lyons D. M.; Dutour Sikirić M.; Kralj D. Comparative study of calcium carbonates and calcium phosphates precipitation in model systems mimicking the inorganic environment for biomineralization. Cryst. Growth Des. 2017, 17 (3), 1103–1117. 10.1021/acs.cgd.6b01501. [DOI] [Google Scholar]
- Wang H.; Alfredsson V.; Tropsch J.; Ettl R.; Nylander T. Formation of CaCO3 Deposits on Hard Surfaces-Effect of Bulk Solution Conditions and Surface Properties. ACS Appl. Mater. Interfaces 2013, 5 (10), 4035–4045. 10.1021/am401348v. [DOI] [PubMed] [Google Scholar]
- Jasper J. T.; Yang Y.; Hoffmann M. R. Toxic byproduct formation during electrochemical treatment of latrine wastewater. Environ. Sci. Technol. 2017, 51 (12), 7111–7119. 10.1021/acs.est.7b01002. [DOI] [PMC free article] [PubMed] [Google Scholar]
- Vanlangendonck Y.; Corbisier D.; Van Lierde A. Influence of operating conditions on the ammonia electro-oxidation rate in wastewaters from power plants (ELONITA technique). Water Res. 2005, 39 (13), 3028–3034. 10.1016/j.watres.2005.05.013. [DOI] [PubMed] [Google Scholar]
- Cao X.; Harris W. Carbonate and magnesium interactive effect on calcium phosphate precipitation. Environ. Sci. Technol. 2008, 42 (2), 436–442. 10.1021/es0716709. [DOI] [PubMed] [Google Scholar]
- Barca C.; Troesch S.; Meyer D.; Drissen P.; Andres Y.; Chazarenc F. Steel slag filters to upgrade phosphorus removal in constructed wetlands: two years of field experiments. Environ. Sci. Technol. 2013, 47 (1), 549–556. 10.1021/es303778t. [DOI] [PubMed] [Google Scholar]
Associated Data
This section collects any data citations, data availability statements, or supplementary materials included in this article.


