Abstract
Background:
Diabetic nephropathy (DN) occurs in 20%–40% of patients with diabetes, and it is characterized by proteinuria and progressive loss of renal functions ultimately leading to end-stage renal disease. Classically, albuminuria is regarded as a consequence of diabetes-induced glomerular damage. It is now being appreciated that the renal tubulointerstitium also plays a role in the development of DN.[1] Urinary cystatin C (UCC) is an emerging marker of DN. It is totally catabolized by proximal tubular cells and is not normally present in the urine. However, in the presence of tubulopathy, it is excreted in urine, and serum levels also are elevated due to lack of catabolism.
Materials and Methods:
The present study was conducted to evaluate the presence of glomerulopathy and tubulopathy in patients with type 2 diabetes mellitus (T2DM) and to correlate them with established risk factors for nephropathy. We aimed at evaluating the level of UCC as a marker of tubulointerstitial damage in patients with T2DM in relation to the level of albuminuria and other parameters. Seventy-two patients with T2DM (mean age, 47.44 ± 10.40 years) and 45 healthy age- and sex-matched subjects were evaluated for UCC, serum creatinine, and urinary albumin-creatinine ratio (UACR) along with other parameters.
Results:
Of the 72 patients included in the study, microalbuminuria was found in 26% and macroalbuminuria in 10% of cases. UCC was significantly higher in micro- and macro-albuminuric groups in comparison with normoalbuminuric patients and correlated positively with UACR. Among the 46 patients with normoalbuminuria, 11 had elevated UCC levels indicating early tubular dysfunction.
Conclusions:
This finding may support the hypothesis of a “tubular phase” of diabetic kidney disease preceding overt DN, and hence, the use of UCC measurement for early evaluation of renal involvement.
Keywords: Cystatin C, diabetic nephropathy, urinary albumin-creatinine ratio
INTRODUCTION
Diabetic nephropathy (DN) occurs in 20%–40% of patients with diabetes, and it is characterized by proteinuria and progressive loss of renal functions ultimately leading to end-stage renal disease.[1,2] Classically, albuminuria is regarded as a consequence of diabetes induced glomerular damage. It is now being appreciated that the renal tubulointerstitium also plays a role in the development of DN. In fact, although DN has typically been described as a glomerulopathy, tubular dysfunction is thought to occur earlier.[3,4,5,6,7] Serum creatinine (SCr) is a commonly used marker for estimation of the glomerular filtration rate (eGFR); nevertheless, SCr is known to be influenced by a number of factors such as gender, age, and muscle mass.[8,9,10,11]
Urinary cystatin C (UCC) has recently been suggested as an alternative marker in eGFR due to its favorable properties.[12,13,14] CysC is less affected by gender, age, and muscle mass than SCr. It has positive charge at physiological pH and its low-molecular weight facilitates free filtration by the renal glomeruli. It is completely catabolized in the proximal tubules of the kidney and is not normally present in the urine. In tubular diseases, the catabolism of cystatin C is reduced, and consequently, it appears in the urine. UCC may therefore be used as a marker for tubular dysfunction.[13,14]
The present study was conducted to evaluate the presence of glomerulopathy and tubulopathy in patients with type 2 diabetes mellitus (T2DM) and to correlate their presence with established risk factors for nephropathy.
MATERIALS AND METHODS
The present study is an observational case–control study, conducted in the Department of Endocrinology, Gauhati Medical College and Hospital, Guwahati, from January 2014 to October 2014. A total of 72 subjects with T2DM aged 30–65 years were included in the study. The exclusion criteria of the patients for the present study were active urinary tract infection, renal disease other than DN, pregnancy, history of any thyroid or liver disease, recent acute myocardial infarction or stroke, eGFR ≤30 ml/min/1.72 m2, history of any nephrotoxic medications, history of corticosteroid intake and smokers. The study was approved by the Institutional ethical committee and informed consent was obtained from every subject. A detailed clinical history was taken and complete general and systemic examination was done. Similarly, a control group of 45 healthy volunteers was selected. All subjects underwent the following investigations which included fasting plasma glucose and 2-h postprandial plasma glucose, glycosylated hemoglobin (HbA1c), SCr, fasting lipid profile, UCC, spot albumin: creatinine ratio (ACR), and 24 h urinary protein.
Early morning urine samples were collected, centrifuged, aliquoted, and stored at −20°C. Samples were thawed and mixed thoroughly just before the assay to avoid erroneous results of repeated freeze/thaw cycles. UCC was measured by enzyme-linked immunosorbent assay using human ELISA kit supplied by BioVendor Laboratory Medicine; Cat. No. RD191009100 (Lot no. E15-001 and E15-081). The intraassay coefficient of variation (CV) was 3.3 and interassay CV was 6.9%.
Data and statistical analysis were done using SAS version 9.3 (Cystatin C ELISA kits from bio vendor laboratory medicine, inc.). The data were expressed as mean ± standard deviation for normally distributed variables. Student's t-test was used to compare two different groups. Paired t-test was used to compare between similar groups. Pearson's correlation coefficient was used for analyzing the correlations between individual variables. P ≤ 0.05 was considered statistically significant.
RESULTS
Of the 72 patients enrolled in the study, 50 were male (69.44%) and 22 were female (30.55%) with a male:female ratio of 2.27:1. Patients ranged in age from 30 years to 65 years with a mean age of 47.44 years. Of the 45 controls, 30 were male (66.66%) and 15 were female (33%) with a M:F ratio of 2:1. The demographical characteristics and descriptive data of the study groups are shown in Table 1. The mean duration of diabetes was 5.76 ± 5.01 years, mean HbA1c was 9.31% ± 2.77%, and mean body mass index (BMI) was 22.48 ± 3.23. When this group was compared with the similar control group [Table 1], significant difference was seen with respect to HbA1c, urinary albumin creatinine ratio (UACR), 24 h urinary protein, UCC, TGL, high-density lipoprotein (HDL), mean systolic blood pressure (SBP), and mean diastolic blood pressure (DBP).
Table 1.
Clinical and biochemical data of cases and controls
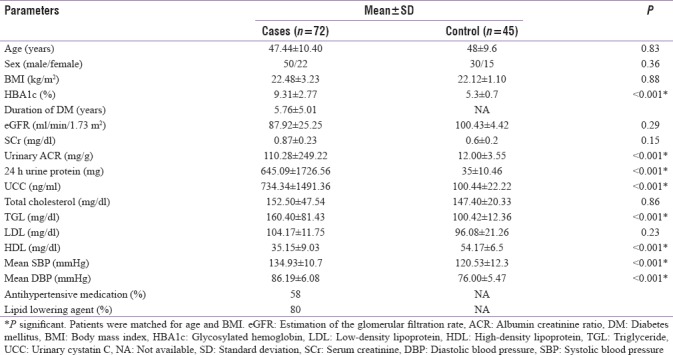
Microalbuminuria was found in 19 (26%) cases and macroalbuminuria was found in 7 (10%) cases. The mean UACR of the study group was 110.28 ± 249.22 mg/g creatinine and mean UCC was 734.34 ± 1491.36 ng/ml. Based on the UACR levels, the study group was divided into three albuminuric subgroups [Table 2], namely, normoalbuminuric (n = 46; i.e., 64%) with a mean UACR of 15.91 ± 7.77 mg/g creatinine, microalbuminuric (n = 19; i.e., 26%) with a mean UACR of 75.51 ± 45.15 mg/g creatinine, and macroalbuminuric (n = 7; i.e., 10%) with a mean UACR of 824.87 ± 246.09 mg/g creatinine. This difference in UACR between the different subgroups was found to be statistically significant (P = 0.0001).
Table 2.
Metabolic and laboratory parameters in patients with type 2 diabetes with respect to urinary albumin creatinine ratio (n=72)
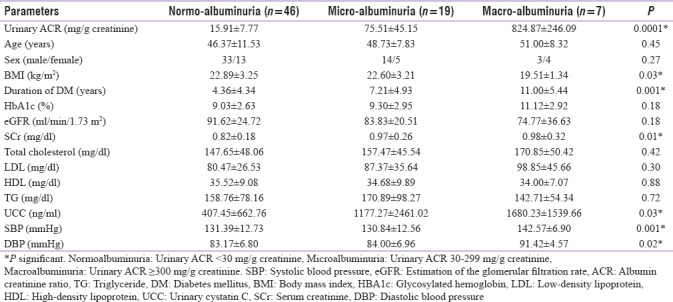
There was a statistically significant association between rising albumin excretion and BMI, duration of diabetes, SCr, UCC, and SBP and DBP. However, the association of ACR and rising HbA1c levels failed to achieve statistical significance.
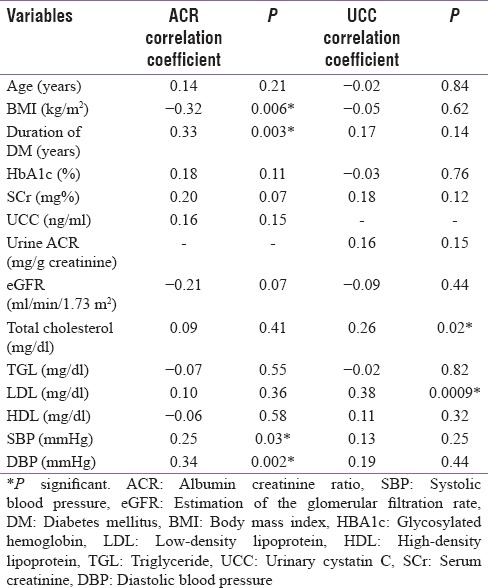
A significant positive correlation between UACR and duration of diabetes, SBP, and DBP and a significant negative correlation between UACR and BMI was found. A significant positive correlation between UCC and total cholesterol and LDL was seen. However, UCC failed to show any significant correlation with HbA1c, duration of diabetes, UACR, and blood pressure.
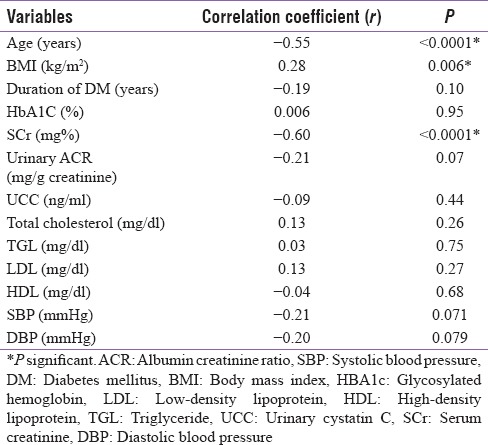
A significant negative correlation between eGFR and age of the patient and SCr and significant positive correlation between eGFR and BMI was noted. However, a negative correlation between eGFR and UCC failed to achieve statistical significance.
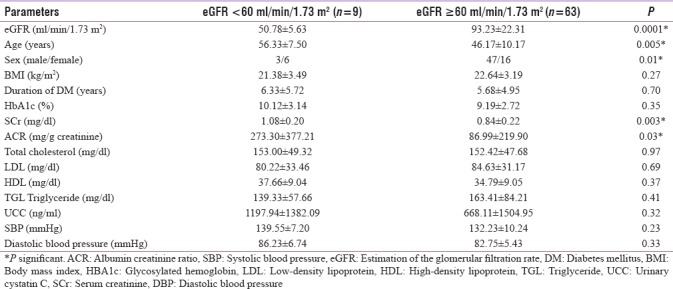
Patients with eGFR <60 ml/min/1.73 m2 were significantly older, had higher SCr, and higher UACR. However, there was no statistically significant difference between the two groups with regard to UCC, lipid parameters, or blood pressure.
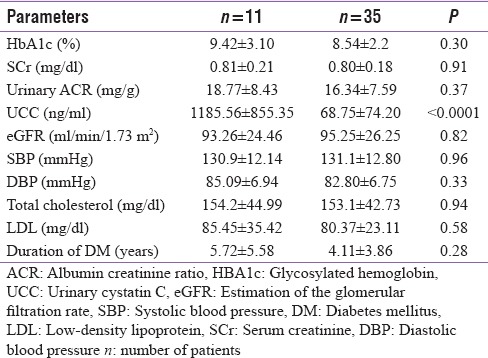
A subgroup of 11 patients had normal glomerular function (SCr and UACR) but deranged tubular function (elevated UCC). On comparing this group with the subgroup of patients who had normal glomerular as well as normal tubular function (n = 35), we found that except for cystatin C levels, there was no significant difference in these two groups.
DISCUSSION
This cross-sectional study presents data on prevalence and associations of nephropathy with various parameters in T2DM. From our study, we conclude that of the various risk factors assessed, only UACR, BMI, duration of diabetes, SCr, UCC, SBP, and DBP were found to be significant predictors of degree of albuminuria and hence glomerulopathy. On correlating the mean UACR with various risk factors, we found it to have a significantly positive correlation with the duration of diabetes, SBP, and DBP and a significantly negative correlation with BMI. Similar trend has been noted by Chowta et al.,[15] Runki et al.,[16] and De Cosmo et al.[17] when they compared UACR with duration of diabetes.
We found BMI to bear an inverse relationship with UACR in normoalbuminuric patients. This was similar to that found by Ibrahim et al.[13] Correlating the UACR with BMI, De Cosmo et al. found that there was a positive correlation in males, whereas in females, it was reported as statistically insignificant. Possible explanation for the negative correlation of UACR with BMI in our study could be that the study group was small and majority of patients belonged to the normoalbuminuric group.
It is known that HbA1c has a strong association with DN. However, in our study, though we found a positive association between HbA1c and UACR, we noted that this was statistically insignificant. Unlike our study, De Cosmo et al.[17] reported that a significant association exists between UACR and HbA1c levels in both sexes. Similarly, Friedman et al.[18] found significantly positive correlation between UACR and HbA1c levels. Kim et al.[14] and Jeon et al.[19] also reported similar trend, where significant correlation was found between HbA1c and degree of albuminuria. Mythili et al.[20] in their retrospective analysis of 100 cases also concluded that HbA1c and UACR bore a positive correlation. The positive but insignificant correlation between HbA1c and UACR in our study could be due to the short mean duration of diabetes in the study group and due to the fact that majority of our patients were on antihyperglycemic treatment.
UACR bore a significant positive correlation with both SBPand DBP in our study [Table 3]. This was in agreement with the findings of Friedman et al.[18] On the contrary, Ibrahim et al.[13] reported positive but insignificant correlation between UACR and SBP and DBP. Furthermore, on analyzing the SBP and DBP with respect to UACR, we found that both showed significant changes in different albuminuric groups. Kim et al.[14] and Jeon et al.[19] reported significant difference only in SBP with respect to UACR whereas changes in DBP with respect to UACR were found to be insignificant by both. This could be because of the fact that mean DBP showed increasing levels in the 3 different albuminuric groups in our study (majority of our cases not being on antihypertensive therapy), whereas the DBP values were equivalent in these three groups in the study by Kim et al.[14] and Jeon et al.[19]
Table 3.
Correlation between urinary albumin creatinine ratio, urinary cystatin C, and risk factors in cases (n=72)
Tubulointerstitial pathology in DN is thought to be caused by cell injury that is induced by high ambient glucose levels and increased proportions of glycated proteins. Other probable hypotheses include glomerular ultrafiltration of proteins and bioactive growth factors and their effects on tubular cells. Cystatin C, a 13-kDa endogenous cysteine proteinase inhibitor, is produced by nucleated cells at a constant rate.[21,22] Cystatin C is excreted by glomerular filtration and then undergoes essentially complete tubular reabsorption and catabolism (without secretion). In normal renal function, tubular reabsorption and catabolism of cystatin C are almost complete and cystatin C is only detected in very small quantities in the urine.[23,24,25]
Analyzing UCC levels as a marker of tubular dysfunction, our study showed that levels were significantly higher in cases compared to controls. We then correlated tubular dysfunction with various risk factors and found that total cholesterol and LDL levels had a positively significant correlation with UCC [Table 3]. Ibrahim et al.[13] also found similar positive correlation between UCC and total cholesterol but a negative correlation with LDL. Correlation between UCC and duration of diabetes was found to be positive but nonsignificant, while that between UCC and BMI was negative and nonsignificant in our study. Ibrahim et al.[13] reported similar nonstatistically significant findings on correlating UCC with duration of diabetes and BMI. UCC correlated negatively with HbA1c which was statistically insignificant. This is in accordance with the findings of Ibrahim et al.[13] who reported an insignificant negative correlation between the two.
We analyzed UCC levels between different albuminuric groups and found that levels were significantly elevated in all the three groups (normo-, micro-, macro-albuminuric). It was also noticed that UCC levels increased with increasing level of albumin excretion. Jeon et al.[19] reported a similar trend in the micro- and macro-albuminuric groups, whereas the normoalbuminuric group had normal UCC levels. Kim et al.[14] reported UCC levels to be significantly higher in the macroalbuminuria group than in the normo- and micro-albuminuria groups. However, they did not find significant difference in UCC levels between the normo- and micro-albuminuria groups. Early tubular dysfunction among patients with early DN can be the cause of the increased level of UCC in patients with microalbuminuria. Ibrahim et al.[13] reported that UCC has a diagnostic accuracy of 71.4% to predict the presence of microalbuminuria in early DN. Levels were significantly higher in patients with microalbuminuria without any other urinary abnormality and with normal SCr as compared to those without microalbuminuria or any other urinary abnormality and showed a positive correlation with UACR. They concluded that UCC level may be valuable marker for detection of microalbuminuria independent of any other tubular markers and independent of the degree of tubular dysfunction, and that it can be used as a good predictor for the presence of microalbuminuria in early DN.
On performing subgroup analysis of 11 subjects with no glomerulopathy (i.e., normal UACR, eGFR ≥60 ml/min/1.73 ml), we found them to be having elevated UCC [Table 6]. This again indicates that UCC can serve as an early marker of DN. On comparing this group with the subgroup of patients who had normal glomerular as well as normal tubular function (n = 35), we found that except for cystatin C levels, there was no significant difference in these two groups and both groups were comparable.
Table 6.
Clinical and laboratory parameters of patients with normoalbuminuria and elevated urinary cystatin C levels (n=11) verses normal urinary cystatin C levels (n=35)
eGFR being a widely accepted as the best overall index of kidney function, we tried to correlate it with different risk factors [Table 4]. We found a negative correlation between eGFR and age, duration of diabetes, SCr, UACR, UCC, HDL, SBP, and DBP. However, this negative correlation attained statistical significance only for age and SCr. BMI showed a significant positive correlation with eGFR.
Table 4.
Correlation between estimation of the glomerular filtration rate and risk factors (n=72)
UCC level was found to be higher in patients with advanced nephropathy (eGFR <60 ml/min/1.73 m2) than those with early renal disease (eGFR >60 ml/min/1.73 m2) [Table 5]. However, a negative correlation between mean eGFR and UCC failed to achieve statistical significance. Patients with eGFR <60 ml/min/1.73 m2 were significantly older, had higher SCr, and had higher UACR. These findings corroborate with those of Jeon et al.[19] who reported increase in the age, UACR, SCr, and UCC levels in patients with eGFR <60 ml/min/1.73 m2. This increase was significant for all except UACR. Similarly, the mean levels of SBP and DBP in patients with eGFR <60 ml/min/1.73 m2 as well as eGFR ≥60 ml/min/1.73 m2 were found to be statistically insignificant in our study. Jeon et al.[19] and Solini et al.[26] reported similar findings.
Table 5.
Characteristics of metabolic and laboratory parameters in patients with type 2 diabetes with respect to estimation of the glomerular filtration rate at baseline (n=72)
Cystatin C being a novel marker of tubulopathy, various groups in the recent past have tried to establish its role as an early predictor of tubulopathy by assessing its serum levels. Correlation between UCC and various risk factors for DN is still in need of attention and very few such studies have been reported till date.
Analyzing the risk factors that served as indicators of glomerulopathy and tubulopathy, we found that glomerular dysfunction was present in 26 (36%) cases [Table 2]. The mean value for Cystatin C which is a marker of tubulopathy was 734.34 ± 1491.36 being deranged in 30 (42%) cases [Table 1]. This helps us to acknowledge the fact that the sole dependence on glomerular markers can lead to delayed detection of DN as it may not be detected in the early stages when only tubulopathy is present.
Limitations of the present study must also be considered. As our study was not based on the general population, selection bias might have affected the outcome of the study. Larger sample size in general population may be required to confirm the results of the present study.
CONCLUSIONS
We thus conclude that UCC may be one of the early biomarkers of DN and may be detected much before glomerulopathy sets in. Long-term prospective studies are required to further define its role in early detection of renal damage in patients of DM. This early detection of renal damage may help initiation of timely treatment and prevent/delay renal complications of diabetes.
Financial support and sponsorship
Nil.
Conflicts of interest
There are no conflicts of interest.
REFERENCES
- 1.American Diabetes Association. Standards of medical care in diabetes-2007. Diabetes Care. 2007;30:S4–41. doi: 10.2337/dc07-S004. [DOI] [PubMed] [Google Scholar]
- 2.Brenner BM, Cooper ME, de Zeeuw D, Keane WF, Mitch WE, Parving HH, et al. Effects of losartan on renal and cardiovascular outcomes in patients with type 2 diabetes and nephropathy. N Engl J Med. 2001;345:861–9. doi: 10.1056/NEJMoa011161. [DOI] [PubMed] [Google Scholar]
- 3.Fioretto P, Caramori ML, Mauer M. The kidney in diabetes: Dynamic pathways of injury and repair. The Camillo Golgi lecture 2007. Diabetologia. 2008;51:1347–55. doi: 10.1007/s00125-008-1051-7. [DOI] [PubMed] [Google Scholar]
- 4.Bohle A, Wehrmann M, Bogenschütz O, Batz C, Müller CA, Müller GA. The pathogenesis of chronic renal failure in diabetic nephropathy. Investigation of 488 cases of diabetic glomerulosclerosis. Pathol Res Pract. 1991;187:251–9. doi: 10.1016/s0344-0338(11)80780-6. [DOI] [PubMed] [Google Scholar]
- 5.Marcussen N. Atubular glomeruli and the structural basis for chronic renal failure. Lab Invest. 1992;66:265–84. [PubMed] [Google Scholar]
- 6.Singh DK, Winocour P, Farrington K. Mechanisms of disease: The hypoxic tubular hypothesis of diabetic nephropathy. Nat Clin Pract Nephrol. 2008;4:216–26. doi: 10.1038/ncpneph0757. [DOI] [PubMed] [Google Scholar]
- 7.D'Amico G, Ferrario F, Rastaldi MP. Tubulointerstitial damage in glomerular diseases: Its role in the progression of renal damage. Am J Kidney Dis. 1995;26:124–32. doi: 10.1016/0272-6386(95)90165-5. [DOI] [PubMed] [Google Scholar]
- 8.Perrone RD, Madias NE, Levey AS. Serum creatinine as an index of renal function: New insights into old concepts. Clin Chem. 1992;38:1933–53. [PubMed] [Google Scholar]
- 9.Jones CA, McQuillan GM, Kusek JW, Eberhardt MS, Herman WH, Coresh J, et al. Serum creatinine levels in the US population: Third National Health and Nutrition Examination Survey. Am J Kidney Dis. 1998;32:992–9. doi: 10.1016/s0272-6386(98)70074-5. Erratum in: Am J Kidney Dis 2000;35:179. [DOI] [PubMed] [Google Scholar]
- 10.Swedko PJ, Clark HD, Paramsothy K, Akbari A. Serum creatinine is an inadequate screening test for renal failure in elderly patients. Arch Intern Med. 2003;163:356–60. doi: 10.1001/archinte.163.3.356. [DOI] [PubMed] [Google Scholar]
- 11.Baxmann AC, Ahmed MS, Marques NC, Menon VB, Pereira AB, Kirsztajn GM, et al. Influence of muscle mass and physical activity on serum and urinary creatinine and serum cystatin C. Clin J Am Soc Nephrol. 2008;3:348–54. doi: 10.2215/CJN.02870707. [DOI] [PMC free article] [PubMed] [Google Scholar]
- 12.Vaidya VS, Niewczas MA, Ficociello LH, Johnson AC, Collings FB, Warram JH, et al. Regression of microalbuminuria in type 1 diabetes is associated with lower levels of urinary tubular injury biomarkers, kidney injury molecule-1, and N-acetyl-ß-D-glucosaminidase. Kidney Int. 2011;79:464–70. doi: 10.1038/ki.2010.404. [DOI] [PMC free article] [PubMed] [Google Scholar]
- 13.Ibrahim MA, Ahmed YS, El-Shinnawy HA, Maseeh IY, Makkeyah YM, et al. Value of urinary cystatin C in early detection of diabetic nephropathy in type 2 diabetes mellitus. Int J Adv Res Biol Sci. 2015;2:211–23. [Google Scholar]
- 14.Kim SS, Song SH, Kim IJ, Jeon YK, Kim BH, Kwak IS, et al. Urinary cystatin C and tubular proteinuria predict progression of diabetic nephropathy. Diabetes Care. 2013;36:656–61. doi: 10.2337/dc12-0849. [DOI] [PMC free article] [PubMed] [Google Scholar]
- 15.Chowta NK, Pant P, Chowta MN. Microalbuminuria in diabetes mellitus: Association with age, sex, weight, and creatinine clearance. Indian J Med Res. 2012;136:46–53. doi: 10.4103/0971-4065.53322. [DOI] [PMC free article] [PubMed] [Google Scholar]
- 16.Runki, et al. Determine the relation between duration of type 2 diabetes mellitus and its complication – Diabetic nephropathy. IOSR J Dent Med Sci. 2015;14:91–5. [Google Scholar]
- 17.De Cosmo S, Copetti M, Lamacchia O, Fontana A, Massa M, Morini E, et al. Development and validation of a predicting model of all-cause mortality in patients with type 2 diabetes. Diabetes Care. 2013;36:2830–5. doi: 10.2337/dc12-1906. [DOI] [PMC free article] [PubMed] [Google Scholar]
- 18.Friedman AN, Marrero D, Ma Y, Ackermann R, Narayan KM, Barrett-Connor E, et al. Value of urinary albumin-to-creatinine ratio as a predictor of type 2 diabetes in pre-diabetic individuals. Diabetes Care. 2008;31:2344–8. doi: 10.2337/dc08-0148. [DOI] [PMC free article] [PubMed] [Google Scholar]
- 19.Jeon YK, Kim MR, Huh JE, Mok JY, Song SH, Kim SS, et al. Cystatin C as an early biomarker of nephropathy in patients with type 2 diabetes. J Korean Med Sci. 2011;26:258–63. doi: 10.3346/jkms.2011.26.2.258. [DOI] [PMC free article] [PubMed] [Google Scholar]
- 20.Mythili S, Sridevi AJ, Manjula Devi, et al. Correlation of serum bilirubin, glycemic control and albuminuria in type 2 diabetes mellitus – A retrospective study. Int J Pharm Bio Sci. 2013;4:162–9. [Google Scholar]
- 21.Dworkin LD. Serum cystatin C as a marker of glomerular filtration rate. Curr Opin Nephrol Hypertens. 2001;10:551–3. doi: 10.1097/00041552-200109000-00001. [DOI] [PubMed] [Google Scholar]
- 22.Newman DJ. Cystatin C. Ann Clin Biochem. 2002;39:89–104. doi: 10.1258/0004563021901847. [DOI] [PubMed] [Google Scholar]
- 23.Randers E, Erlandsen EJ. Serum cystatin C as an endogenous marker of the renal function – A review. Clin Chem Lab Med. 1999;37:389–95. doi: 10.1515/CCLM.1999.064. [DOI] [PubMed] [Google Scholar]
- 24.Vinge E, Lindergård B, Nilsson-Ehle P, Grubb A. Relationships among serum cystatin C, serum creatinine, lean tissue mass and glomerular filtration rate in healthy adults. Scand J Clin Lab Invest. 1999;59:587–92. doi: 10.1080/00365519950185076. [DOI] [PubMed] [Google Scholar]
- 25.Laterza OF, Price CP, Scott MG. Cystatin C: An improved estimator of glomerular filtration rate? Clin Chem. 2002;48:699–707. [PubMed] [Google Scholar]
- 26.Solini A, Manca ML, Penno G, Pugliese G, Cobb JE, Ferrannini E. Prediction of declining renal function and albuminuria in patients with type 2 diabetes by metabolomics. J Clin Endocrinol Metab. 2016;101:696–704. doi: 10.1210/jc.2015-3345. [DOI] [PubMed] [Google Scholar]


